Intervale Multi-Family Investment
For Sale
$599,900
Pending
66 Intervale Cross RD #A & B, Conway, NH 03818
Charming multi-family property with income potential near North Conway.
Property Size2,571 SF
Days on Market161
Property Features for 66 Intervale Cross RD #A & B
General Information
Standard status
Pending
Size
2,571 SF
Property subtype
Multi-Family
Zoning
RA
Building Details
Building Size
2,571 SF
Year Built
1900
Stories
2
Listing Agency:
Badger Peabody & Smith Realty
Listed By:
Grace T Mark
(603) 823-5700
Source:
Hometown-team
Added: May 10
Changed: Aug 8
Last Checked: Jul 17 at 2:49PM
Displayed information is deemed reliable but is not guaranteed and should be independently verified. All listing content including descriptions, pricing, images are the copyrighted material of Badger Peabody & Smith Realty

Ask AI about this property
Review the available facts, identify missing information and prepare questions for the agent.
Investment Insights
Based on property information with market context.
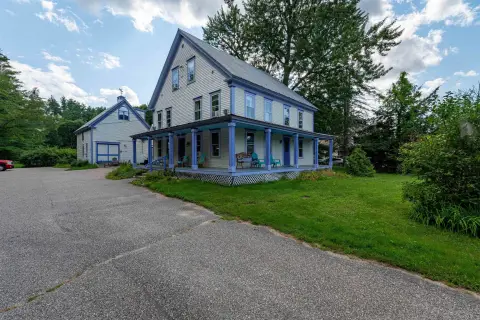
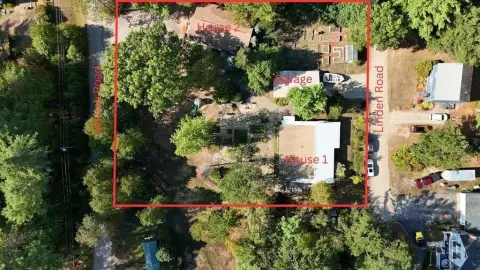
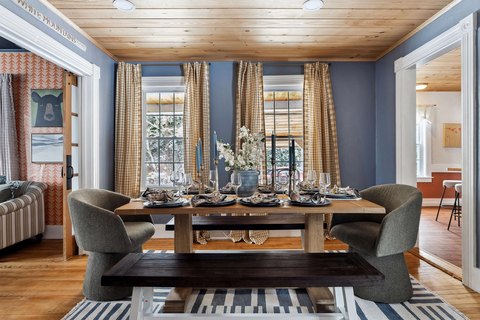
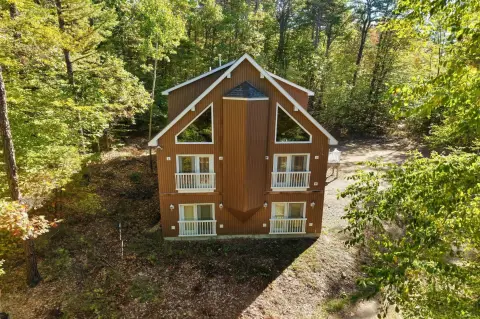
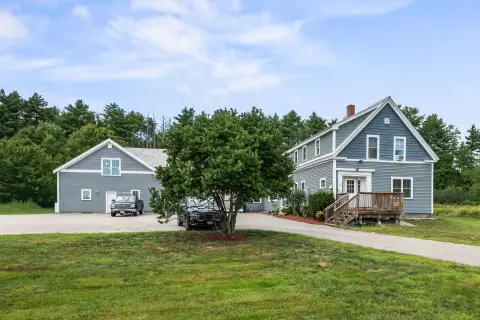
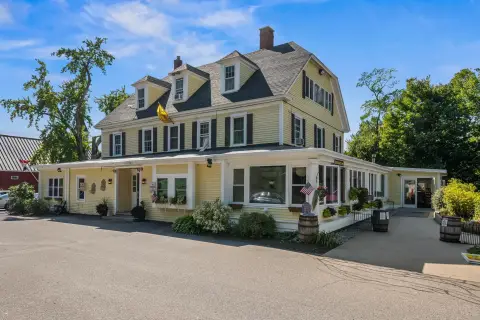
This multi-family property, located in Intervale, in the heart of Mount Washington Valley, was built in 1900 and has been updated over the years. It features two distinct homes. The property includes a 1-bedroom, 1-bathroom carriage house, which was once the historic Intervale Post Office, featuring wood details and modern accents. The property also includes a larger 3-bedroom, 1.5-bathroom New England farmhouse, formerly the Postmaster's residence, which has operated as a short-term rental for the past five years. The property is connected to town water and sewer and includes a large barn offering storage or future renovation possibilities. The property is located minutes from North Conway Village, Cranmore Mountain, shopping, dining, and recreation, with Whitaker Woods trails and the Scenic Vista nearby. The property size is 2571 square feet.
Key Highlights
- Successful short‑term rental history with strong income (farmhouse).
- Prime location: Minutes from North Conway, Cranmore Mountain, shopping, dining, and recreation.
- Two distinct homes: A 3‑bedroom farmhouse and a 1‑bedroom carriage house (former Post Office).
Financial Insights
Estimated NOI and Cap Rate
NOI / Yr
$26,458
Cap Rate
4.41%
Suggested Prices Based on Cap Rates
Cap Rate 5%
$529,160
$529.2K
Cap Rate 7%
$377,971
$378.0K
Cap Rate 9%
$293,978
$294.0K
Market Conditions
NOI Build-Up for 2,571 SF
Gross rent
$50.9K $19.80/SF
− Vacancy
−$2.8K −$1.09/SF
EGI
$48.1K $18.71/SF
− OpEx
−$21.6K −$8.42/SF
NOI
$26.5K $10.29/SF
Area
Carroll County, NH
Vacancy
5.50%
Lease Rate
$19.80 /SF/Yr
Expense Ratio
45.00%
Simulate Cap Rate and NOI
Suggested Prices Based on Cap Rates
Cap Rate 5%
$529,160
Cap Rate 7%
$377,971
Cap Rate 9%
$293,978
Alternative Uses
Best Use
Apartment 5plus
$378.0K
$330.7K – $441.0K
NOI $26,458 @ 7.0% cap · market cap 4.41%
Second Best
—
—
no second resolved use
Theoretical Best
Office A
$642.0K
$561.7K – $749.0K
NOI $44,938 @ 7.0% cap · market cap 7.49%
Zoning and permitted uses should be independently verified with authorities.
How Realmo checks its estimates
Property Analytics
Current Use
Location Intelligence
Trade Area within ½ mile
1
Businesses Nearby
Explore this area
Business Placement
Demographics for 03818, NH
3,478
Population
2,174
Households
1.6
Avg Household Size
49
Median Age
43%
College-Educated
95%
High-School Grad
84.5 sq mi
ZIP Area
41
Density / Sq Mi
$73,346
Median Household Income
$38,714
Median Earnings
$941
Median Rent
$284,200
Median Home Value
Market
Vacancy Rate% for Multifamily in Northeast region




Frequently Asked Questions
What type of property is this?
Short term rental property - Charming multi-family property with income potential near North Conway.
Where is this short term rental property located?
The property is located at 66 Intervale Cross RD #A & B Conway, NH.
What is the asking price?
The asking price for this property is $599,900.
What are key features of this property?
This property features: Successful short‑term rental history with strong income (farmhouse).; Prime location: Minutes from North Conway, Cranmore Mountain, shopping, dining, and recreation.; Two distinct homes: A 3‑bedroom farmhouse and a 1‑bedroom carriage house (former Post Office).


