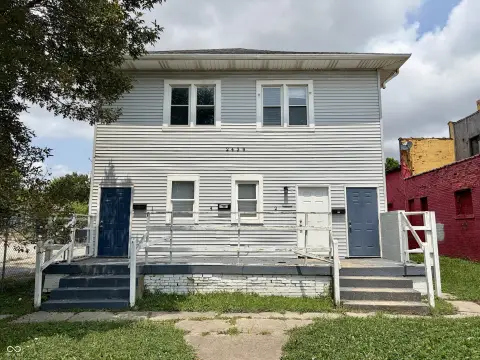
Historic Woodruff Place Multifamily
For Sale
$525,000
640 Woodruff Place Middle Drive, Indianapolis, IN 46201
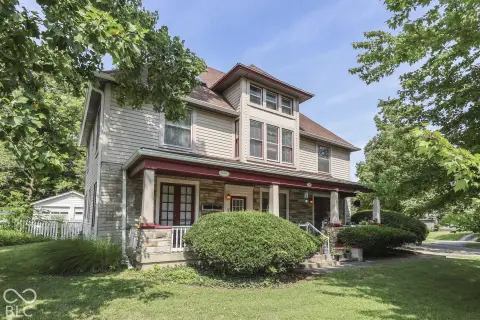
Four-unit property in historic Woodruff Place, Indianapolis. Leased and updated.
Property Size5,140 SF
Price / SF$102.14
Days on Market246
Property Features for 640 Woodruff Place Middle Drive
General Information
Standard status
Active
Size
5,140 SF
Property subtype
Residential Income / Quadruplex
Zoning
D5
Amenities
Central Air
Forced Air
Yes
Building Details
Year Built
1910
Listing Agency:
F.C. Tucker Company
Listed By:
Sarah Fishburn · License #RB19001567
(317) 686-0612
Source:
Compass
Added: Feb 9
Changed: Oct 10
Last Checked: Oct 11 at 8:24AM
Displayed information is deemed reliable but is not guaranteed and should be independently verified. All listing content including descriptions, pricing, images are the copyrighted material of F.C. Tucker Company
Investment Insights
Based on property information with market context.
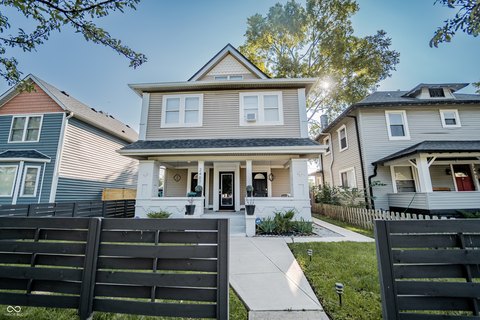
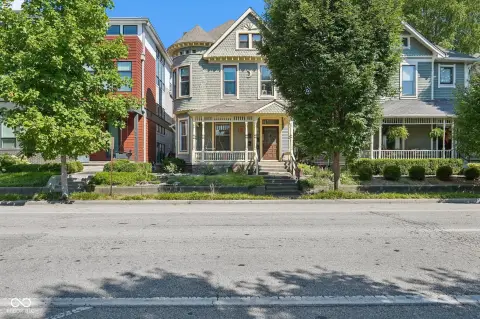
This four-unit multifamily property is located in the historic Woodruff Place neighborhood. The property is being offered for sale individually or as part of a portfolio opportunity that includes four additional nearby buildings. All units are currently leased, providing income. Recent improvements include a new sewer, remodeled bathrooms in three of the four units, remodeled kitchens in two units, and a new AC unit in one unit. The roof was replaced in 2021. The property is located minutes from downtown Indianapolis, benefiting from the neighborhood's walkability and rental demand. The property size is 4377 square feet.
Key Highlights
- Immediate income and stable cash flow from 100% leased units.
- Rare opportunity to acquire property in the desirable historic Woodruff Place neighborhood.
- Potential to purchase as part of a portfolio with four additional nearby buildings.
Financial Insights
Estimated NOI and Cap Rate
NOI / Yr
$47,171
Cap Rate
8.98%
Suggested Prices Based on Cap Rates
Cap Rate 5%
$943,420
$943.4K
Cap Rate 7%
$673,871
$673.9K
Cap Rate 9%
$524,122
$524.1K
Market Conditions
NOI Build-Up for 5,140 SF
Gross rent
$92.5K $18.00/SF
− Vacancy
−$6.8K −$1.31/SF
EGI
$85.8K $16.69/SF
− OpEx
−$38.6K −$7.51/SF
NOI
$47.2K $9.18/SF
Area
Indianapolis, IN
Vacancy
7.30%
Lease Rate
$18.00 /SF/Yr
Expense Ratio
45.00%
Simulate Cap Rate and NOI
Suggested Prices Based on Cap Rates
Cap Rate 5%
$943,420
Cap Rate 7%
$673,871
Cap Rate 9%
$524,122
Alternative Uses
Best Use
Multifamily LT 5
$775.0K
$678.1K – $904.1K
NOI $54,248 @ 7.0% cap · market cap 10.33%
Second Best
Apartment 5plus
$673.9K
$589.6K – $786.2K
NOI $47,171 @ 7.0% cap · market cap 8.98%
Theoretical Best
Office A
$1.28M
$1.12M – $1.49M
NOI $89,559 @ 7.0% cap · market cap 17.06%
Zoning and permitted uses should be independently verified with authorities.
How Realmo checks its estimates
Property Analytics
Unlock full access to Insights
Subscribe to Realmo Intelligence
Open Analytics
Current Use
Location Intelligence
Trade Area within ½ mile
1,030
Businesses Nearby
Explore this area
Business Placement
Demographics for 46201, IN
31,408
Population
17,145
Households
1.8
Avg Household Size
34
Median Age
26%
College-Educated
78%
High-School Grad
5.6 sq mi
ZIP Area
5,609
Density / Sq Mi
$43,183
Median Household Income
$36,951
Median Earnings
$929
Median Rent
$150,600
Median Home Value
Check the figures for this property
Cap Rate, Value Estimation, Potential NOI and more
View Realmo Analytics
Market
Vacancy Rate% for Multifamily in Midwest region

Questions? Ask Rey
Realmo’s AI knows this listing — price, zoning, demand, history. Ask anything.





Frequently Asked Questions
What type of property is this?
Quadplex - Four-unit property in historic Woodruff Place, Indianapolis. Leased and updated.
Where is this quadplex located?
The property is located at 640 Woodruff Place Middle Drive Indianapolis, IN.
What is the asking price?
The asking price for this property is $525,000.
What are key features of this property?
This property features: Immediate income and stable cash flow from 100% leased units.; Rare opportunity to acquire property in the desirable historic Woodruff Place neighborhood.; Potential to purchase as part of a portfolio with four additional nearby buildings.


