Manufacturing Facility with Railroad
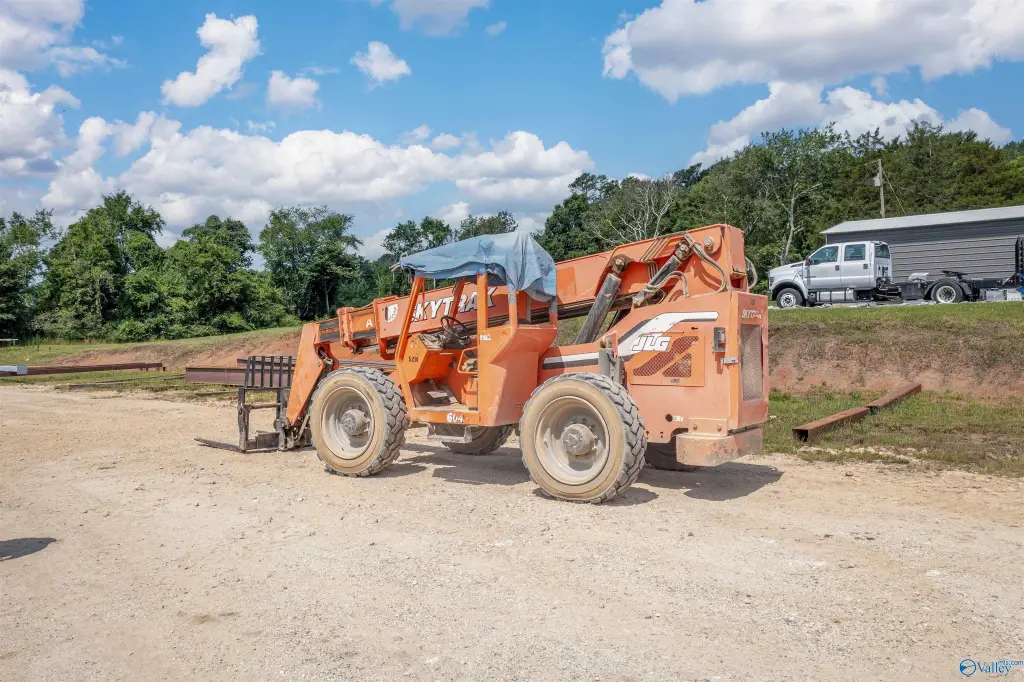
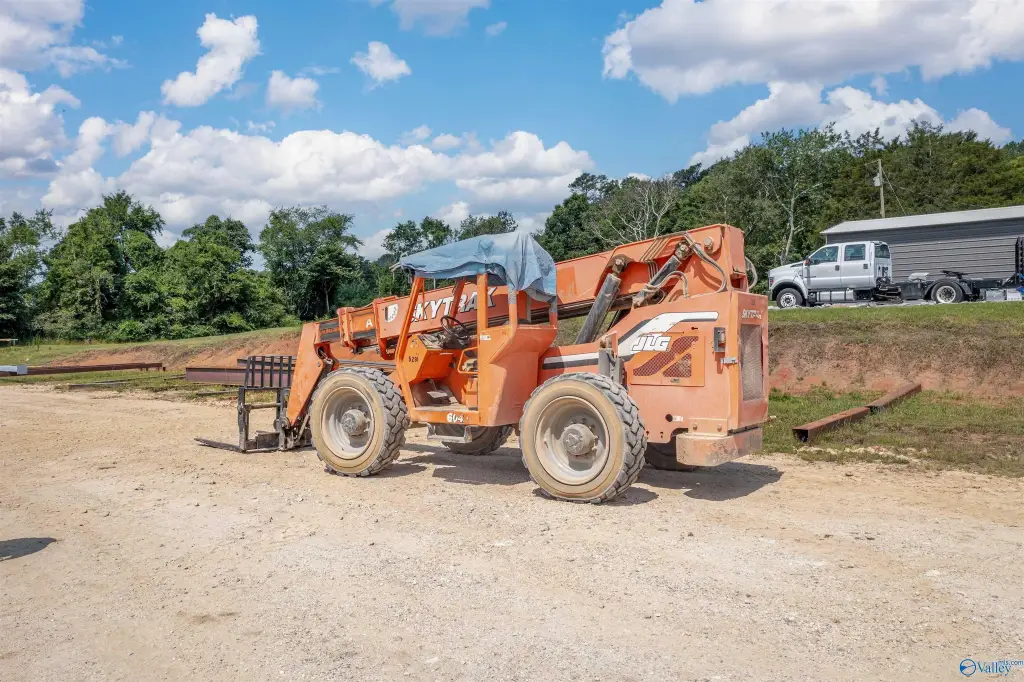
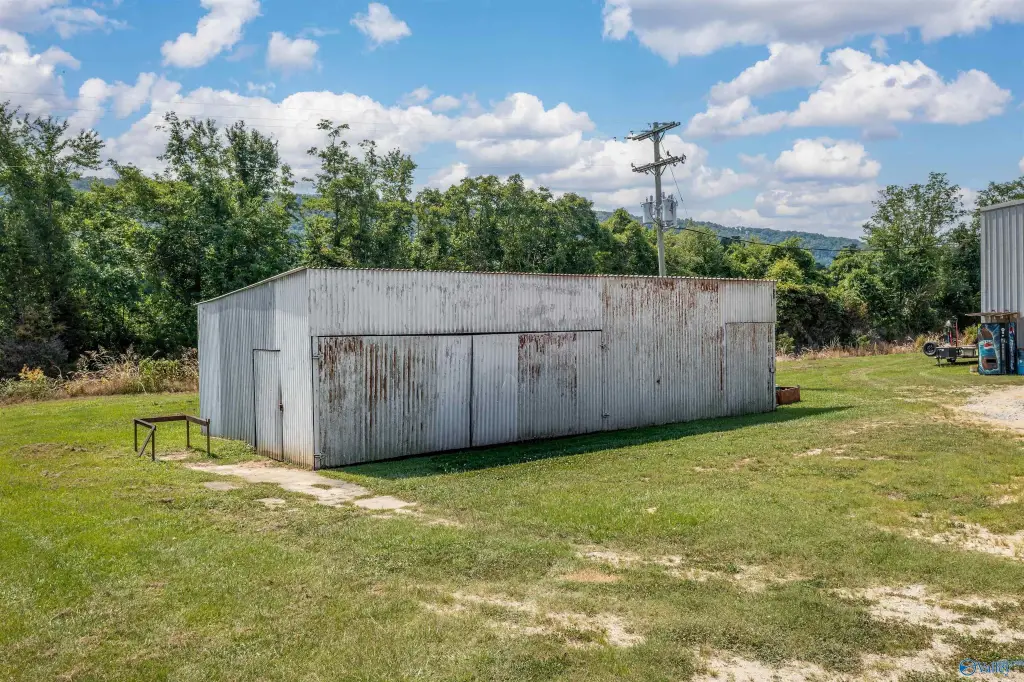
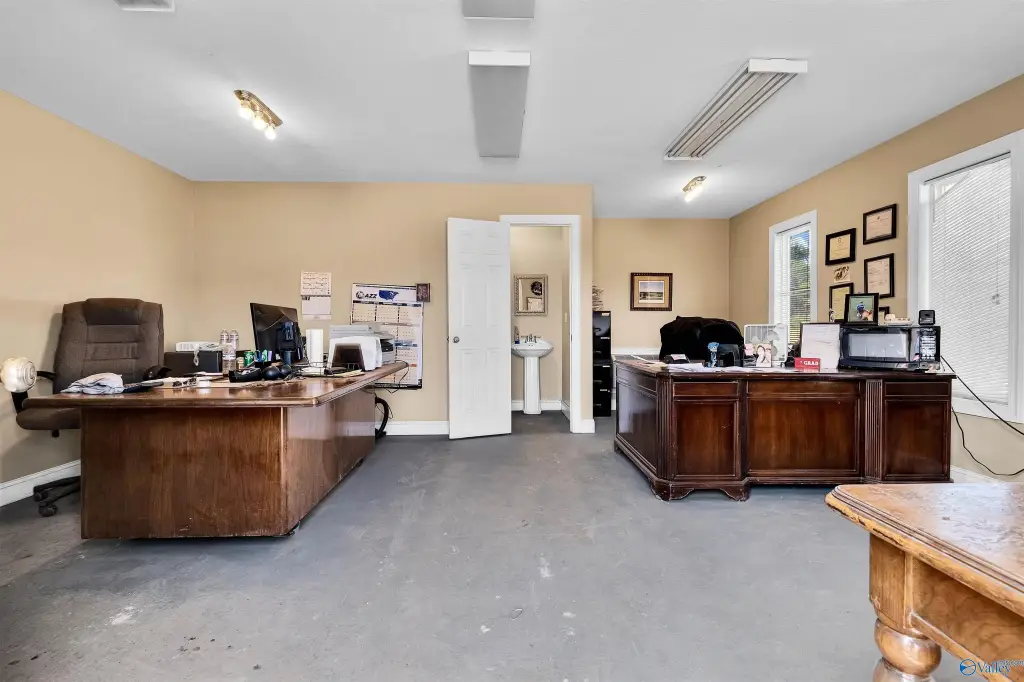
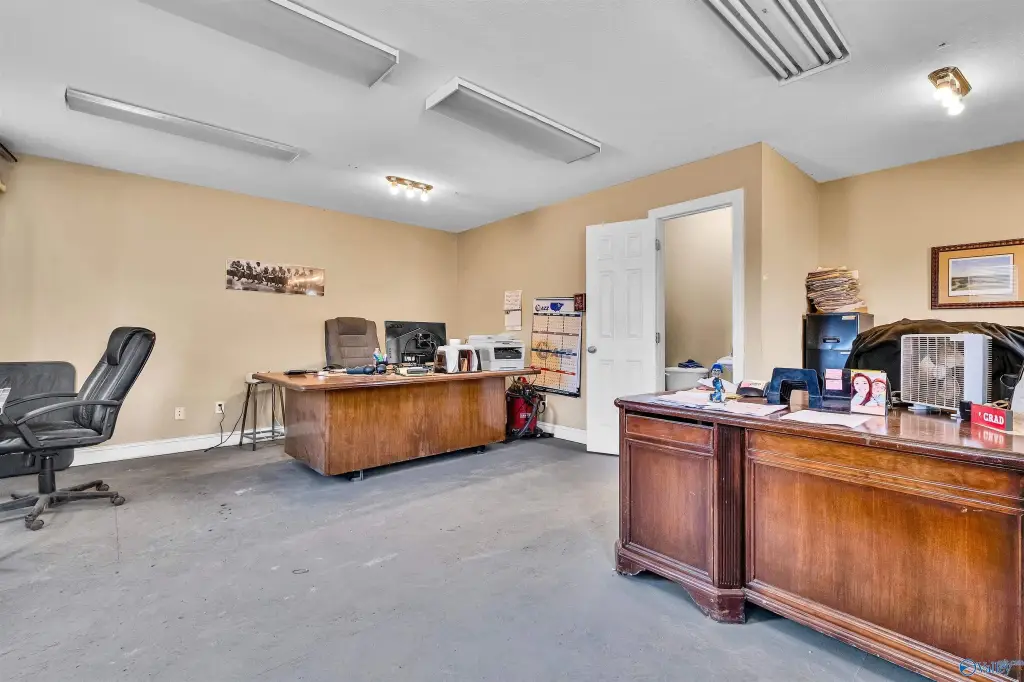
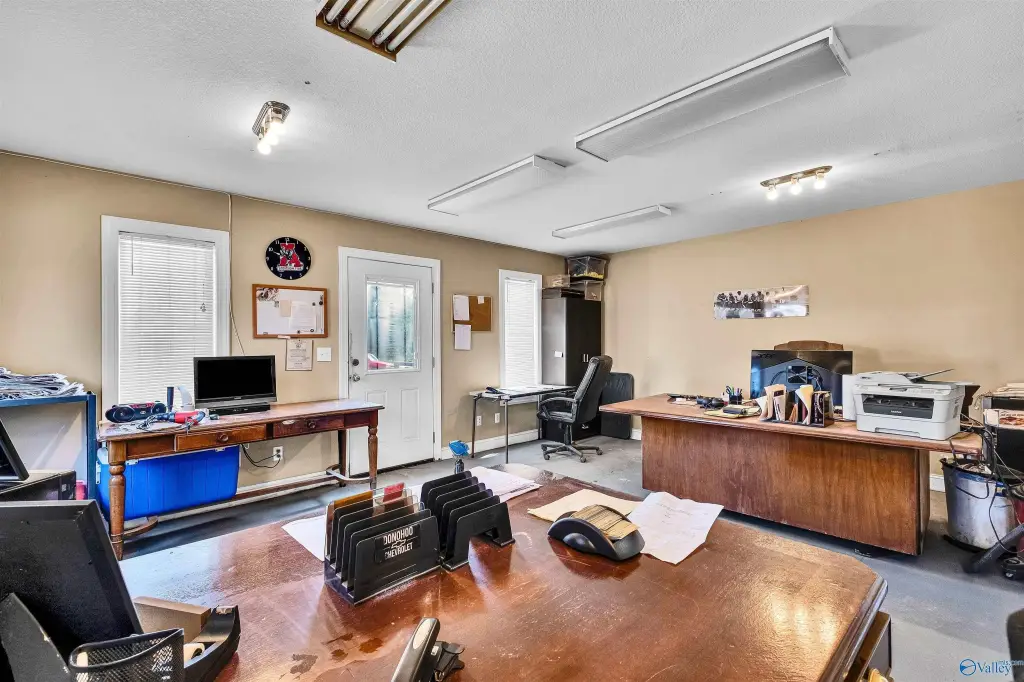
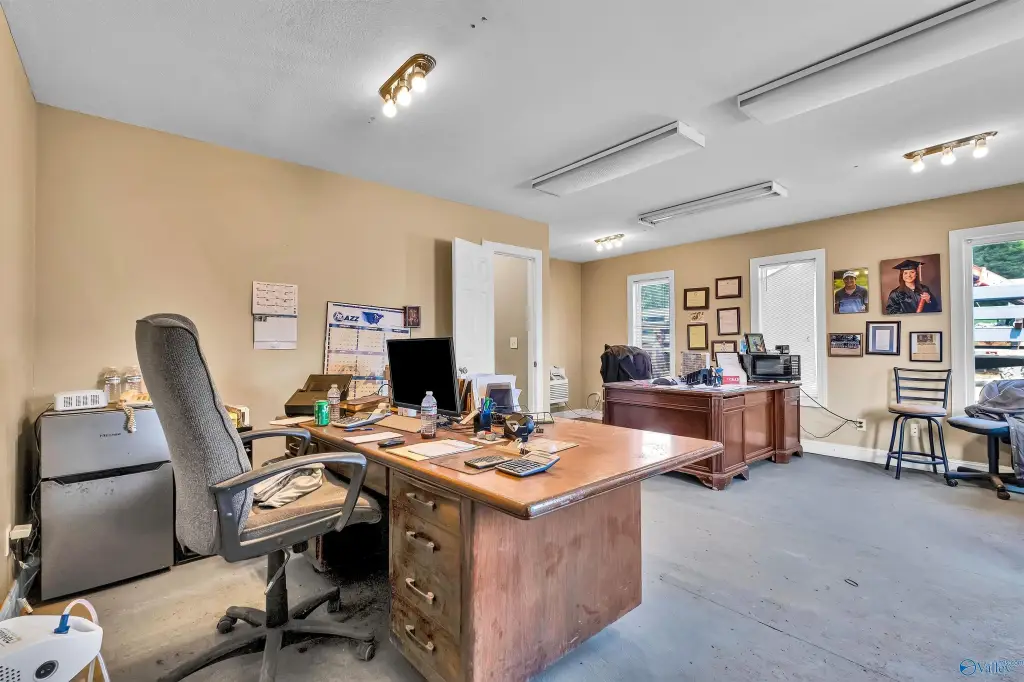
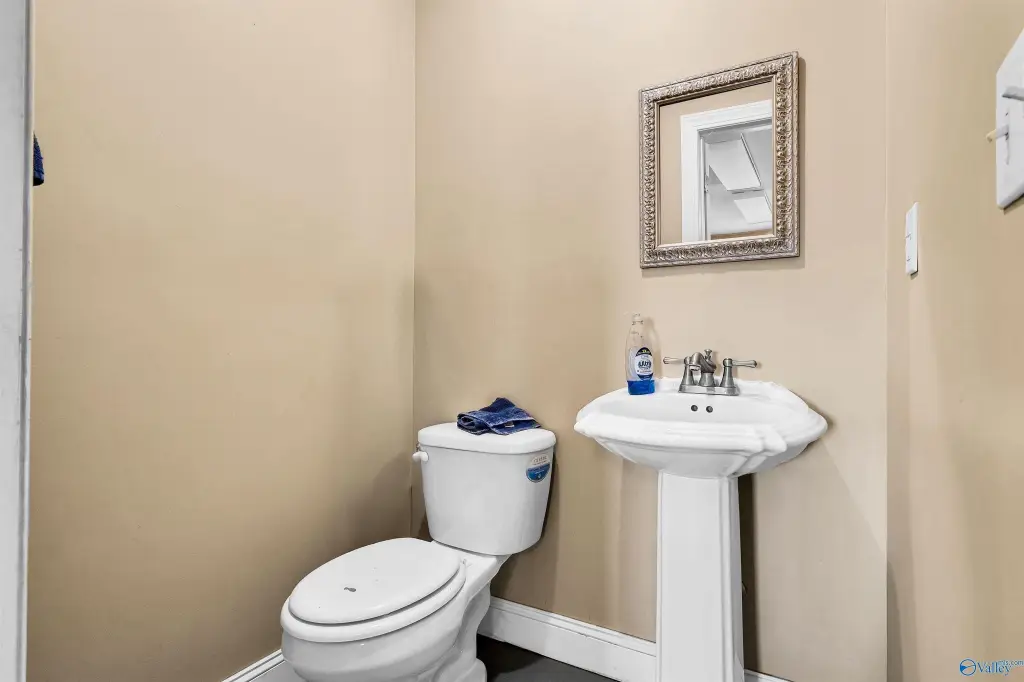
For Sale
$399,000
64 Jeff Cook Drive, Valley Head, AL 35967
Business Opportunity, Valley Head, AL
Property Size4,000 SF
Lot Size2.44 Acres
Price / SF$99.75
Days on Market108

Ask AI about this property
Review the available facts, identify missing information and prepare questions for the agent.
Property Features for 64 Jeff Cook Drive
General Information
Property type
Commercial Sale
Property subtype
Other
Zoning description
Business, Commercial, Industrial
Bathrooms
2
Full bathrooms
2
Rooms
Bathroom 1, Bathroom 2
Directions
From Valley Head At The Intersection Of Al Hwy 117 And County Road 137, Take County Road 137 0.5 Mi Toward Fort Payne And Turn Left Onto Jeff Cook Drive. Business Is At Dead End On The Right.
Standard status
Active
APN
1009310001039.001
Size
4,000 SF
Lot size
2.44 Acres
Utilities
Sewer type
Septic Tank
Heating system
Electric (Heating)
Cooling system
Wall Unit(s)
Water source
Public
Building Details
Year built
2002
Floors in Building
1
Roof type
Metal, Shingle
Listing Agency:
Swafford Auction Group LLC
(256) 927-8900
Listed By:
Shane Swafford · License #58627
(256) 509-5172
Added: Jun 30
Changed: Oct 14
Last Checked: Oct 15 at 1:06PM
MLS# 21922282
Copyright © 2026 ValleyMLS.Com,Inc. All rights reserved. All information provided by the listing agent/broker is deemed reliable but is not guaranteed and should be independently verified.
Investment Insights
Based on property information with market context.
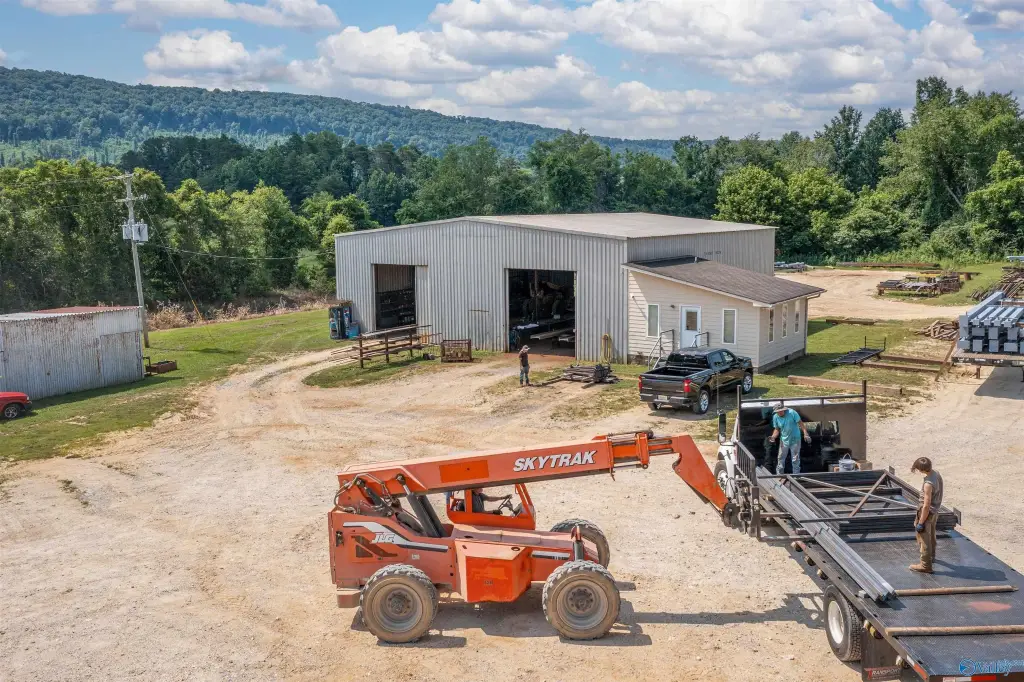
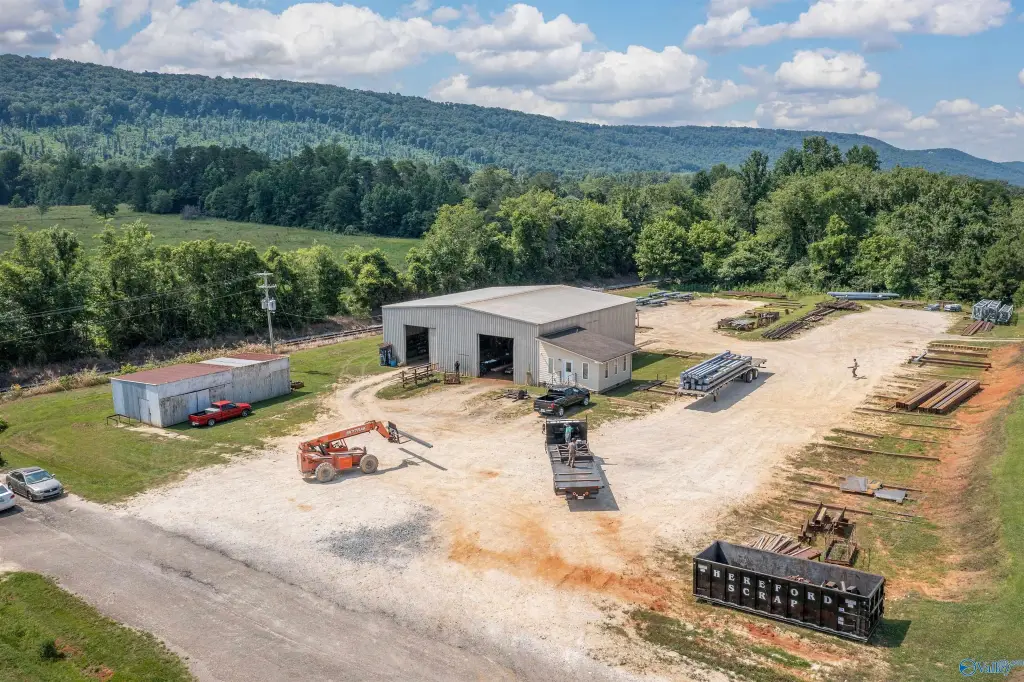
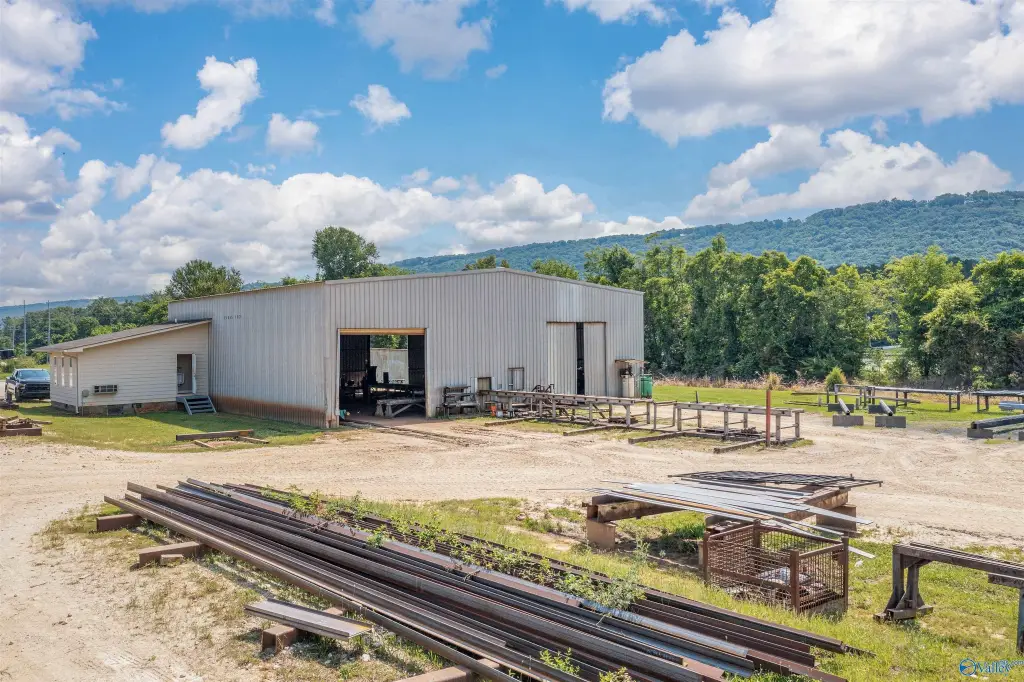
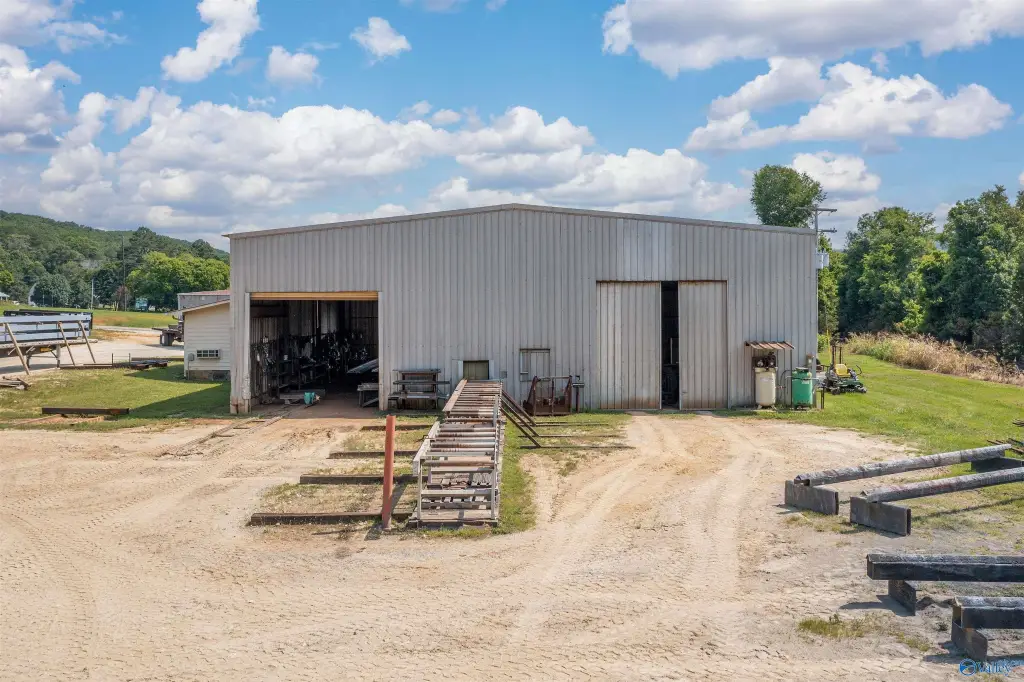
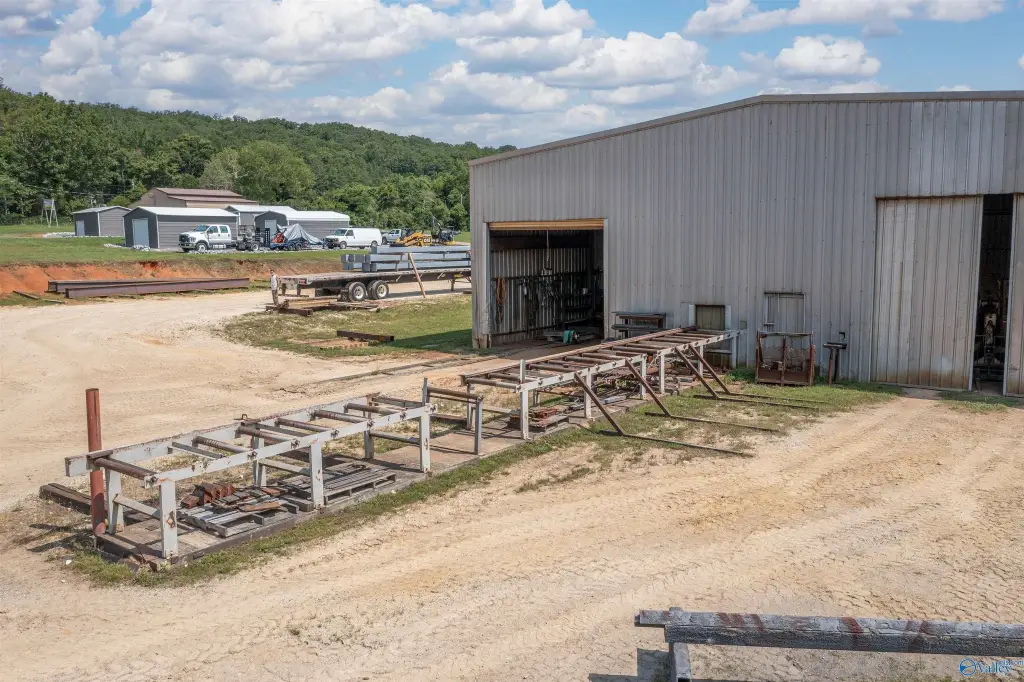
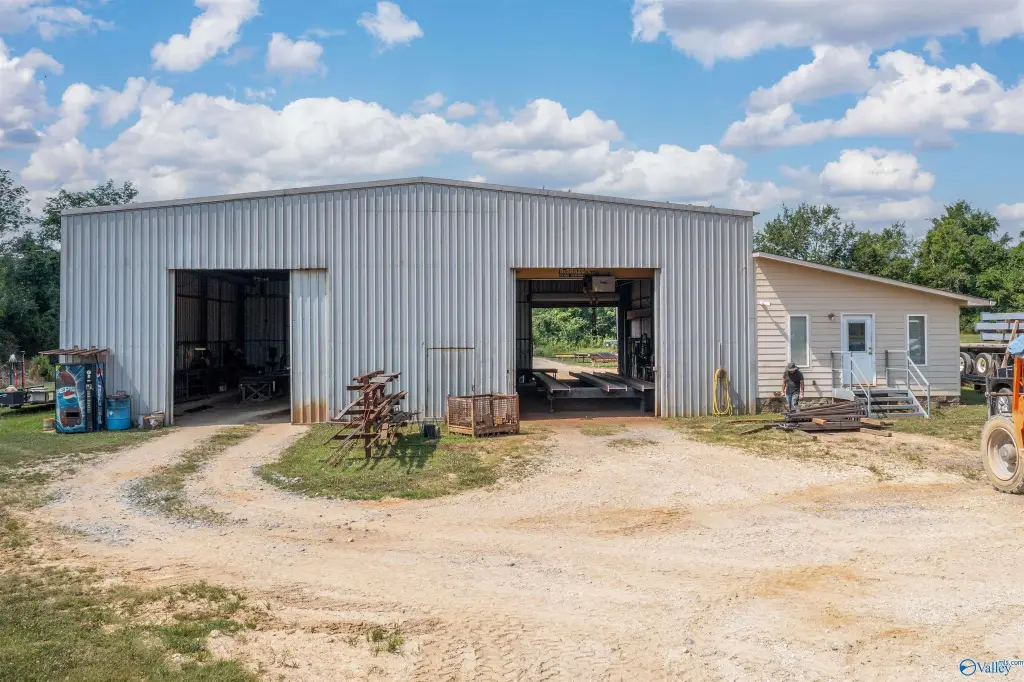
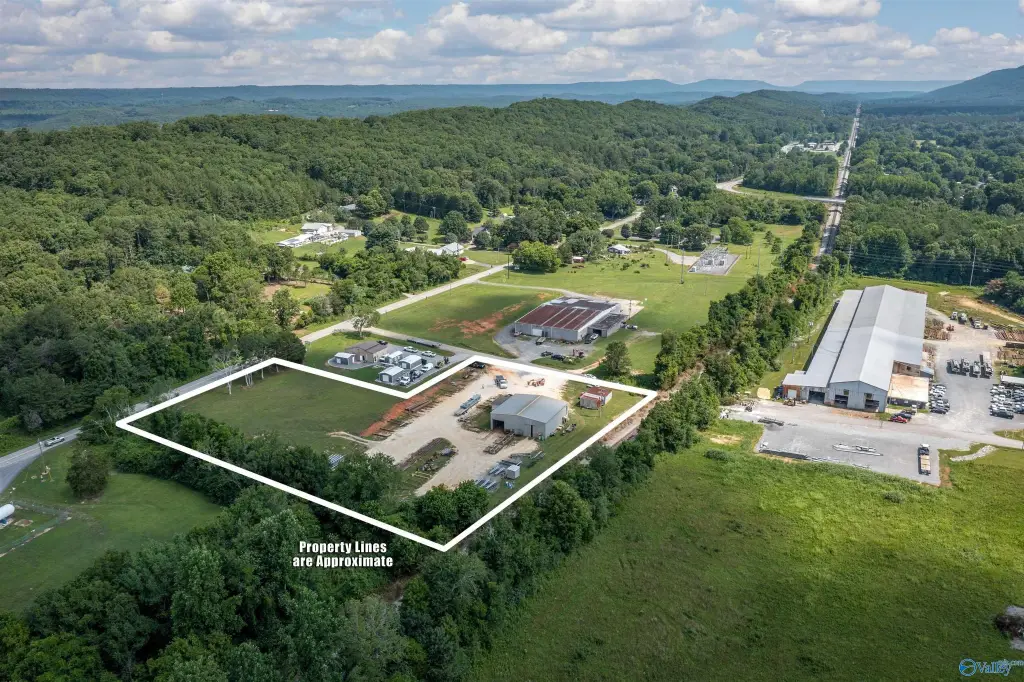
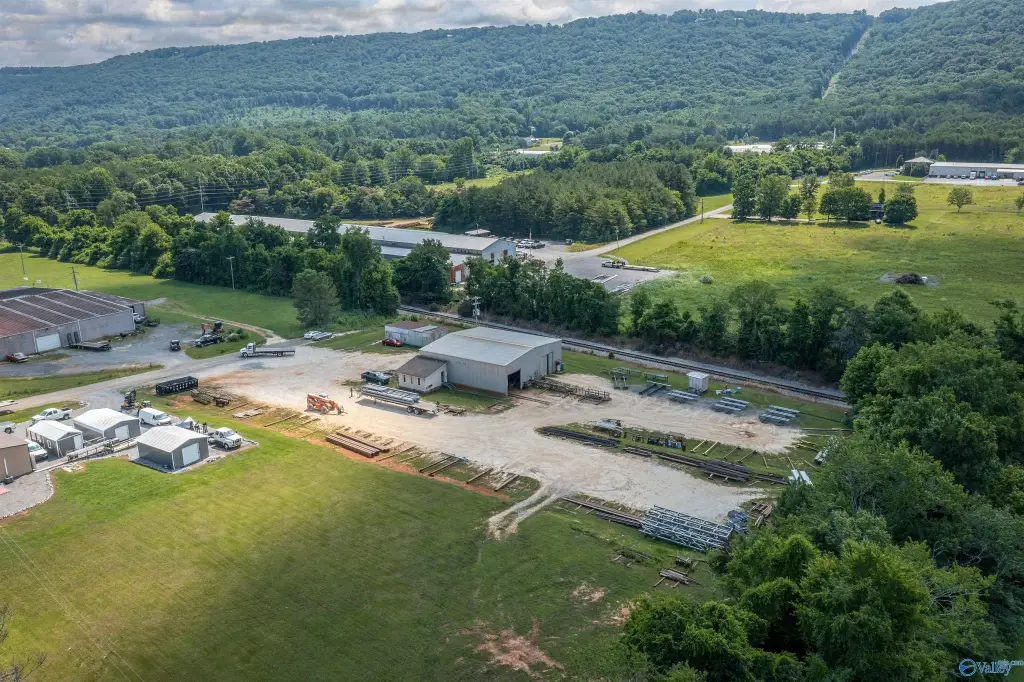
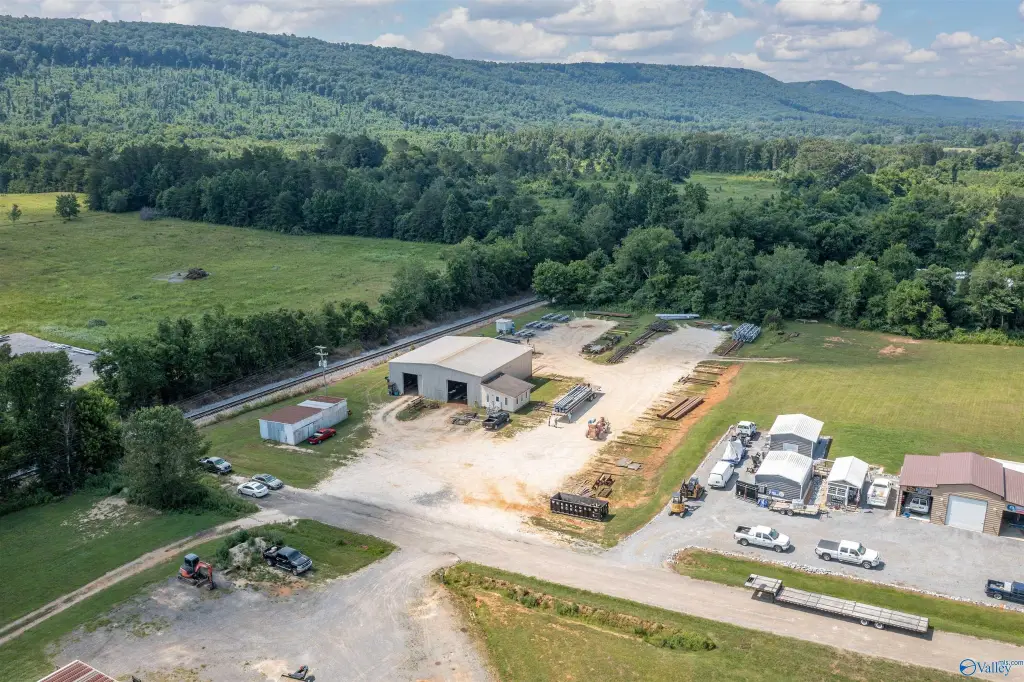
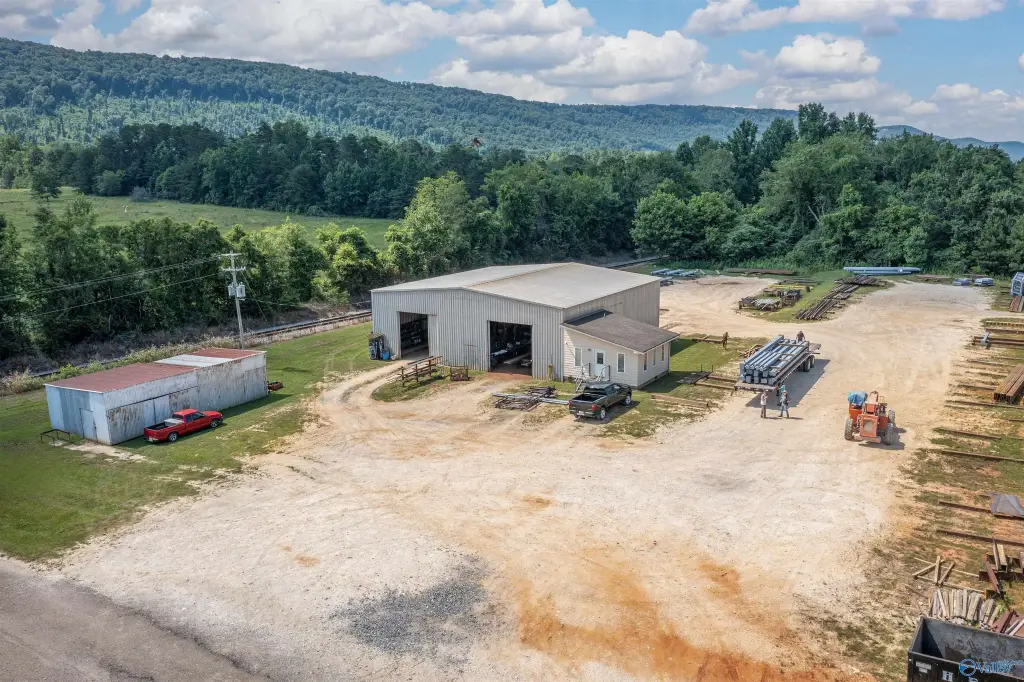
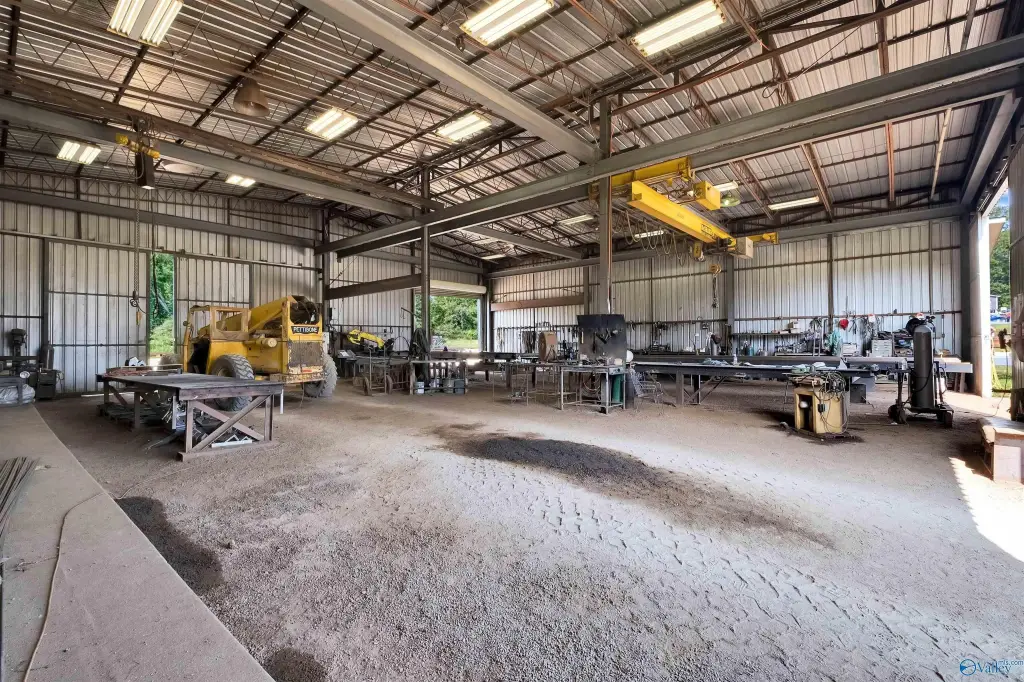
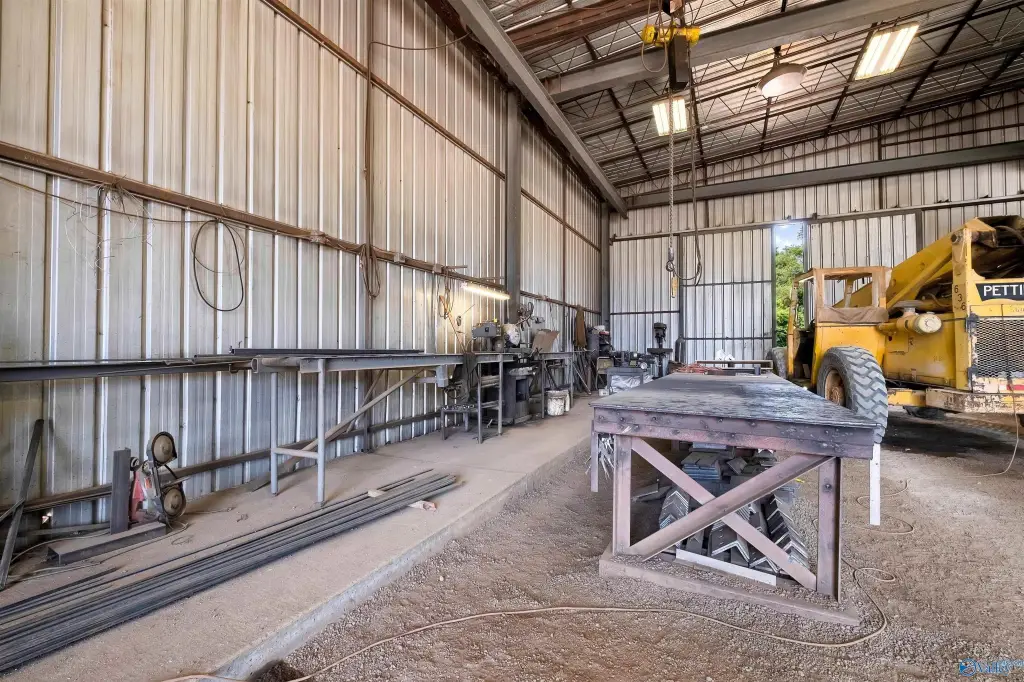
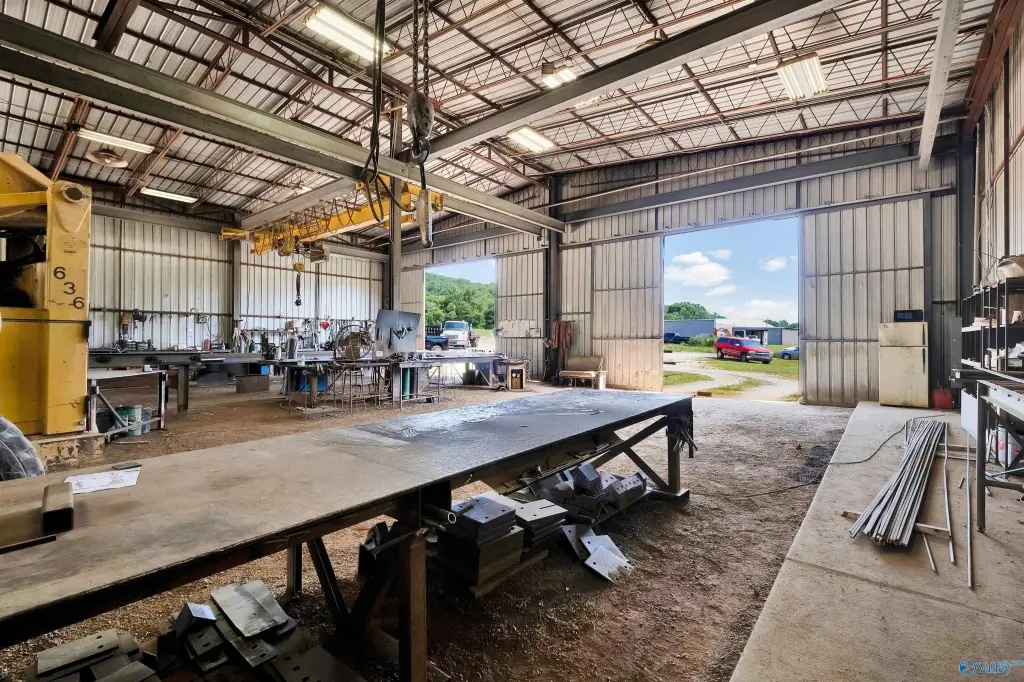
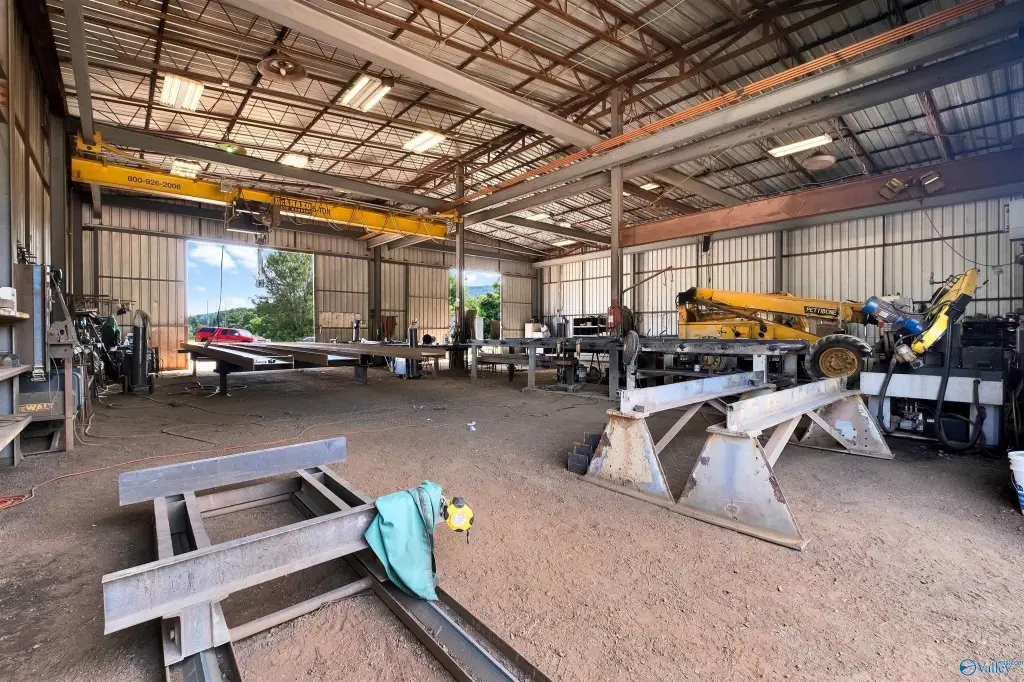
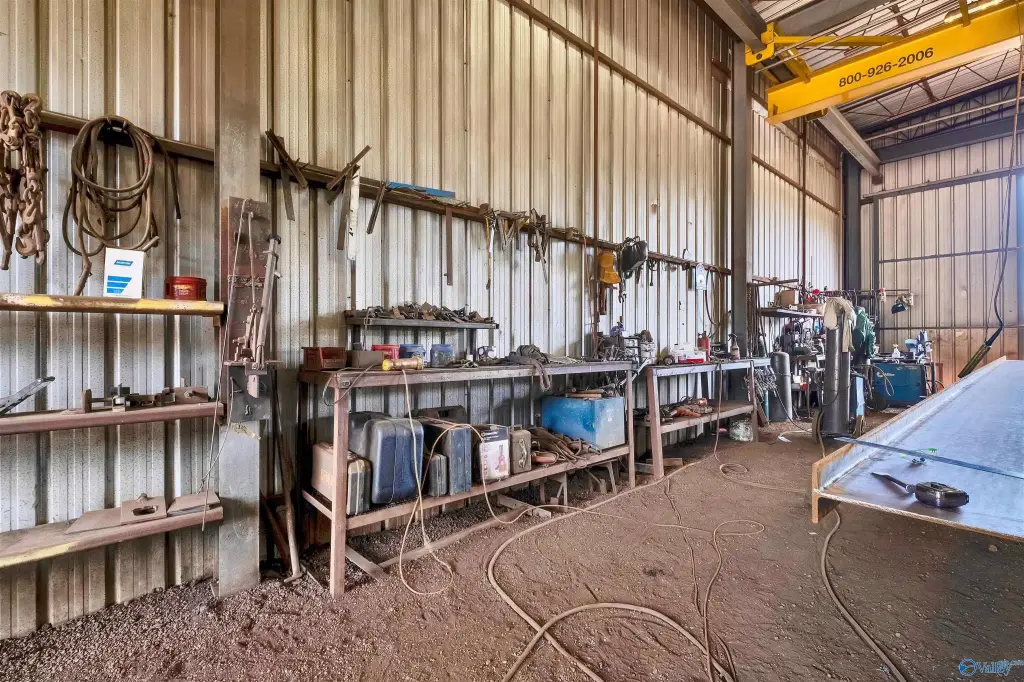
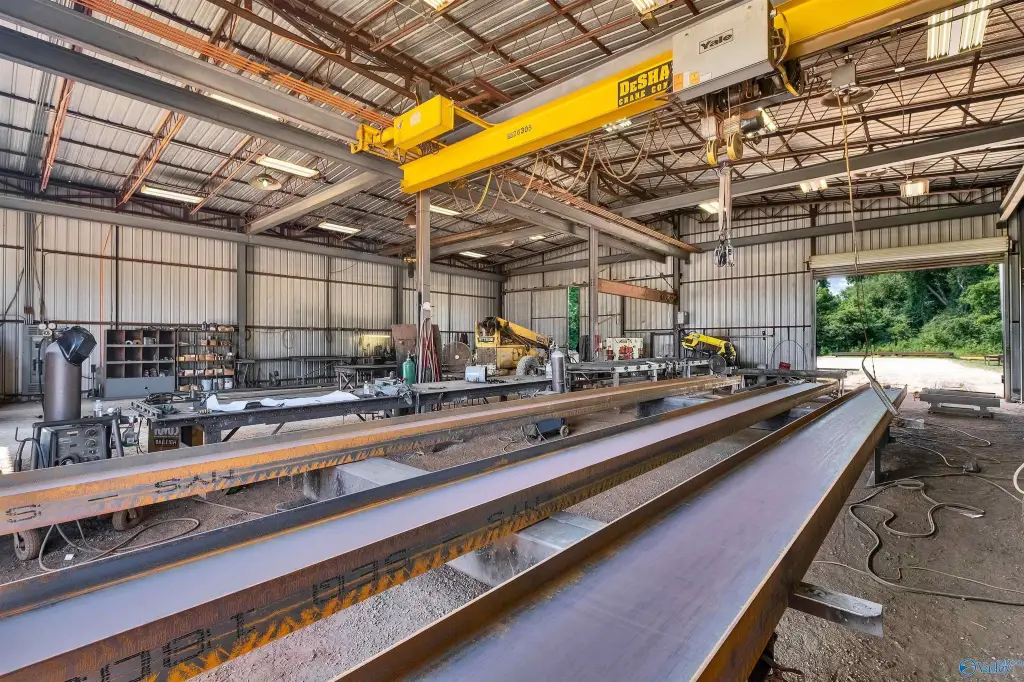
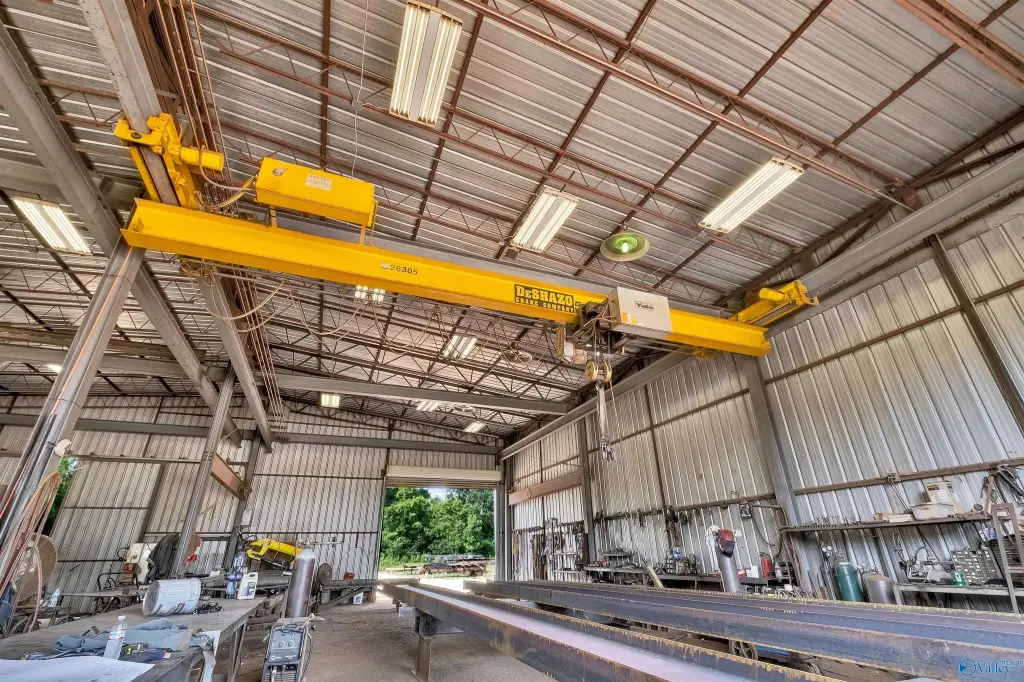
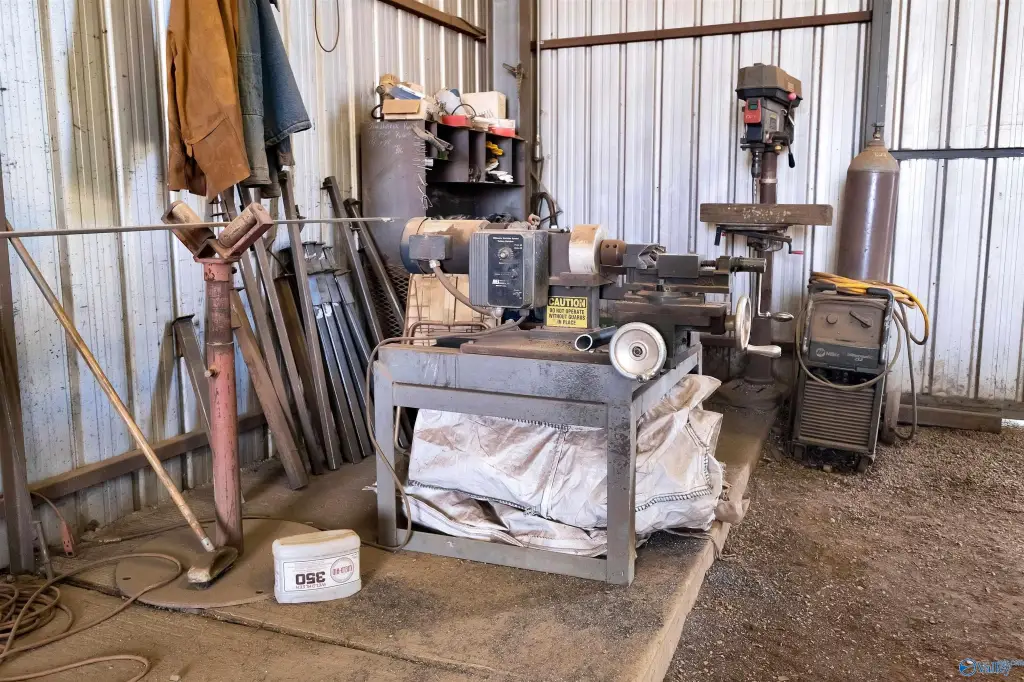
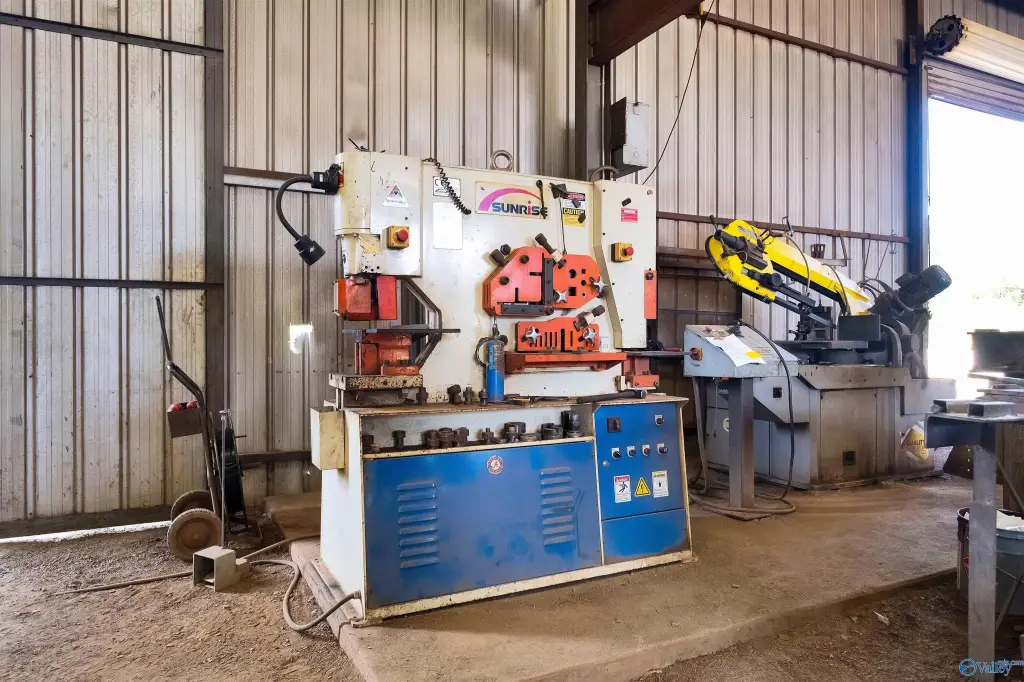
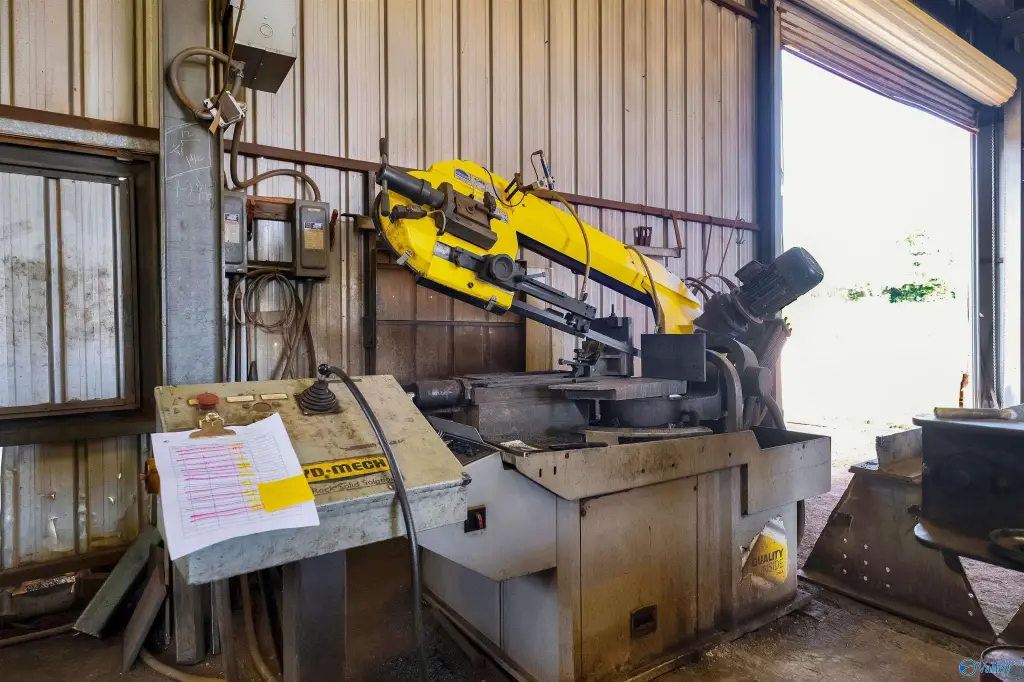
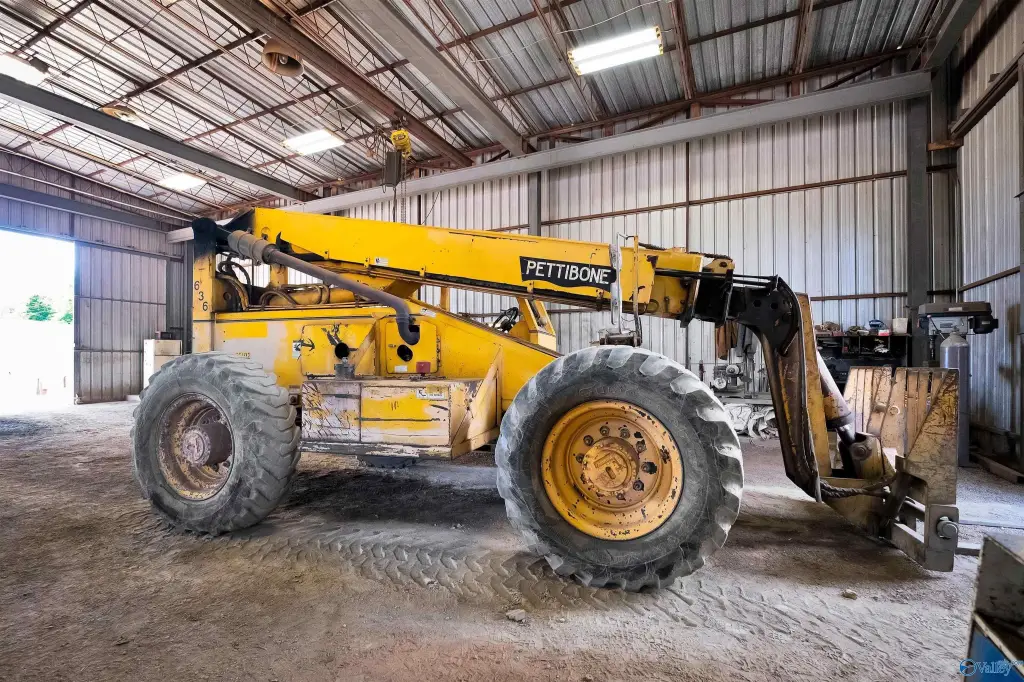
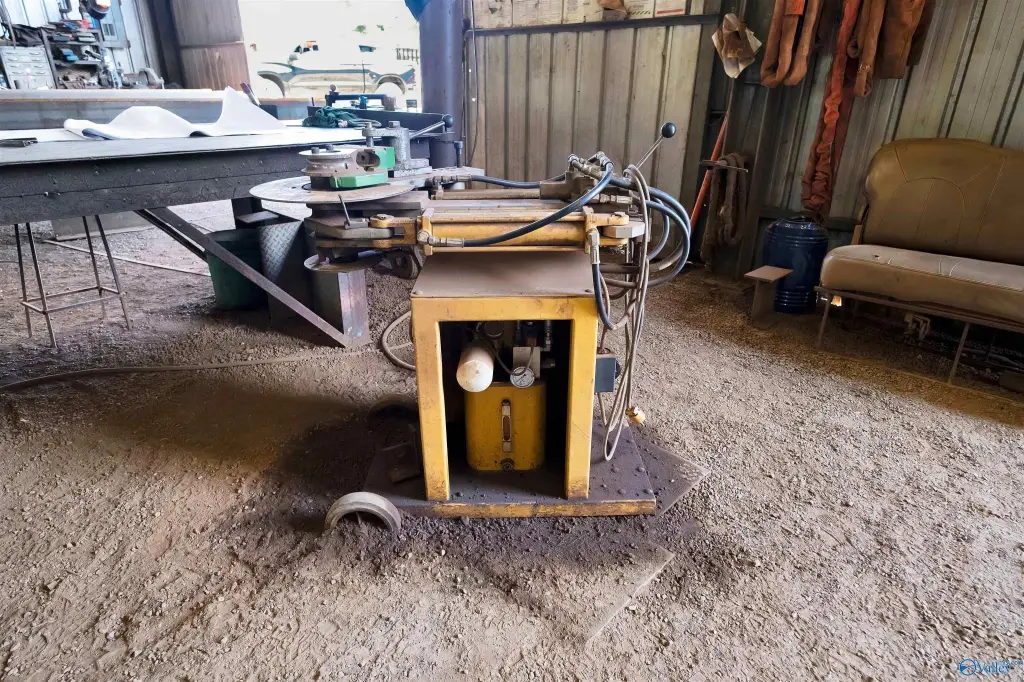
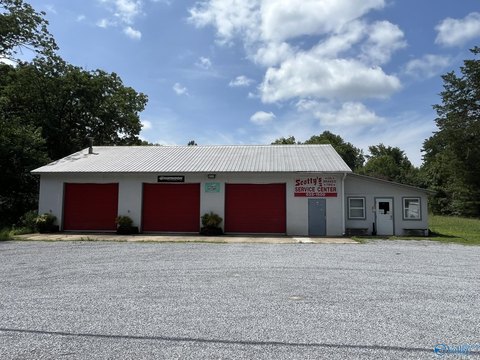
This industrial property includes a 4,000-square-foot building on 2.44 acres, constructed in 2002. The facility has two bathrooms, electric heat, wall-unit cooling, and a roof configuration combining metal and shingles. Public water and a septic tank serve the property.
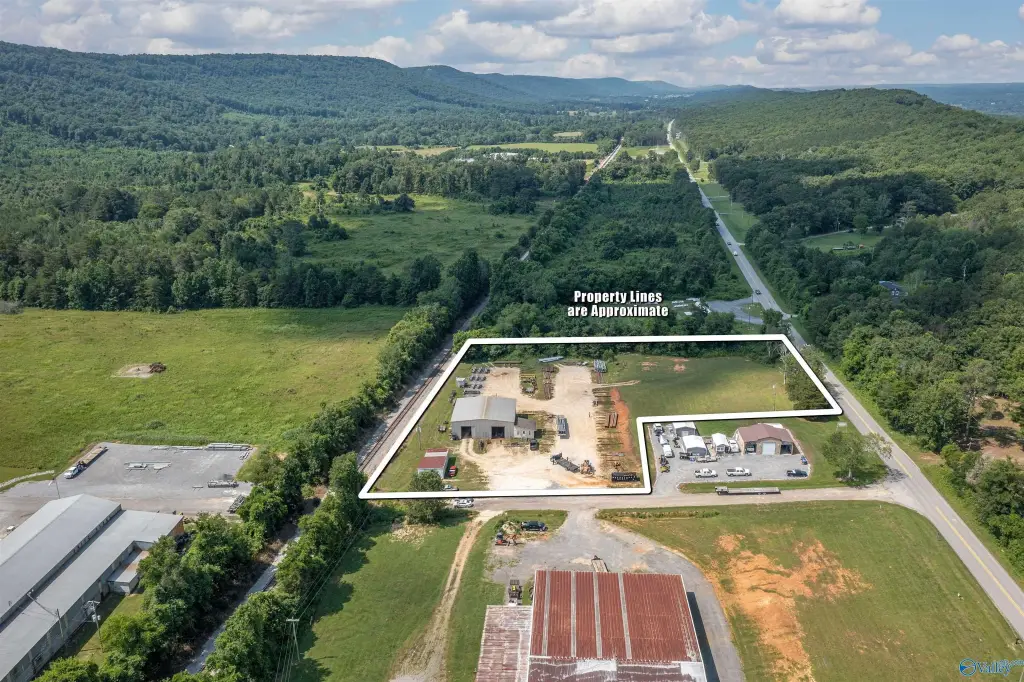
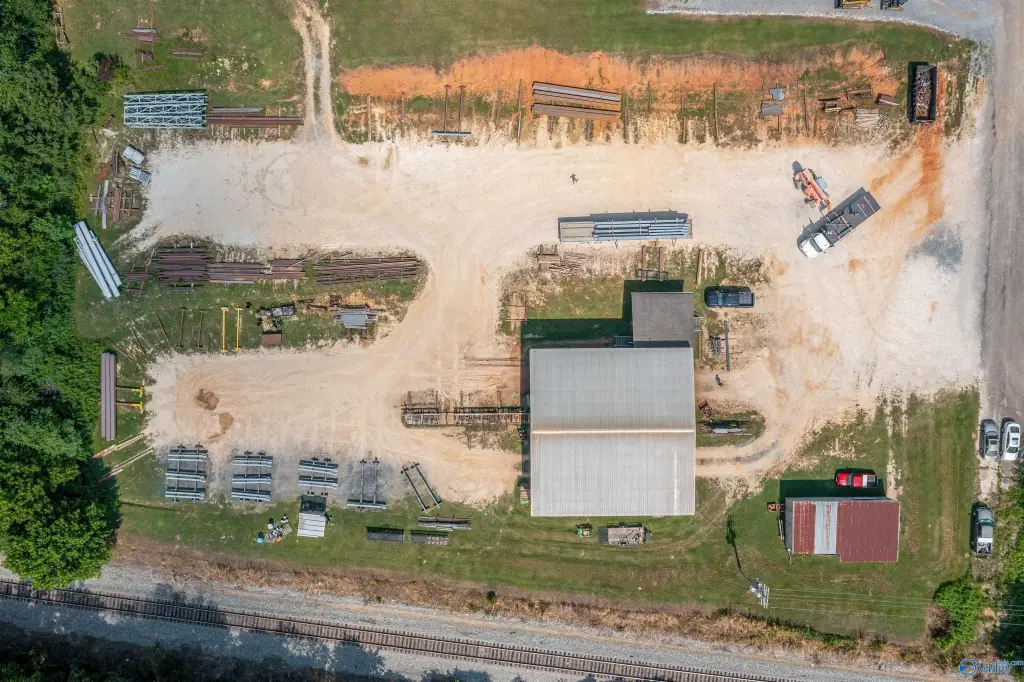
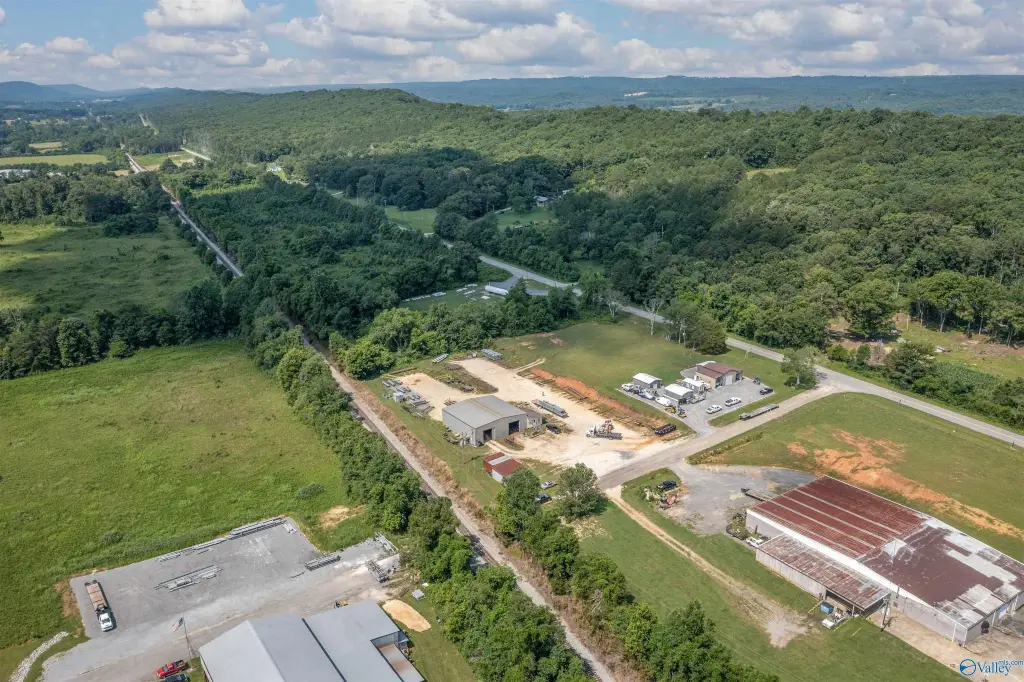
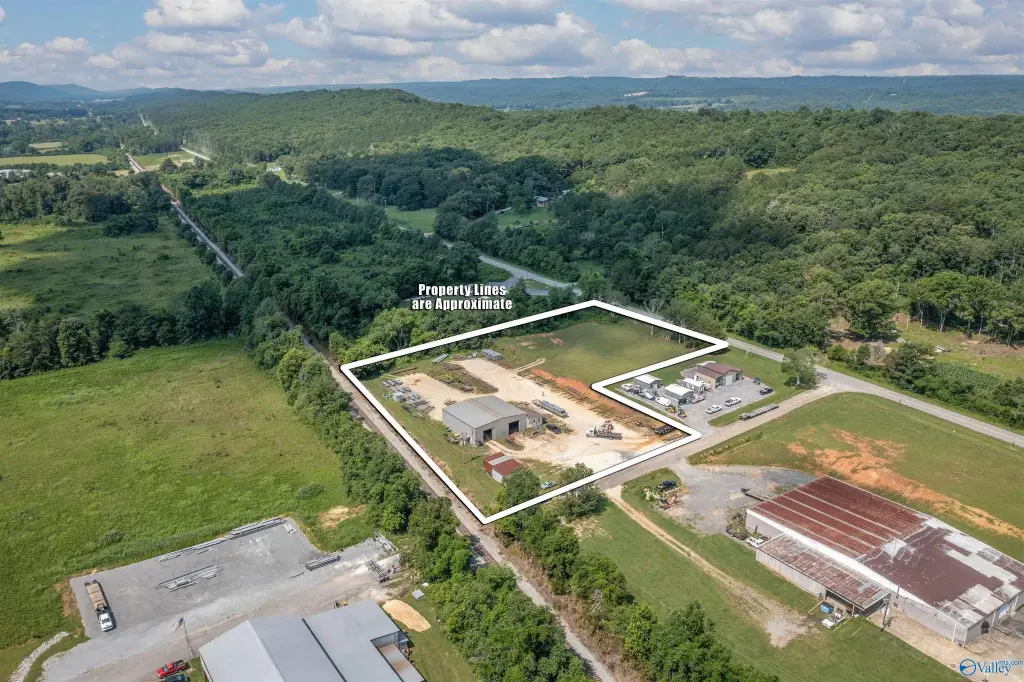
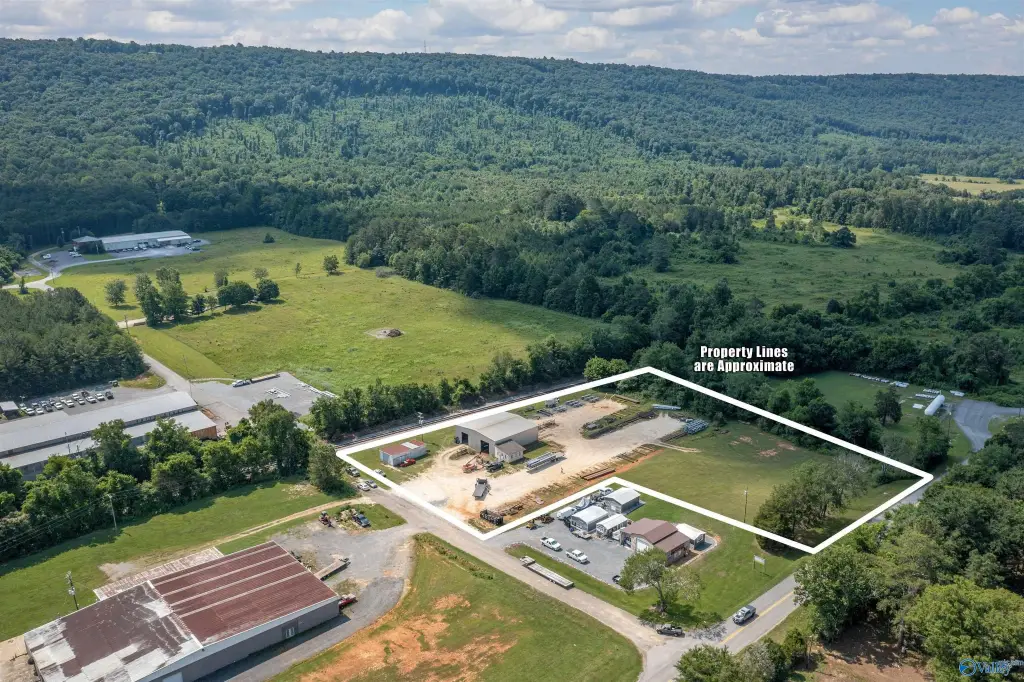
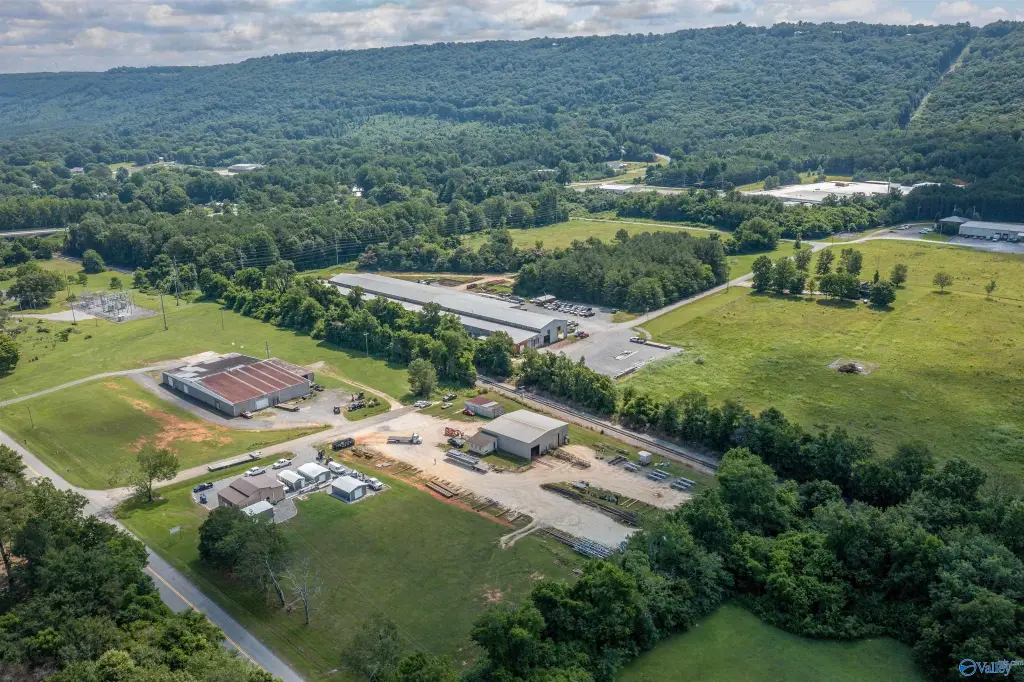
Frontage extends along County Road 137 and Jeff Cook Drive, with additional railroad frontage. The site is located minutes from Exit 231 on Interstate 59, providing access for industrial and warehouse operations. Inventory, machinery, equipment, and other business assets are available separately from the real estate.
Frontage extends along County Road 137 and Jeff Cook Drive, with additional railroad frontage. The site is located minutes from Exit 231 on Interstate 59, providing access for industrial and warehouse operations. Inventory, machinery, equipment, and other business assets are available separately from the real estate.
Key Highlights
- 4,000‑square‑foot industrial facility on 2.44 acres
- Frontage on County Road 137 and Jeff Cook Drive
- Railroad frontage supports industrial property access
Financial Insights
Estimated NOI and Cap Rate
NOI / Yr
$15,341
Cap Rate
3.84%
Suggested Prices Based on Cap Rates
Cap Rate 5%
$306,820
$306.8K
Cap Rate 7%
$219,157
$219.2K
Cap Rate 9%
$170,456
$170.5K
Market Conditions
NOI Build-Up for 4,000 SF
Gross rent
$19.2K $4.80/SF
− Vacancy
−$1.2K −$0.29/SF
EGI
$18.0K $4.51/SF
− OpEx
−$2.7K −$0.68/SF
NOI
$15.3K $3.84/SF
Area
DeKalb County, AL
Vacancy
6.00%
Lease Rate
$4.80 /SF/Yr
Expense Ratio
15.00%
Simulate Cap Rate and NOI
Suggested Prices Based on Cap Rates
Cap Rate 5%
$306,820
Cap Rate 7%
$219,157
Cap Rate 9%
$170,456
Alternative Uses
Best Use
Warehouse
$219.2K
$191.8K – $255.7K
NOI $15,341 @ 7.0% cap · market cap 3.84%
Second Best
Industrial
$190.5K
$166.7K – $222.3K
NOI $13,336 @ 7.0% cap · market cap 3.34%
Theoretical Best
Healthcare Medical
$644.4K
$563.9K – $751.8K
NOI $45,108 @ 7.0% cap · market cap 11.31%
Zoning and permitted uses should be independently verified with authorities.
How Realmo checks its estimates
Property Analytics
Unlock full access to Insights
Subscribe to Realmo Intelligence
Open Analytics
Current Use
Lease Details
Yes
Highway access
Yes
Paved road access
Location Intelligence
Trade Area within ½ mile
28
Businesses Nearby
Explore this area
Business Placement
Demographics for 35967, AL
17,233
Population
7,825
Households
2.2
Avg Household Size
37
Median Age
16%
College-Educated
81%
High-School Grad
127.0 sq mi
ZIP Area
136
Density / Sq Mi
$48,125
Median Household Income
$32,051
Median Earnings
$678
Median Rent
$155,700
Median Home Value
Check the figures for this property
Cap Rate, Value Estimation, Potential NOI and more
View Realmo Analytics
Market
Vacancy Rate% for Industrial in South region
Frequently Asked Questions
What type of property is this?
Manufacturing property - Industrial improvements with road and rail frontage support manufacturing, fabrication, and warehouse operations.
Where is this manufacturing property located?
The property is located at 64 Jeff Cook Drive Valley Head, AL.
What is the asking price?
The asking price for this property is $399,000.
What are key features of this property?
This property features: 4,000‑square‑foot industrial facility on 2.44 acres; Frontage on County Road 137 and Jeff Cook Drive; Railroad frontage supports industrial property access


