Hotel Interval Suite with
For Sale
$86,000
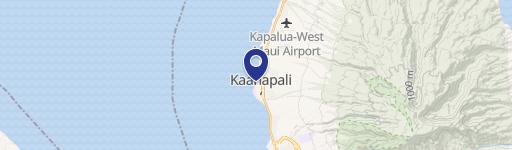
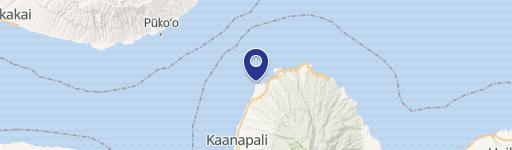
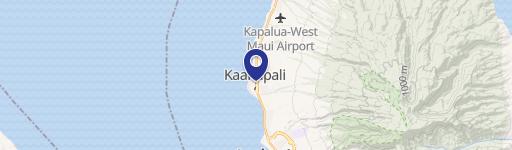
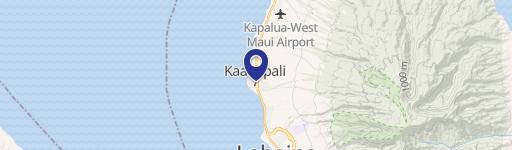
620f-2481 Kaanapali Pkwy, Lahaina, HI 96761
One-bedroom, one-bathroom ownership interval includes tile flooring, granite countertops, and access to resort amenities on Kaanapali Beach.
Property Size901 SF
Price / SF$95.45
Days on Market140
Property Features for 620f-2481 Kaanapali Pkwy
General Information
Standard status
Active
Size
901 SF
Property subtype
Residential Income
Zoning
hotel
Amenities
ocean view pool
fitness center
underground parking
tennis courts
business center
BBQ area
concierge
beach activity kiosk
courtyard with koi pond
Listing Agency:
Keller Williams Realty Maui-L
Listed By:
Katie Zimmerman RS-75832
(808) 280-8986
Source:
Exprealty
Added: May 19
Changed: Oct 2
Last Checked: Oct 4 at 2:45PM
Displayed information is deemed reliable but is not guaranteed and should be independently verified. All listing content including descriptions, pricing, images are the copyrighted material of Keller Williams Realty Maui-L
Investment Insights
Based on property information with market context.
This hotel-zoned interval suite at The Whaler provides occupancy from March 8 through March 22. Unit 620 is configured with one bedroom, one bathroom, and a lanai, with partial views toward the island of Molokai. Interior features include tile flooring, hardwood cabinetry, granite countertops, and stainless steel appliances.
Property amenities include an ocean-view pool, fitness facility, tennis courts, underground parking, business center, beachside BBQ areas, concierge service, and a beach activity kiosk. The landscaped courtyard includes a koi pond. The Whaler is located along Kaanapali Beach walk near Black Rock, shopping, dining, and championship golf courses. Annual maintenance fees cover property taxes, grounds and building maintenance, unit maintenance, the reserve fund, and housekeeping.
Property amenities include an ocean-view pool, fitness facility, tennis courts, underground parking, business center, beachside BBQ areas, concierge service, and a beach activity kiosk. The landscaped courtyard includes a koi pond. The Whaler is located along Kaanapali Beach walk near Black Rock, shopping, dining, and championship golf courses. Annual maintenance fees cover property taxes, grounds and building maintenance, unit maintenance, the reserve fund, and housekeeping.
Key Highlights
- March 8 to March 22 occupancy interval at The Whaler
- 1 bedroom, 1 bathroom suite with a private lanai
- Peek‑a‑boo views of the island of Molokai
Financial Insights
Estimated NOI and Cap Rate
NOI / Yr
$5,392
Cap Rate
6.27%
Suggested Prices Based on Cap Rates
Cap Rate 5%
$107,840
$107.8K
Cap Rate 7%
$77,029
$77.0K
Cap Rate 9%
$59,911
$59.9K
Market Conditions
NOI Build-Up for 901 SF
Gross rent
$18.9K $21.00/SF
− Vacancy
−$7.6K −$8.40/SF
EGI
$11.4K $12.60/SF
− OpEx
−$6.0K −$6.62/SF
NOI
$5.4K $5.98/SF
Area
Maui County, HI
Vacancy
40.00%
Lease Rate
$21.00 /SF/Yr
Expense Ratio
52.50%
Simulate Cap Rate and NOI
Suggested Prices Based on Cap Rates
Cap Rate 5%
$107,840
Cap Rate 7%
$77,029
Cap Rate 9%
$59,911
Alternative Uses
Best Use
Apartment 5plus
$242.1K
$211.9K – $282.5K
NOI $16,948 @ 7.0% cap · market cap 19.71%
Second Best
Hotel Hospitality
$77.0K
$67.4K – $89.9K
NOI $5,392 @ 7.0% cap · market cap 6.27%
Theoretical Best
Specialty Retail
$364.5K
$318.9K – $425.2K
NOI $25,514 @ 7.0% cap · market cap 29.67%
Zoning and permitted uses should be independently verified with authorities.
Property Analytics
Current Use
Location Intelligence
Demographics for 96761, HI
23,167
Population
11,851
Households
2
Avg Household Size
42
Median Age
28%
College-Educated
93%
High-School Grad
95.3 sq mi
ZIP Area
243
Density / Sq Mi
$94,229
Median Household Income
$45,107
Median Earnings
$2,099
Median Rent
$905,800
Median Home Value
Market
Vacancy Rate% for Multifamily in West region

Questions? Ask Rey
Realmo’s AI knows this listing — price, zoning, demand, history. Ask anything.





Frequently Asked Questions
What type of property is this?
Hotel - One-bedroom, one-bathroom ownership interval includes tile flooring, granite countertops, and access to resort amenities on Kaanapali Beach.
Where is this hotel located?
The property is located at 620f-2481 Kaanapali Pkwy Lahaina, HI.
What is the asking price?
The asking price for this property is $86,000.
What are key features of this property?
This property features: March 8 to March 22 occupancy interval at The Whaler; 1 bedroom, 1 bathroom suite with a private lanai; Peek‑a‑boo views of the island of Molokai


