Three-Bedroom Resort
For Sale
$359,000
3606-1 Bay Dr, Lahaina, HI 96761
Deeded fractional ownership provides three consecutive weeks annually, with access to additional days on a per diem basis.
Property Size2,065 SF
Price / SF$173.85
Days on Market404
Property Features for 3606-1 Bay Dr
General Information
Standard status
Active
Size
2,065 SF
Property subtype
Residential Income
Amenities
Montage staff
daily housekeeping
assigned concierge
in-residence dining
signature restaurant
kids programs
lagoon pools
Listing Agency:
Coldwell Banker Island Prop-KP
Listed By:
Chris Haigh RS-67890
(808) 283-5166
Source:
Exprealty
Added: Aug 28, 2025
Changed: Sep 11
Last Checked: Oct 4 at 5:38PM
Displayed information is deemed reliable but is not guaranteed and should be independently verified. All listing content including descriptions, pricing, images are the copyrighted material of Coldwell Banker Island Prop-KP
Investment Insights
Based on property information with market context.
This three-bedroom, three-and-a-half-bath premier penthouse residence at The Resort at Kapalua Bay is offered as a deeded one-twelfth fractional ownership interest. The annual allotment includes 21 consecutive deeded days, scheduled as three consecutive weeks from late June through early July, with additional access available on a per diem basis. The residence offers views toward the ocean and Molokai.
On-property services and amenities include daily housekeeping, an assigned concierge, in-residence dining, a signature restaurant, children’s programs, and lagoon pools. The deeded period currently includes June 20 through July 11 in 2026, June 19 through July 10 in 2027, and June 17 through July 8 in 2028. The residence is identified as 3606-1 Bay Dr, Lahaina, HI.
On-property services and amenities include daily housekeeping, an assigned concierge, in-residence dining, a signature restaurant, children’s programs, and lagoon pools. The deeded period currently includes June 20 through July 11 in 2026, June 19 through July 10 in 2027, and June 17 through July 8 in 2028. The residence is identified as 3606-1 Bay Dr, Lahaina, HI.
Key Highlights
- Deeded one‑twelfth fractional ownership interest
- 21 consecutive deeded days each year
- Three‑bedroom, three‑and‑a‑half‑bath premier penthouse residence
Financial Insights
Estimated NOI and Cap Rate
NOI / Yr
$12,359
Cap Rate
3.44%
Suggested Prices Based on Cap Rates
Cap Rate 5%
$247,180
$247.2K
Cap Rate 7%
$176,557
$176.6K
Cap Rate 9%
$137,322
$137.3K
Market Conditions
NOI Build-Up for 2,065 SF
Gross rent
$43.4K $21.00/SF
− Vacancy
−$17.3K −$8.40/SF
EGI
$26.0K $12.60/SF
− OpEx
−$13.7K −$6.62/SF
NOI
$12.4K $5.98/SF
Area
Maui County, HI
Vacancy
40.00%
Lease Rate
$21.00 /SF/Yr
Expense Ratio
52.50%
Simulate Cap Rate and NOI
Suggested Prices Based on Cap Rates
Cap Rate 5%
$247,180
Cap Rate 7%
$176,557
Cap Rate 9%
$137,322
Alternative Uses
Best Use
Hotel Hospitality
$176.6K
$154.5K – $206.0K
NOI $12,359 @ 7.0% cap · market cap 3.44%
Second Best
—
—
no second resolved use
Theoretical Best
Specialty Retail
$835.4K
$730.9K – $974.6K
NOI $58,475 @ 7.0% cap · market cap 16.29%
Zoning and permitted uses should be independently verified with authorities.
Property Analytics
Current Use
Location Intelligence
Demographics for 96761, HI
23,167
Population
11,851
Households
2
Avg Household Size
42
Median Age
28%
College-Educated
93%
High-School Grad
95.3 sq mi
ZIP Area
243
Density / Sq Mi
$94,229
Median Household Income
$45,107
Median Earnings
$2,099
Median Rent
$905,800
Median Home Value

Questions? Ask Rey
Realmo’s AI knows this listing — price, zoning, demand, history. Ask anything.
Frequently Asked Questions
What type of property is this?
Resort - Deeded fractional ownership provides three consecutive weeks annually, with access to additional days on a per diem basis.
Where is this resort located?
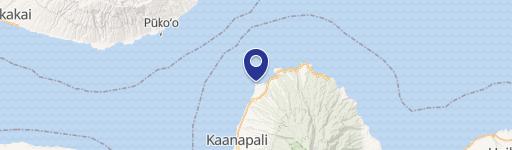
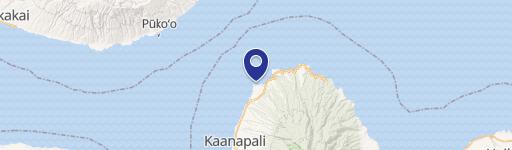
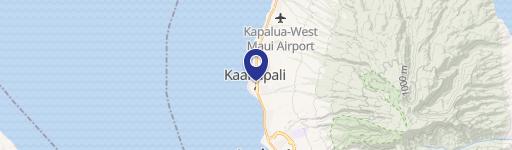
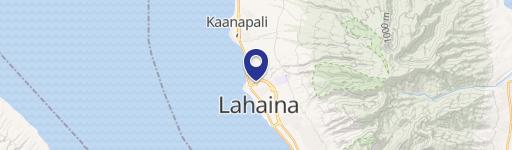
The property is located at 3606-1 Bay Dr Lahaina, HI.
What is the asking price?
The asking price for this property is $359,000.
What are key features of this property?
This property features: Deeded one‑twelfth fractional ownership interest; 21 consecutive deeded days each year; Three‑bedroom, three‑and‑a‑half‑bath premier penthouse residence


