Multi-Building Retail Office
For Sale
$2,500,000
6103 S Coulter Street, Amarillo, TX 79119
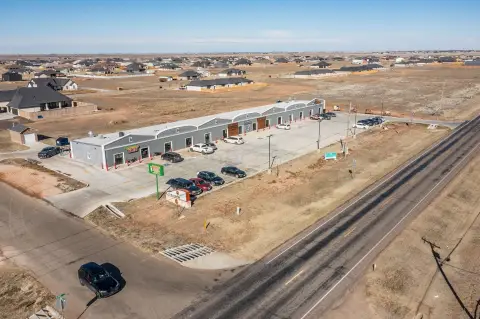
Two 2015 buildings with individually metered utilities and multiple flexible commercial spaces along high-traffic access.
Property Size10,402 SF
Price / SF$240.34
Days on Market93
Property Features for 6103 S Coulter Street
General Information
Standard status
Active
Size
10,402 SF
Property subtype
Commercial
Additional Details
Traffic Count
13,000 vehicles/day
Office Units
8
Building Details
Year Built
2015
Tenancy
Multi
Listing Agency:
Keller Williams Realty Amarillo
Listed By:
Bobby Tyler · License #690582
(806) 676-7709
Source:
Shopamarillohomes
Added: Jul 7
Changed: Aug 28
Last Checked: Aug 14 at 7:30AM
Displayed information is deemed reliable but is not guaranteed and should be independently verified. All listing content including descriptions, pricing, images are the copyrighted material of Keller Williams Realty Amarillo
Investment Insights
Based on property information with market context.
Built in 2015, this two-building commercial property includes eight total spaces, with four units in each building. The layout is designed to support a range of retail, office, or service uses, and each unit is separately metered for water and electricity, helping streamline tenant convenience and expense management.
Located at 6103 S Coulter Street in Amarillo, Texas, the property is positioned for strong visibility and convenient access. Public remarks indicate traffic counts exceeding 13,000 vehicles per day, supporting exposure for businesses seeking consistent passersby.
The unit configuration and separately metered utilities make this an appealing fit for tenants that want independent cost control rather than shared utility arrangements. For buyers, the multi-space setup offers flexibility when considering a portfolio approach, while still maintaining a straightforward, individually managed unit model across the two buildings.
Located at 6103 S Coulter Street in Amarillo, Texas, the property is positioned for strong visibility and convenient access. Public remarks indicate traffic counts exceeding 13,000 vehicles per day, supporting exposure for businesses seeking consistent passersby.
The unit configuration and separately metered utilities make this an appealing fit for tenants that want independent cost control rather than shared utility arrangements. For buyers, the multi-space setup offers flexibility when considering a portfolio approach, while still maintaining a straightforward, individually managed unit model across the two buildings.
Key Highlights
- Built in 2015: two commercial buildings with a total of 8 commercial spaces (4 units per building).
- Each space has individually metered water and electricity for simplified tenant and expense management.
- Commercial spaces are designed for flexibility, suitable for retail, office, or service‑based businesses.
Financial Insights
Estimated NOI and Cap Rate
NOI / Yr
$100,483
Cap Rate
4.02%
Suggested Prices Based on Cap Rates
Cap Rate 5%
$2,009,660
$2.0M
Cap Rate 7%
$1,435,471
$1.4M
Cap Rate 9%
$1,116,478
$1.1M
Market Conditions
NOI Build-Up for 10,402 SF
Gross rent
$156.0K $15.00/SF
− Vacancy
−$12.5K −$1.20/SF
EGI
$143.5K $13.80/SF
− OpEx
−$43.1K −$4.14/SF
NOI
$100.5K $9.66/SF
Area
Amarillo, TX
Vacancy
8.00%
Lease Rate
$15.00 /SF/Yr
Expense Ratio
30.00%
Simulate Cap Rate and NOI
Suggested Prices Based on Cap Rates
Cap Rate 5%
$2,009,660
Cap Rate 7%
$1,435,471
Cap Rate 9%
$1,116,478
Alternative Uses
Best Use
Retail
$1.44M
$1.26M – $1.67M
NOI $100,483 @ 7.0% cap · market cap 4.02%
Second Best
—
—
no second resolved use
Theoretical Best
Office A
$2.32M
$2.03M – $2.71M
NOI $162,571 @ 7.0% cap · market cap 6.50%
Zoning and permitted uses should be independently verified with authorities.
Property Analytics
Unlock full access to Insights
Subscribe to Realmo Intelligence
Open Analytics
Current Use
Lease Details
8
Office units
13,000 VPD
Traffic count
Multi-tenant
Tenancy
Location Intelligence
Trade Area within ½ mile
291
Businesses Nearby
Explore this area
Business Placement
Demographics for 79119, TX
21,147
Population
9,839
Households
2.1
Avg Household Size
37
Median Age
44%
College-Educated
97%
High-School Grad
99.5 sq mi
ZIP Area
213
Density / Sq Mi
$100,546
Median Household Income
$63,728
Median Earnings
$1,217
Median Rent
$335,700
Median Home Value
Check the figures for this property
Cap Rate, Value Estimation, Potential NOI and more
View Realmo Analytics
Market
Vacancy Rate% for Retail in South region

Questions? Ask Rey
Realmo’s AI knows this listing — price, zoning, demand, history. Ask anything.




Frequently Asked Questions
What type of property is this?
Strip mall - Two 2015 buildings with individually metered utilities and multiple flexible commercial spaces along high-traffic access.
Where is this strip mall located?
The property is located at 6103 S Coulter Street Amarillo, TX.
What is the asking price?
The asking price for this property is $2,500,000.
What are key features of this property?
This property features: Built in 2015: two commercial buildings with a total of 8 commercial spaces (4 units per building).; Each space has individually metered water and electricity for simplified tenant and expense management.; Commercial spaces are designed for flexibility, suitable for retail, office, or service‑based businesses.



