Freestanding Office Building with
For Sale
Contact for pricing
590 Washington Road, Washington, PA 15301
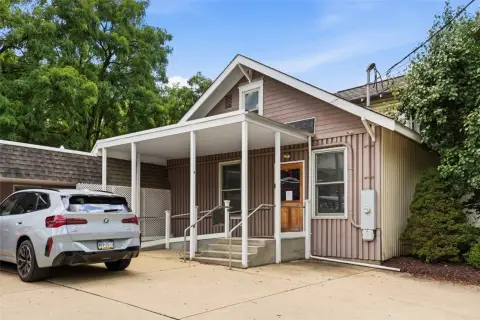
Freestanding office building with upper design flexibility, existing bank-era features, and paved parking off Munce Road.
Property Size5,208 SF
Lot Size2.00 Acres
Price / SF$115.19
Days on Market113
Property Features for 590 Washington Road
General Information
Standard status
Active
Size
5,208 SF
Total Parking Spaces
25
Lot size
2.00 Acres
Property subtype
Retail, Office, Industrial, Special Purpose
Zoning
C-2
Additional Details
Road Access
Yes
Building Details
Year Built
1970
Tenancy
Multi
Listing Agency:
EXP REALTY LLC
Listed By:
Jeffrey Selvoski · License #RS320797
Source:
Crexi
Added: Jun 20
Changed: Oct 5
Last Checked: Oct 9 at 8:40PM
Displayed information is deemed reliable but is not guaranteed and should be independently verified. All listing content including descriptions, pricing, images are the copyrighted material of EXP REALTY LLC
Investment Insights
Based on property information with market context.
590 Washington Road is a freestanding office property with a contemporary exterior and a flexible interior layout that supports single or multi-occupant use. The building is described as having an upper and lower configuration, and the lower level still shows bank-era elements including existing vaults, teller desks, and office space, along with a drive-through window.
The property is located in the general commercial district of South Strabane (C-2). It sits on approximately 2.0 acres with about 507 feet of Rte. 19 frontage, and access is provided off Munce Road into upper and lower paved parking lots that accommodate 25+ cars.
For tenants or buyers seeking office space in a commercial setting, the existing lower-level improvements and drive-through feature may support a range of service and administrative uses. The upper floor is noted as ready for design, with a full front wall of windows intended to be a prominent architectural feature for an office buildout.
The property is located in the general commercial district of South Strabane (C-2). It sits on approximately 2.0 acres with about 507 feet of Rte. 19 frontage, and access is provided off Munce Road into upper and lower paved parking lots that accommodate 25+ cars.
For tenants or buyers seeking office space in a commercial setting, the existing lower-level improvements and drive-through feature may support a range of service and administrative uses. The upper floor is noted as ready for design, with a full front wall of windows intended to be a prominent architectural feature for an office buildout.
Key Highlights
- 5,208 SF freestanding office property built in 1970 in the C‑2 general commercial district (South Strabane)
- 2.0‑acre site with 507 ft of Rte 19 frontage and access off Munce Rd
- Upper and lower parking lots with paved parking for 25+ cars
Financial Insights
Estimated NOI and Cap Rate
NOI / Yr
$52,497
Cap Rate
8.75%
Suggested Prices Based on Cap Rates
Cap Rate 5%
$1,049,940
$1.0M
Cap Rate 7%
$749,957
$750.0K
Cap Rate 9%
$583,300
$583.3K
Market Conditions
NOI Build-Up for 5,208 SF
Gross rent
$78.1K $15.00/SF
− Vacancy
−$3.1K −$0.60/SF
EGI
$75.0K $14.40/SF
− OpEx
−$22.5K −$4.32/SF
NOI
$52.5K $10.08/SF
Area
Washington County, PA
Vacancy
4.00%
Lease Rate
$15.00 /SF/Yr
Expense Ratio
30.00%
Simulate Cap Rate and NOI
Suggested Prices Based on Cap Rates
Cap Rate 5%
$1,049,940
Cap Rate 7%
$749,957
Cap Rate 9%
$583,300
Alternative Uses
Best Use
Specialty Retail
$1.60M
$1.40M – $1.87M
NOI $112,333 @ 7.0% cap · market cap 18.73%
Second Best
Office B
$950.4K
$831.6K – $1.11M
NOI $66,530 @ 7.0% cap · market cap 11.09%
Theoretical Best
—
—
same as Best Use
Zoning and permitted uses should be independently verified with authorities.
Property Analytics
Unlock full access to Insights
Subscribe to Realmo Intelligence
Open Analytics
Current Use
Lease Details
Yes
Paved road access
Location Intelligence
Trade Area within ½ mile
352
Businesses Nearby
Explore this area
Business Placement
Demographics for 15301, PA
48,963
Population
24,001
Households
2
Avg Household Size
45
Median Age
27%
College-Educated
92%
High-School Grad
122.0 sq mi
ZIP Area
401
Density / Sq Mi
$69,275
Median Household Income
$43,546
Median Earnings
$927
Median Rent
$205,800
Median Home Value
Check the figures for this property
Cap Rate, Value Estimation, Potential NOI and more
View Realmo Analytics
Market
Vacancy Rate% for Office in Northeast region

Questions? Ask Rey
Realmo’s AI knows this listing — price, zoning, demand, history. Ask anything.




Frequently Asked Questions
What type of property is this?
Office building - Freestanding office building with upper design flexibility, existing bank-era features, and paved parking off Munce Road.
Where is this office building located?
The property is located at 590 Washington Road Washington, PA.
What is the asking price?
The asking price for this property is $599,900.
What are key features of this property?
This property features: 5,208 SF freestanding office property built in 1970 in the C‑2 general commercial district (South Strabane); 2.0‑acre site with 507 ft of Rte 19 frontage and access off Munce Rd; Upper and lower parking lots with paved parking for 25+ cars


