New Construction Residential Income
For Sale
$819,900
57 Bellflower Road, Billerica, MA 01821
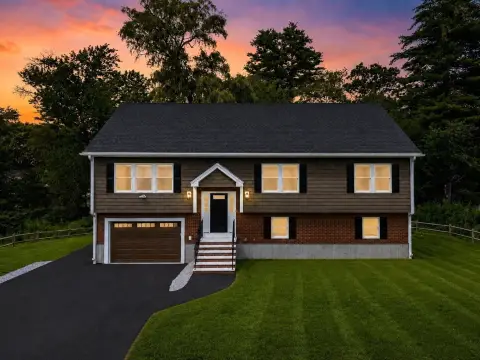
Four-bedroom condominium with flexible upper-level space, hardwood floors, and a quartz-appointed open kitchen.
Property Size2,600 SF
Price / SF$315.35
Days on Market51
Property Features for 57 Bellflower Road
General Information
Standard status
Active
Size
2,600 SF
Property subtype
Apartment
Additional Details
Multifamily Units
1
Amenities
Range
Dishwasher
Microwave
Refrigerator
Central Air
Tile
Hardwood
Vinyl
Forced Air, Natural Gas
4.0 Stories
$0 Taxes
Public
Built in 2026
Building Details
Year Built
2026
Listing Agency:
RE/MAX Triumph Realty
(978) 262-9665
Listed By:
Bryan Duby · License #70157
(978) 987-4979
Source:
Donahuere
Added: Aug 26
Changed: Oct 14
Last Checked: Oct 14 at 7:41PM
Displayed information is deemed reliable but is not guaranteed and should be independently verified. All listing content including descriptions, pricing, images are the copyrighted material of RE/MAX Triumph Realty
Investment Insights
Based on property information with market context.
Completed in 2026, this new-construction condominium at 57 Bellflower Road in Billerica provides over 2600 SF of finished living space with four bedrooms and 2.5 baths. Hardwood flooring extends throughout the home, while the open kitchen combines quartz countertops, an island, stainless steel appliances, and an eat-in area positioned near a rear slider.
The second floor includes three bedrooms, including a primary suite with a walk-in closet and full bathroom. A bonus entertainment room and additional bedroom occupy the top level, creating adaptable space for office, guest, or recreational use. The property is classified as a residential income property.
The second floor includes three bedrooms, including a primary suite with a walk-in closet and full bathroom. A bonus entertainment room and additional bedroom occupy the top level, creating adaptable space for office, guest, or recreational use. The property is classified as a residential income property.
Key Highlights
- New‑construction condominium completed in 2026
- Over 2600 SF of finished living space
- Four bedrooms and 2.5 baths
Financial Insights
Estimated NOI and Cap Rate
NOI / Yr
$51,731
Cap Rate
6.31%
Suggested Prices Based on Cap Rates
Cap Rate 5%
$1,034,620
$1.0M
Cap Rate 7%
$739,014
$739.0K
Cap Rate 9%
$574,789
$574.8K
Market Conditions
NOI Build-Up for 2,600 SF
Gross rent
$99.2K $38.16/SF
− Vacancy
−$5.2K −$1.98/SF
EGI
$94.1K $36.18/SF
− OpEx
−$42.3K −$16.28/SF
NOI
$51.7K $19.90/SF
Area
Middlesex County, MA
Vacancy
5.20%
Lease Rate
$38.16 /SF/Yr
Expense Ratio
45.00%
Simulate Cap Rate and NOI
Suggested Prices Based on Cap Rates
Cap Rate 5%
$1,034,620
Cap Rate 7%
$739,014
Cap Rate 9%
$574,789
Alternative Uses
Best Use
Apartment 5plus
$739.0K
$646.6K – $862.2K
NOI $51,731 @ 7.0% cap · market cap 6.31%
Second Best
—
—
no second resolved use
Theoretical Best
Office A
$1.54M
$1.35M – $1.80M
NOI $107,743 @ 7.0% cap · market cap 13.14%
Zoning and permitted uses should be independently verified with authorities.
How Realmo checks its estimates
Property Analytics
Current Use
Lease Details
1
Residential units
Location Intelligence
Trade Area within ½ mile
58
Businesses Nearby
Explore this area
Business Placement
Demographics for 01821, MA
30,909
Population
11,666
Households
2.6
Avg Household Size
43
Median Age
42%
College-Educated
95%
High-School Grad
16.6 sq mi
ZIP Area
1,862
Density / Sq Mi
$142,564
Median Household Income
$65,056
Median Earnings
$2,211
Median Rent
$581,300
Median Home Value

Questions? Ask Rey
Realmo’s AI knows this listing — price, zoning, demand, history. Ask anything.



Frequently Asked Questions
What type of property is this?
Residential income property - Four-bedroom condominium with flexible upper-level space, hardwood floors, and a quartz-appointed open kitchen.
Where is this residential income property located?
The property is located at 57 Bellflower Road Billerica, MA.
What is the asking price?
The asking price for this property is $819,900.
What are key features of this property?
This property features: New‑construction condominium completed in 2026; Over 2600 SF of finished living space; Four bedrooms and 2.5 baths


