Strip Center with Development
For Sale
Contact for pricing
5615 E Trent Ave, Spokane, WA 99212
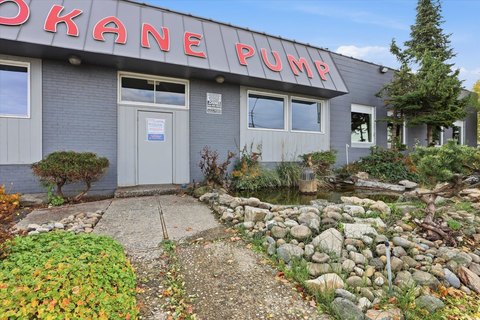
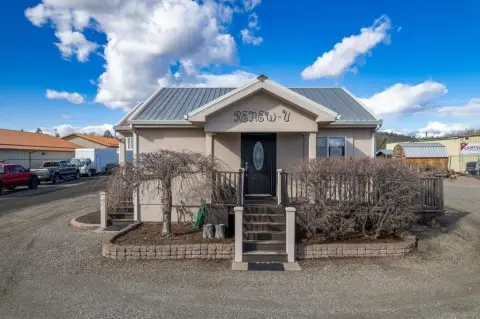
Commercially zoned retail center with a leased coffee stand, former restaurant space, and an undeveloped gravel area along Fancher.
Property Size5,724 SF
Price / SF$218.38
Days on Market171
Property Features for 5615 E Trent Ave
General Information
Standard status
Active
Size
5,724 SF
Class
B
Property subtype
Retail
Zoning
Commercial Mix Use-CMU
Building Details
Year Built
2008
Stories
1
Units
3
Tenancy
Multi
Listing Agency:
First Look Real Estate
Listed By:
Michael King · License #WA 98304
(509) 863-4853
Source:
Crexi
Added: Apr 28
Changed: Oct 15
Last Checked: Oct 14 at 10:27PM
Displayed information is deemed reliable but is not guaranteed and should be independently verified. All listing content including descriptions, pricing, images are the copyrighted material of First Look Real Estate
Investment Insights
Based on property information with market context.
This retail strip center, constructed in 2008, includes a coffee stand, former restaurant space, and additional retail-office configuration. The coffee stand is leased, with flexibility noted regarding that arrangement. A separate gravel area along Fancher remains available for development, adding a distinct component to the property’s existing improvements.
The property is located at 5615 E Trent Ave in Spokane, Washington, at the Trent and Fancher intersection. Zoning is Commercial Mix Use-CMU, supporting the property’s retail and office character. The combination of existing commercial improvements and a separately identified development area creates a varied property profile within the same offering.
The property is located at 5615 E Trent Ave in Spokane, Washington, at the Trent and Fancher intersection. Zoning is Commercial Mix Use-CMU, supporting the property’s retail and office character. The combination of existing commercial improvements and a separately identified development area creates a varied property profile within the same offering.
Key Highlights
- Separate gravel area along Fancher is available for development
- Retail‑office strip center constructed in 2008
- Leased coffee stand with a flexible arrangement
Financial Insights
Estimated NOI and Cap Rate
NOI / Yr
$59,393
Cap Rate
4.75%
Suggested Prices Based on Cap Rates
Cap Rate 5%
$1,187,860
$1.2M
Cap Rate 7%
$848,471
$848.5K
Cap Rate 9%
$659,922
$659.9K
Market Conditions
NOI Build-Up for 5,724 SF
Gross rent
$92.7K $16.20/SF
− Vacancy
−$7.9K −$1.38/SF
EGI
$84.8K $14.82/SF
− OpEx
−$25.5K −$4.45/SF
NOI
$59.4K $10.38/SF
Area
Spokane, WA
Vacancy
8.50%
Lease Rate
$16.20 /SF/Yr
Expense Ratio
30.00%
Simulate Cap Rate and NOI
Suggested Prices Based on Cap Rates
Cap Rate 5%
$1,187,860
Cap Rate 7%
$848,471
Cap Rate 9%
$659,922
Alternative Uses
Best Use
Retail
$848.5K
$742.4K – $989.9K
NOI $59,393 @ 7.0% cap · market cap 4.75%
Second Best
—
—
no second resolved use
Theoretical Best
Office A
$1.48M
$1.29M – $1.72M
NOI $103,375 @ 7.0% cap · market cap 8.27%
Zoning and permitted uses should be independently verified with authorities.
How Realmo checks its estimates
Property Analytics
Current Use
Location Intelligence
Trade Area within ½ mile
332
Businesses Nearby
Explore this area
Business Placement
Demographics for 99212, WA
21,672
Population
9,496
Households
2.3
Avg Household Size
41
Median Age
27%
College-Educated
93%
High-School Grad
12.3 sq mi
ZIP Area
1,762
Density / Sq Mi
$66,250
Median Household Income
$39,829
Median Earnings
$1,184
Median Rent
$314,300
Median Home Value
Market
Vacancy Rate% for Retail in West region

Questions? Ask Rey
Realmo’s AI knows this listing — price, zoning, demand, history. Ask anything.





Frequently Asked Questions
What type of property is this?
Strip mall - Commercially zoned retail center with a leased coffee stand, former restaurant space, and an undeveloped gravel area along Fancher.
Where is this strip mall located?
The property is located at 5615 E Trent Ave Spokane, WA.
What is the asking price?
The asking price for this property is $1,250,000.
What are key features of this property?
This property features: Separate gravel area along Fancher is available for development; Retail‑office strip center constructed in 2008; Leased coffee stand with a flexible arrangement


