Freestanding Office Building with Meeting
For Sale
$709,900
5500 Woodland Park Boulevard, Arlington, TX 76013
Well-maintained freestanding office building with private offices, reception, meeting space, and recent exterior and systems upgrades.
Property Size2,910 SF
Price / SF$243.95
Days on Market92
Property Features for 5500 Woodland Park Boulevard
General Information
Standard status
Active
Size
2,910 SF
Building Details
Year Built
1995
Stories
2
Listing Agency:
Heather S Konopka
Listed By:
Heather Konopka · License #0453672
(817) 715-1932
Source:
Yourdavisteam
Added: Jul 23
Changed: Oct 2
Last Checked: Oct 7 at 3:02PM
Displayed information is deemed reliable but is not guaranteed and should be independently verified. All listing content including descriptions, pricing, images are the copyrighted material of Heather S Konopka

Ask AI about this property
Review the available facts, identify missing information and prepare questions for the agent.
Investment Insights
Based on property information with market context.
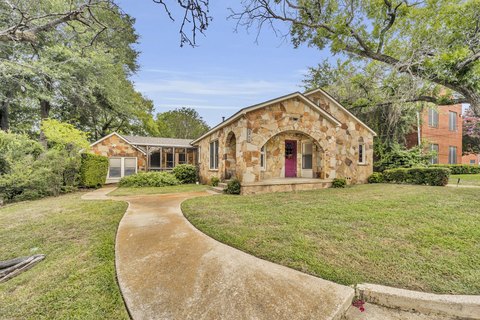
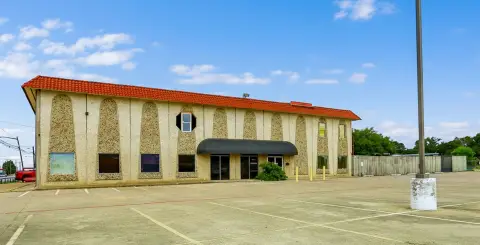
5500 Woodland Park Blvd is a well-maintained professional office building originally built in 1995. The property includes private offices, reception and administrative areas, meeting space, and storage. A second floor was later added to provide additional office space and flexibility for storage for an owner-user or investor.
The building has undergone multiple capital improvements, including a new roof in 2017, two new Lennox HVAC units installed in 2019, foundation work completed in 2024 with a transferable warranty, and four sets of new exterior fiberglass double French doors installed in 2024. Plumbing updates include two new toilets in 2024, sewer line repairs in 2022, and a new hot water heater with an alarm in 2017, along with a new kitchen faucet in 2017. Electrical improvements completed in 2017 included replacement of lighting ballasts and additional work involving breakers and electrical lines.
The property is described as offering convenient access to surrounding businesses, residential neighborhoods, restaurants, and major thoroughfares, and includes additional land for parking or expansion. Buyers and their agents should independently verify all measurements, zoning, permitted uses, and property information.
The building has undergone multiple capital improvements, including a new roof in 2017, two new Lennox HVAC units installed in 2019, foundation work completed in 2024 with a transferable warranty, and four sets of new exterior fiberglass double French doors installed in 2024. Plumbing updates include two new toilets in 2024, sewer line repairs in 2022, and a new hot water heater with an alarm in 2017, along with a new kitchen faucet in 2017. Electrical improvements completed in 2017 included replacement of lighting ballasts and additional work involving breakers and electrical lines.
The property is described as offering convenient access to surrounding businesses, residential neighborhoods, restaurants, and major thoroughfares, and includes additional land for parking or expansion. Buyers and their agents should independently verify all measurements, zoning, permitted uses, and property information.
Key Highlights
- Freestanding professional office building built in 1995 with approx. 2,910 SF (per appraiser)
- Added a second floor for additional office space and flexible storage for an owner‑user or investor
- Recent capital improvements: new roof (2017), foundation work with transferable warranty (2024), and 4 sets of new exterior fiberglass double French doors (2024)
Financial Insights
Estimated NOI and Cap Rate
NOI / Yr
$45,047
Cap Rate
6.35%
Suggested Prices Based on Cap Rates
Cap Rate 5%
$900,940
$900.9K
Cap Rate 7%
$643,529
$643.5K
Cap Rate 9%
$500,522
$500.5K
Market Conditions
NOI Build-Up for 2,910 SF
Gross rent
$69.8K $24.00/SF
− Vacancy
−$9.8K −$3.36/SF
EGI
$60.1K $20.64/SF
− OpEx
−$15.0K −$5.16/SF
NOI
$45.0K $15.48/SF
Area
Arlington, TX
Vacancy
14.00%
Lease Rate
$24.00 /SF/Yr
Expense Ratio
25.00%
Simulate Cap Rate and NOI
Suggested Prices Based on Cap Rates
Cap Rate 5%
$900,940
Cap Rate 7%
$643,529
Cap Rate 9%
$500,522
Alternative Uses
Best Use
Office B
$643.5K
$563.1K – $750.8K
NOI $45,047 @ 7.0% cap · market cap 6.35%
Second Best
—
—
no second resolved use
Theoretical Best
Office A
$858.0K
$750.8K – $1.00M
NOI $60,062 @ 7.0% cap · market cap 8.46%
Zoning and permitted uses should be independently verified with authorities.
How Realmo checks its estimates
Property Analytics
Who owns this building?
See the owner, sales and loan history
Open Analytics
Current Use
Location Intelligence
Trade Area within ½ mile
184
Businesses Nearby
Explore this area
Business Placement
Demographics for 76013, TX
36,535
Population
14,431
Households
2.5
Avg Household Size
32
Median Age
43%
College-Educated
91%
High-School Grad
9.0 sq mi
ZIP Area
4,059
Density / Sq Mi
$67,333
Median Household Income
$31,613
Median Earnings
$1,267
Median Rent
$287,000
Median Home Value
Check the figures for this property
Cap Rate, Value Estimation, Potential NOI and more
View Realmo Analytics
Market
Vacancy Rate% for Office in South region







Frequently Asked Questions
What type of property is this?
Office building - Well-maintained freestanding office building with private offices, reception, meeting space, and recent exterior and systems upgrades.
Where is this office building located?
The property is located at 5500 Woodland Park Boulevard Arlington, TX.
What is the asking price?
The asking price for this property is $709,900.
What are key features of this property?
This property features: Freestanding professional office building built in 1995 with approx. 2,910 SF (per appraiser); Added a second floor for additional office space and flexible storage for an owner‑user or investor; Recent capital improvements: new roof (2017), foundation work with transferable warranty (2024), and 4 sets of new exterior fiberglass double French doors (2024)


