Mixed-Use Storefront with
For Sale
$1,350,000
546-548 CARPENTER LANE, Philadelphia, PA 19119
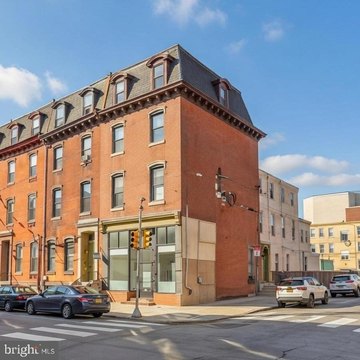
Versatile retail storefront set within a CMX-2 mixed-use zone, featuring multiple bays, rooftop ventilation, and a designated loading area.
Property Size3,804 SF
Price / SF$355.26
Days on Market101
Property Features for 546-548 CARPENTER LANE
General Information
Standard status
Active
Size
3,804 SF
Property subtype
Retail
Zoning
CMX-2
Additional Details
Clear Height
11 ft
Taxes and HOA fees
Annual Taxes
$3,156
Building Details
Building Size
3,804 SF
Year Built
1925
Listing Agency:
BHHS Fox & Roach The Harper at Rittenhouse Square
Listed By:
Marc A. Hammarberg · License #AB067991
(215) 790-5501
Source:
Lizclarkrealestate
Added: Jul 13
Changed: Oct 21
Last Checked: Oct 21 at 4:28AM
Displayed information is deemed reliable but is not guaranteed and should be independently verified. All listing content including descriptions, pricing, images are the copyrighted material of BHHS Fox & Roach The Harper at Rittenhouse Square

Ask AI about this property
Review the available facts, identify missing information and prepare questions for the agent.
Investment Insights
Based on property information with market context.
This mixed-use storefront property for sale includes two separately deeded parcels combined into a single functional site. The space totals approximately 3,800 square feet and consists of expansive open floor plans spanning both buildings, connected by multiple interior openings and basement access. Ceiling height is approximately 11 feet, and rooftop industrial ventilation fans support commercial operations. The property includes one full bathroom, three half baths, and three interior stairways to the basement, along with individual sidewalk steel cellar entrances for each building. A newly installed torch-down modified bitumen roof is a recent improvement.
The property is zoned CMX-2 Mixed Use and offers the flexibility to support a range of commercial and mixed-use applications, subject to applicable approvals. Approximately 45 feet of designated loading zone runs along the front, providing practical access for deliveries and day-to-day operations.
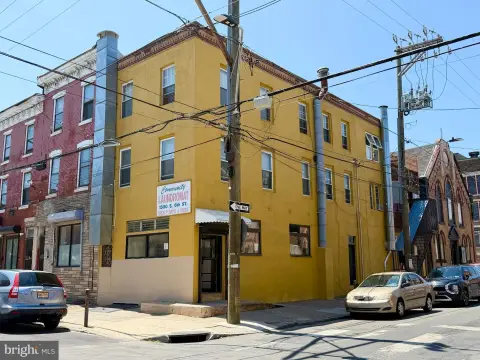
For more than six decades, the property has operated as a neighborhood dry-cleaning business, illustrating long-standing utility of the improved space while allowing the next owner to reimagine the layout within the permitted framework.
The property is zoned CMX-2 Mixed Use and offers the flexibility to support a range of commercial and mixed-use applications, subject to applicable approvals. Approximately 45 feet of designated loading zone runs along the front, providing practical access for deliveries and day-to-day operations.
For more than six decades, the property has operated as a neighborhood dry-cleaning business, illustrating long-standing utility of the improved space while allowing the next owner to reimagine the layout within the permitted framework.
Key Highlights
- 3,800 SF commercial property built in 1925 in Mount Airy with an expansive open floor plan across both buildings
- Zoned CMX‑2 Mixed Use, with potential for retail, restaurant, office, creative workspace, mixed‑use redevelopment, or residential units above where permitted
- Two separately deeded parcels combined into one functional space, with multiple interior openings and access through the basement
Financial Insights
Estimated NOI and Cap Rate
NOI / Yr
$42,948
Cap Rate
3.18%
Suggested Prices Based on Cap Rates
Cap Rate 5%
$858,960
$859.0K
Cap Rate 7%
$613,543
$613.5K
Cap Rate 9%
$477,200
$477.2K
Market Conditions
NOI Build-Up for 3,800 SF
Gross rent
$68.4K $18.00/SF
− Vacancy
−$7.0K −$1.85/SF
EGI
$61.4K $16.15/SF
− OpEx
−$18.4K −$4.84/SF
NOI
$42.9K $11.30/SF
Area
Philadelphia, PA
Vacancy
10.30%
Lease Rate
$18.00 /SF/Yr
Expense Ratio
30.00%
Simulate Cap Rate and NOI
Suggested Prices Based on Cap Rates
Cap Rate 5%
$858,960
Cap Rate 7%
$613,543
Cap Rate 9%
$477,200
Alternative Uses
Best Use
Retail
$613.5K
$536.9K – $715.8K
NOI $42,948 @ 7.0% cap · market cap 3.18%
Second Best
—
—
no second resolved use
Theoretical Best
Multifamily LT 5
$926.4K
$810.6K – $1.08M
NOI $64,847 @ 7.0% cap · market cap 4.80%
Zoning and permitted uses should be independently verified with authorities.
How Realmo checks its estimates
Property Analytics
Current Use
Lease Details
11 ft
Clear height
Location Intelligence
Trade Area within ½ mile
707
Businesses Nearby
9k
Monthly Visits Nearby
Under-served
Demand for This Use
Explore this area
Business Placement
Foot Traffic Nearby
Shops & Services 100%
Family Dollar
Shops & Services
8,550 visits/mo
0.4 miles
Demographics for 19119, PA
27,265
Population
13,909
Households
2
Avg Household Size
44
Median Age
55%
College-Educated
96%
High-School Grad
3.4 sq mi
ZIP Area
8,019
Density / Sq Mi
$81,609
Median Household Income
$54,598
Median Earnings
$1,291
Median Rent
$326,600
Median Home Value
Market
Vacancy Rate% for Retail in Philadelphia, PA






Similar Off Market Nearby
- DSM Flowers — 6334 Germantown Ave, Philadelphia, PA 19144
- Picking Flowers , Inc & Cc Boutique — Philadelphia, PA 19144
- Abundant Blooms — 6633 Germantown Ave 2nd floor, Philadelphia, PA 19119
Frequently Asked Questions
What type of property is this?
Storefront property - Versatile retail storefront set within a CMX-2 mixed-use zone, featuring multiple bays, rooftop ventilation, and a designated loading area.
Where is this storefront property located?
The property is located at 546-548 CARPENTER LANE Philadelphia, PA.
What is the asking price?
The asking price for this property is $1,350,000.
What are key features of this property?
This property features: 3,800 SF commercial property built in 1925 in Mount Airy with an expansive open floor plan across both buildings; Zoned CMX‑2 Mixed Use, with potential for retail, restaurant, office, creative workspace, mixed‑use redevelopment, or residential units above where permitted; Two separately deeded parcels combined into one functional space, with multiple interior openings and access through the basement