Furnished End-Unit
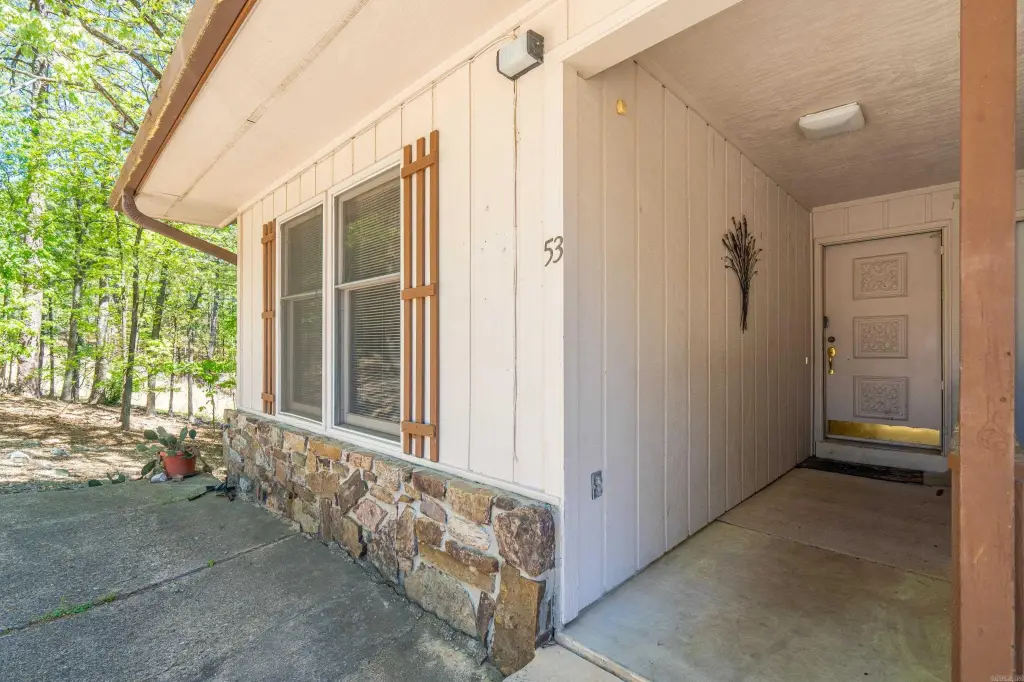
53 Halcon Place Hot Springs Village, AR 71909
For Sale
$155,000
CONDOS - Hot Springs Village, AR
Property Size1,402 SF
Price / SF$110.56
Days on Market109
Property Features for 53 Halcon Place
General Information
Property type
Residential
Property subtype
Duplex
Bedrooms
3
Bathrooms
2
Rooms
Bathroom 1, Laundry Room, Bonus Room, Bedroom 2, Bathroom 2, Bedroom 3, Bedroom 1
Patio and Porch features
Deck
Interior features
Washer Connection, Dryer Connection-Electric, Water Heater-Electric, Ceiling Fan(s), Walk-in Shower
Exterior features
Deck
Appliances
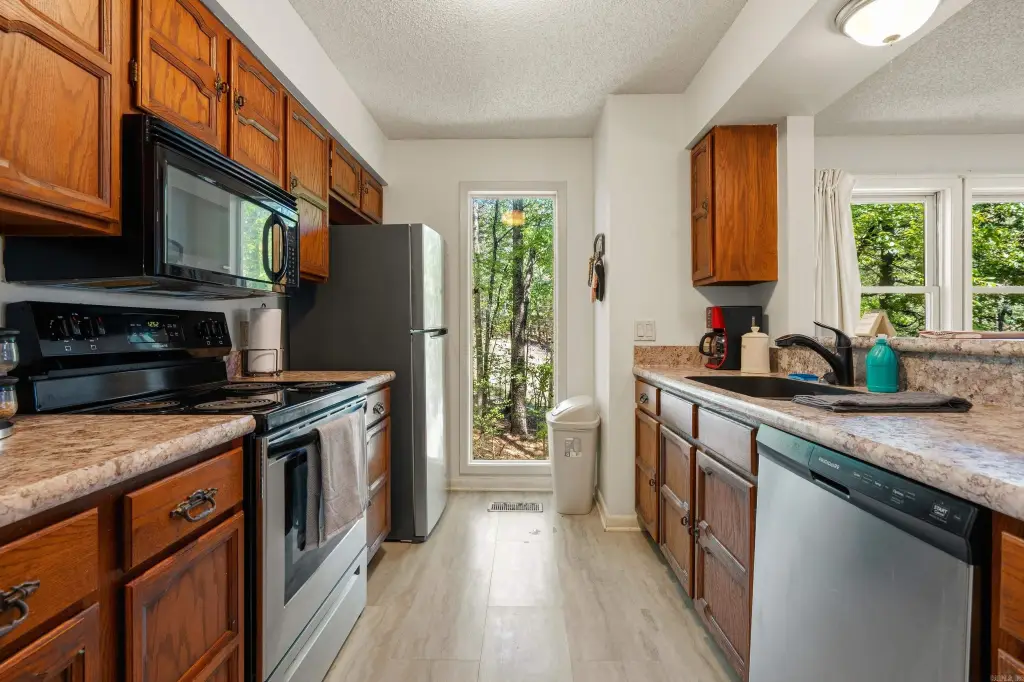
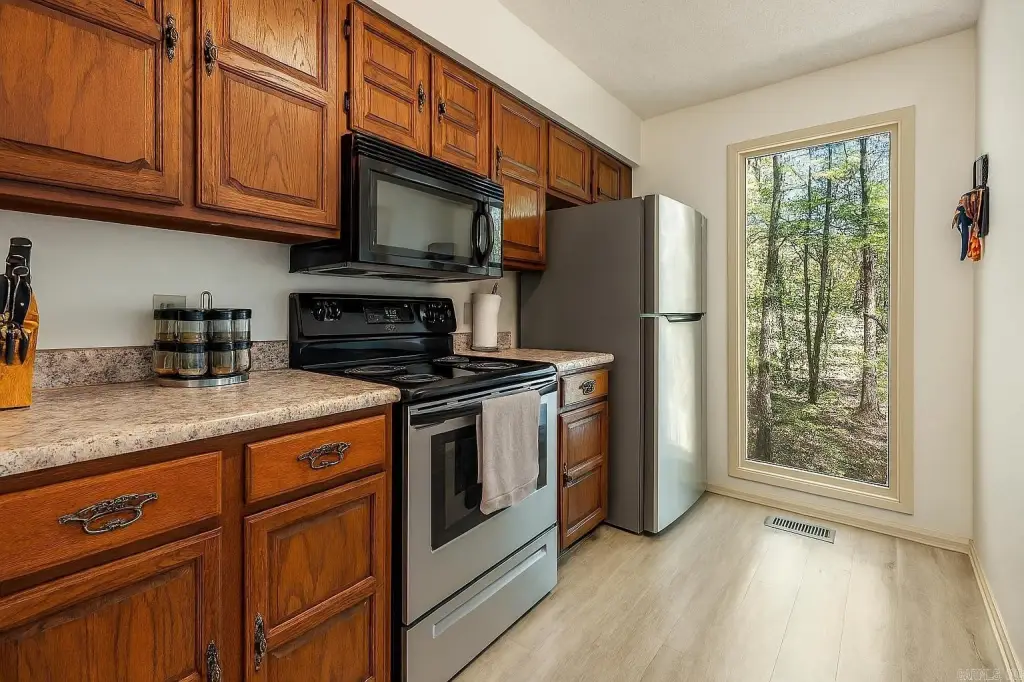
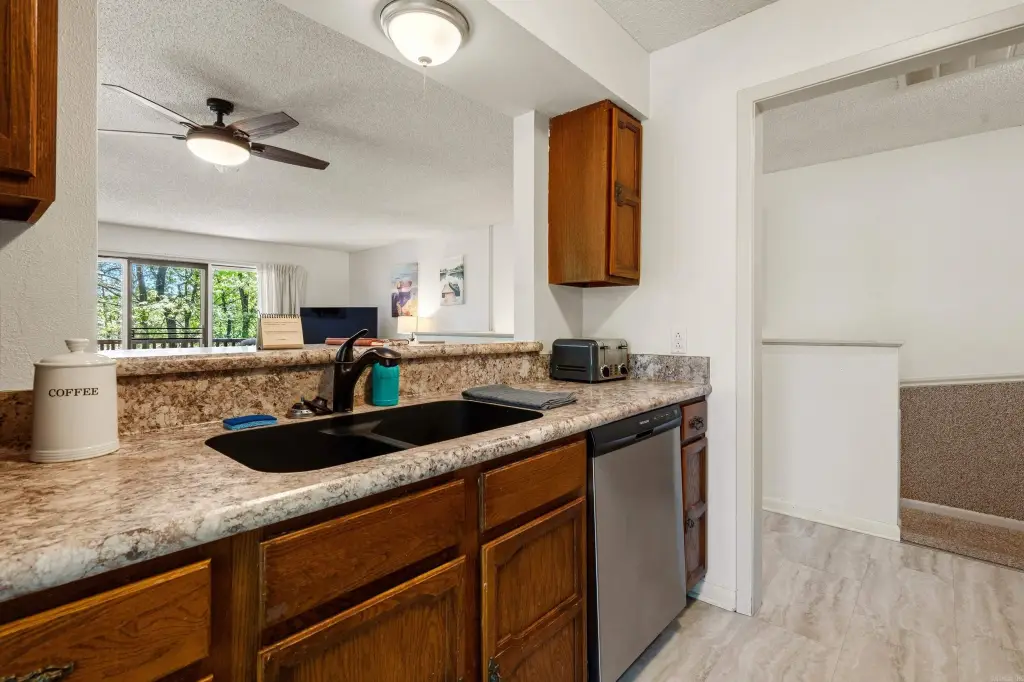
Free-Standing Stove, Microwave, Dishwasher, Disposal, Ice Maker Connection
Standard status
Active
Size
1,402 SF
Taxes and HOA fees
Tax Year
2025
Tax Description
Lot 1, Block 8, Madrid Courts
Tax Annual Amount
951
Building Details
Year built
1976
Floors in Building
2
Flooring type
Carpet, Tile, Vinyl
Roof type
Composition
Architectural style
Other
Listing Agency:
Taylor Realty Group HSV
(501) 463-9506
Listed By:
Janae Cook Richards
(501) 282-4430
Added: Apr 10
Changed: Jul 24
Last Checked: Jul 27 at 11:06AM
MLS# 26014219
Copyright © 2026 Cooperative Arkansas Realtors Multiple Listing Service. All rights reserved. All information provided by the listing agent/broker is deemed reliable but is not guaranteed and should be independently verified.
Investment Insights
Based on property information with market context.
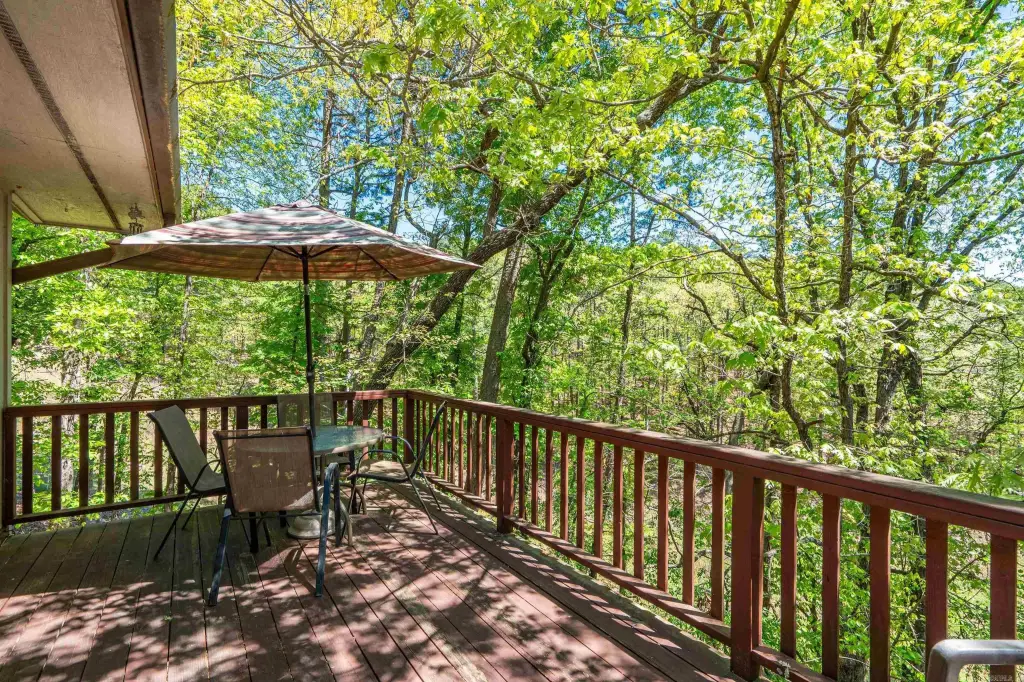
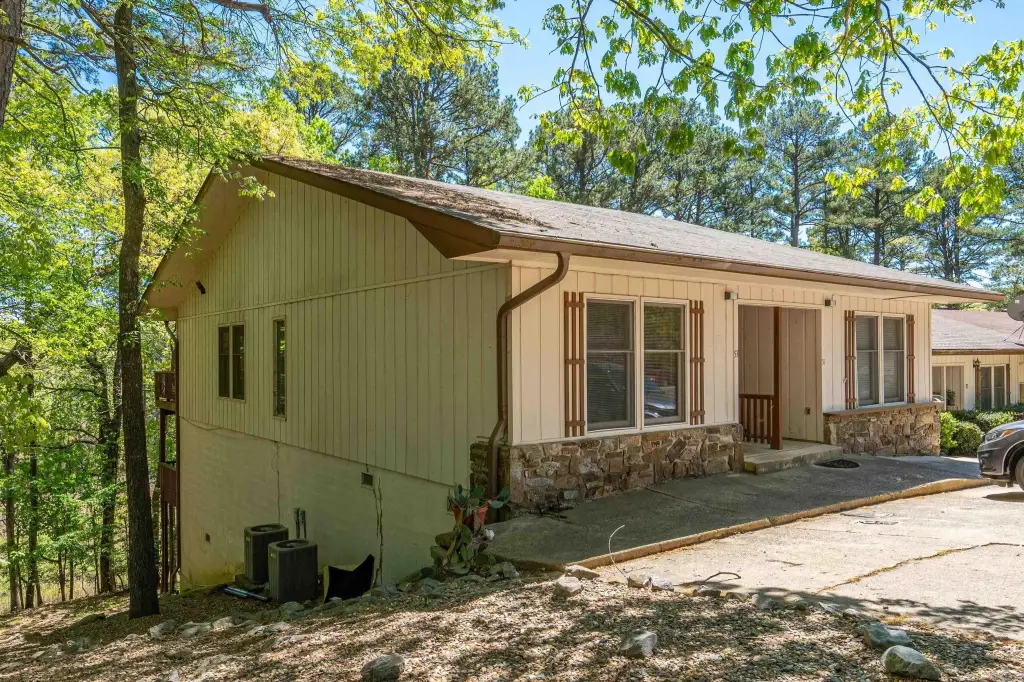
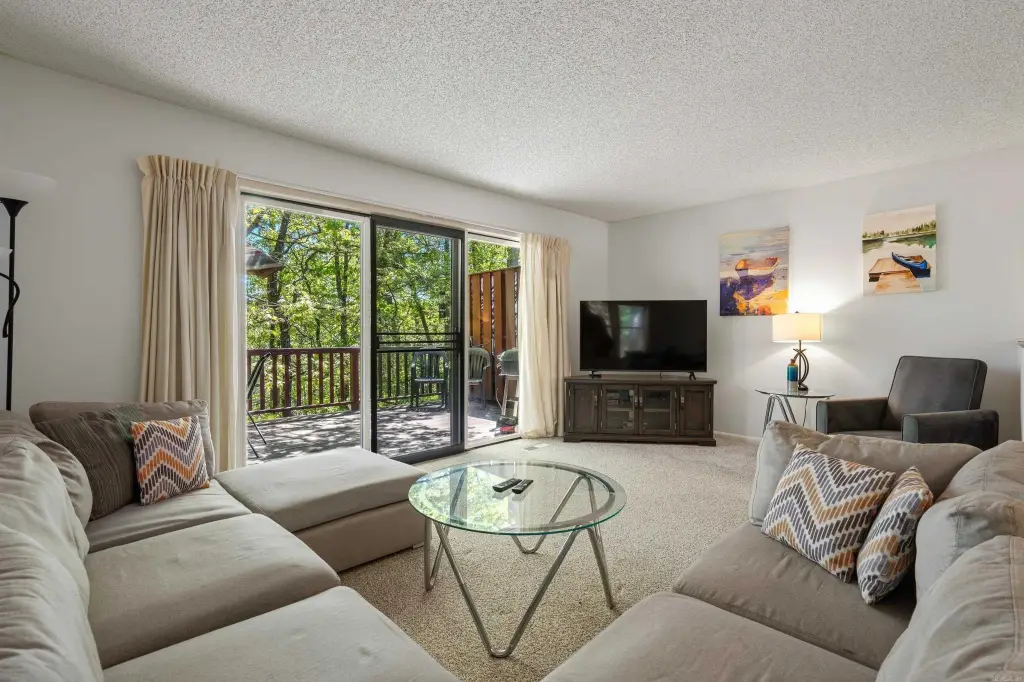
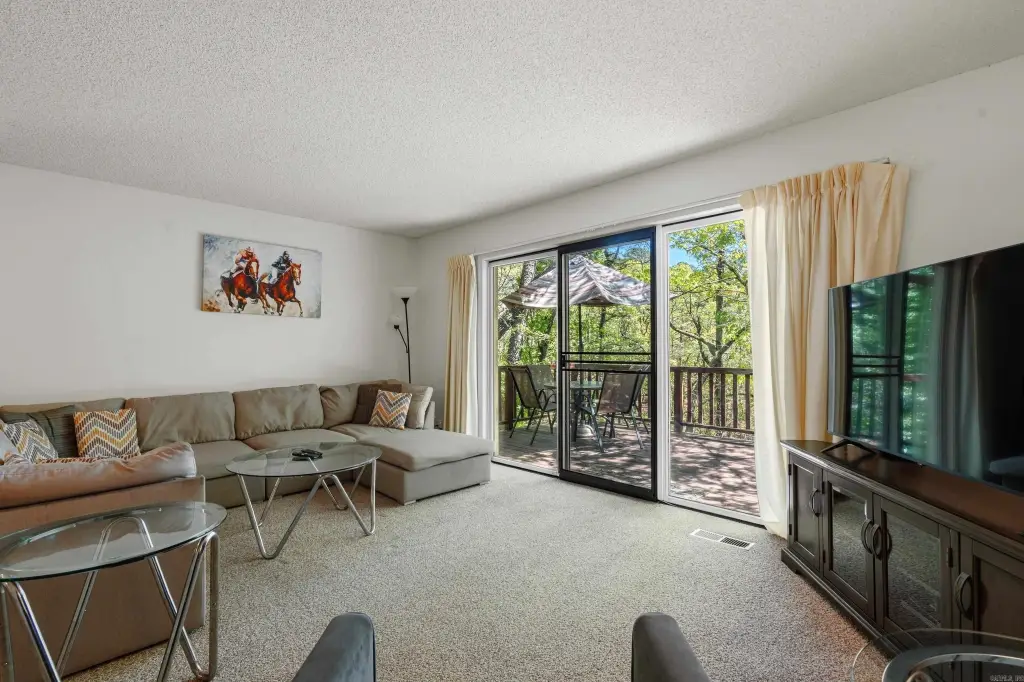
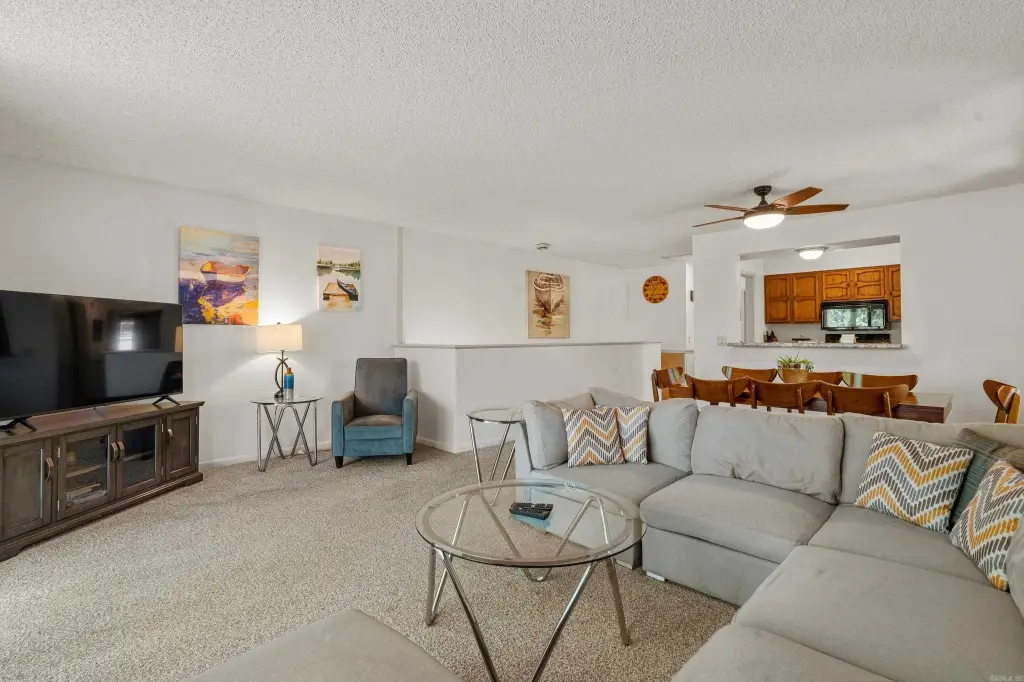
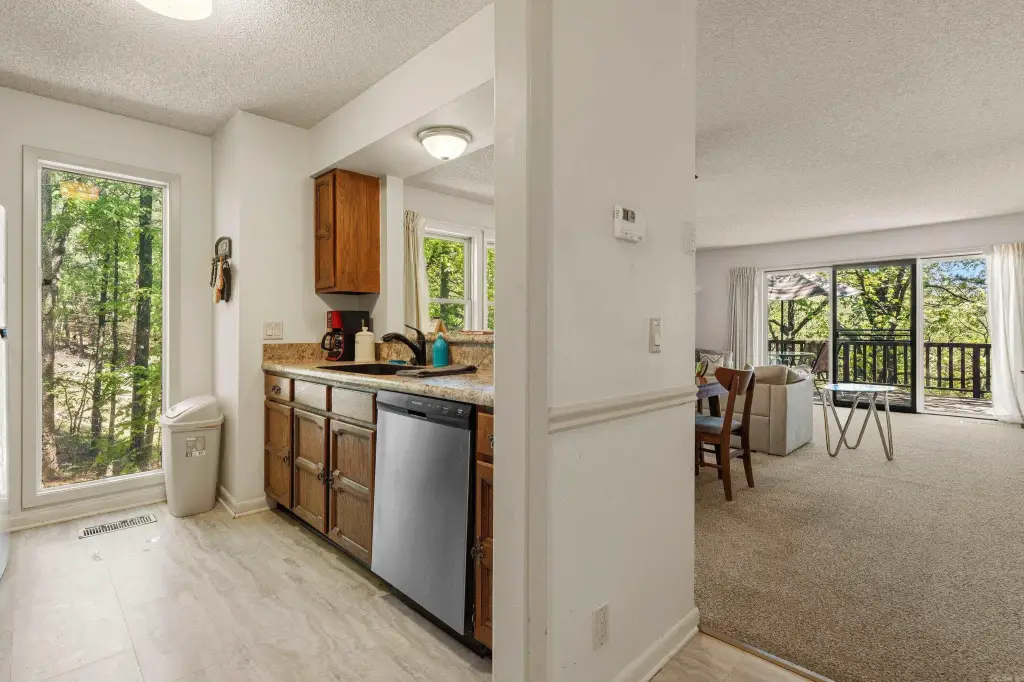
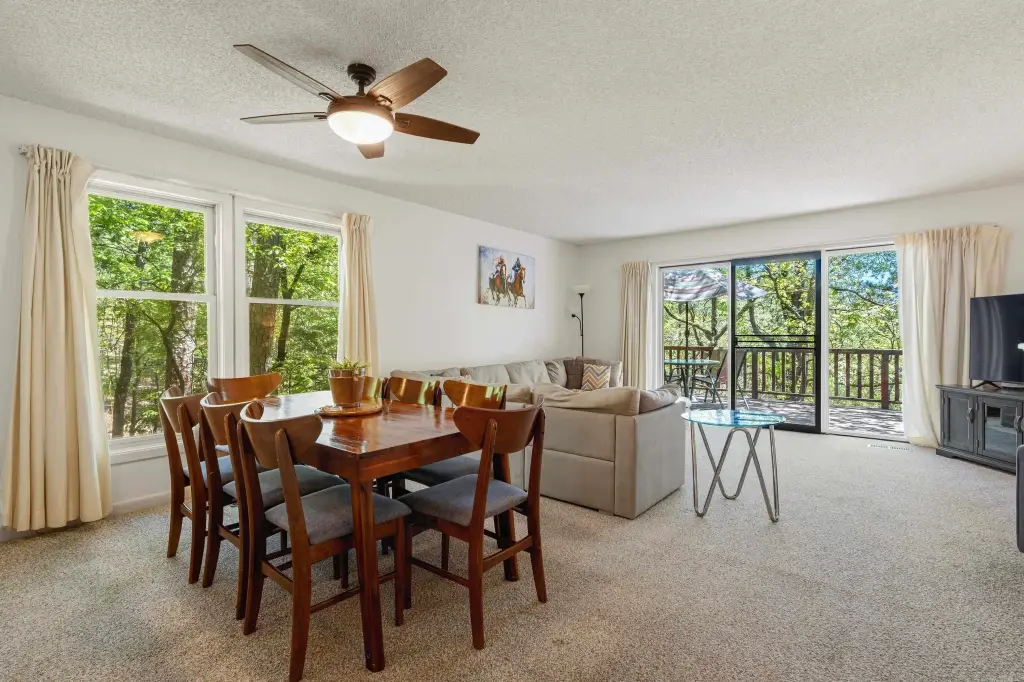
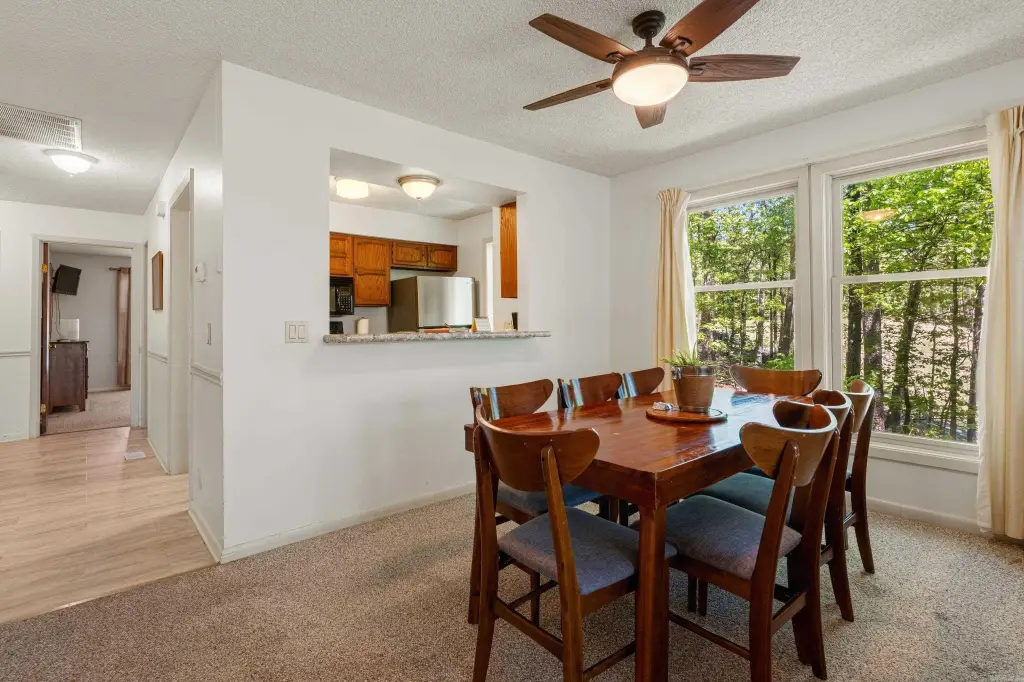
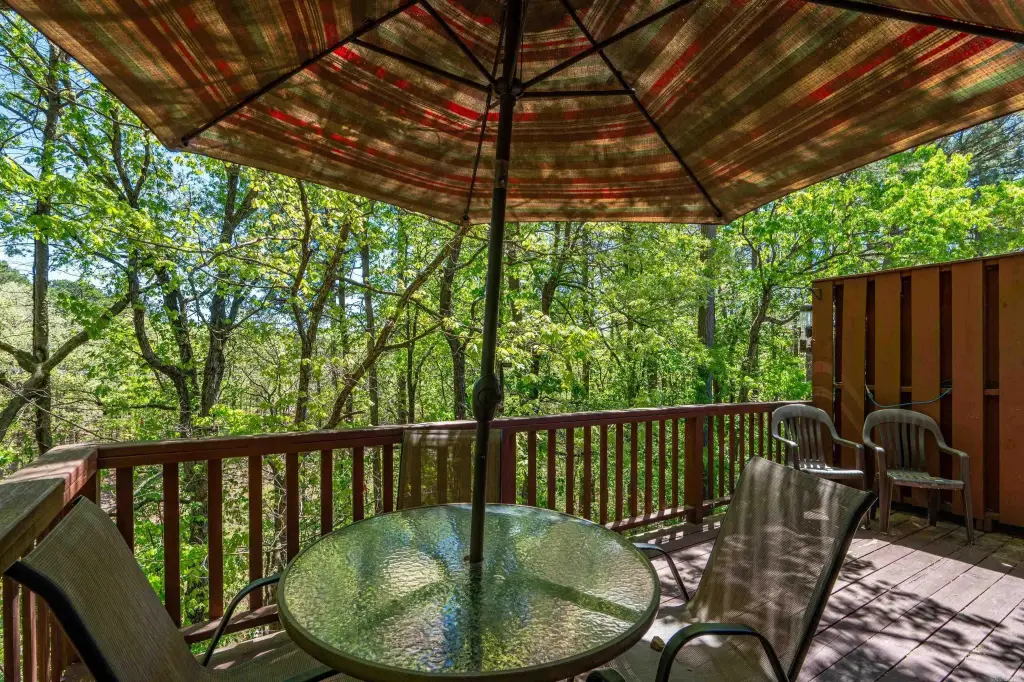
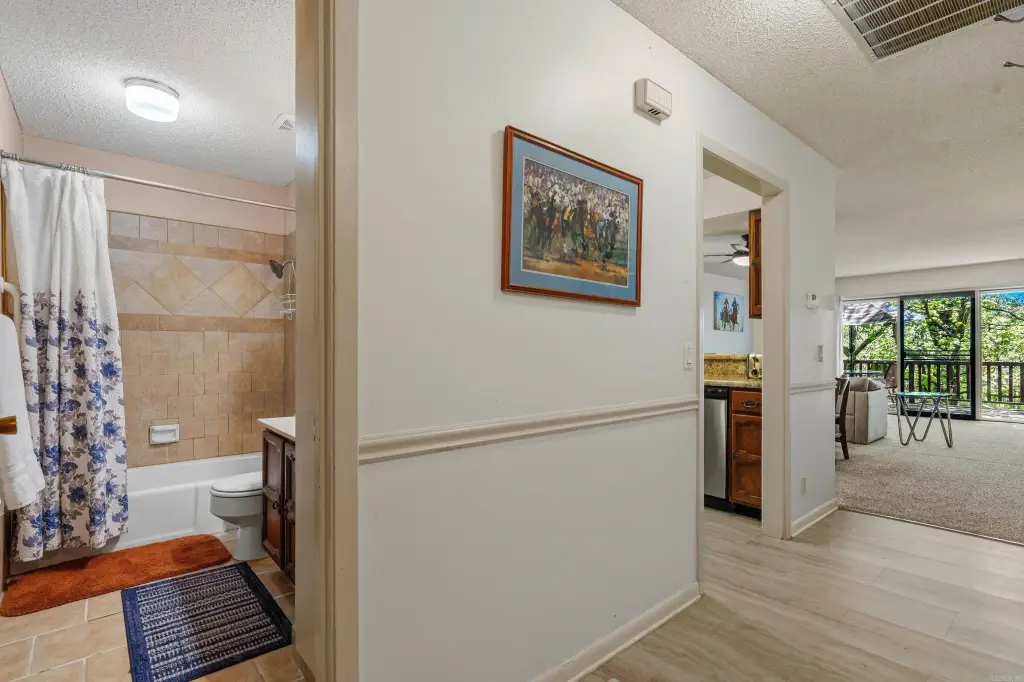
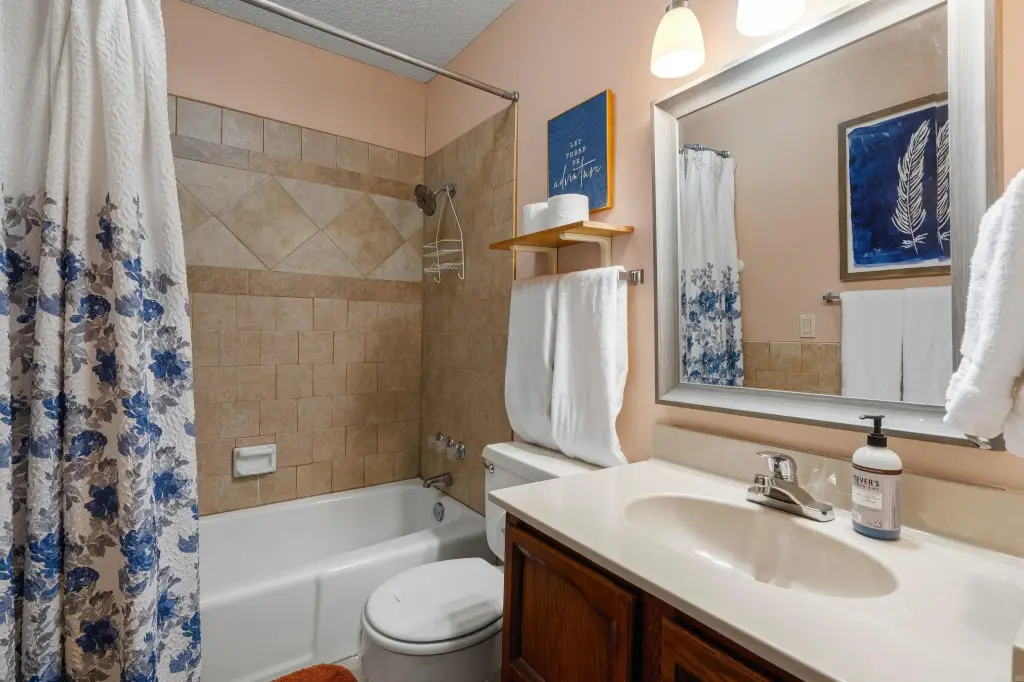
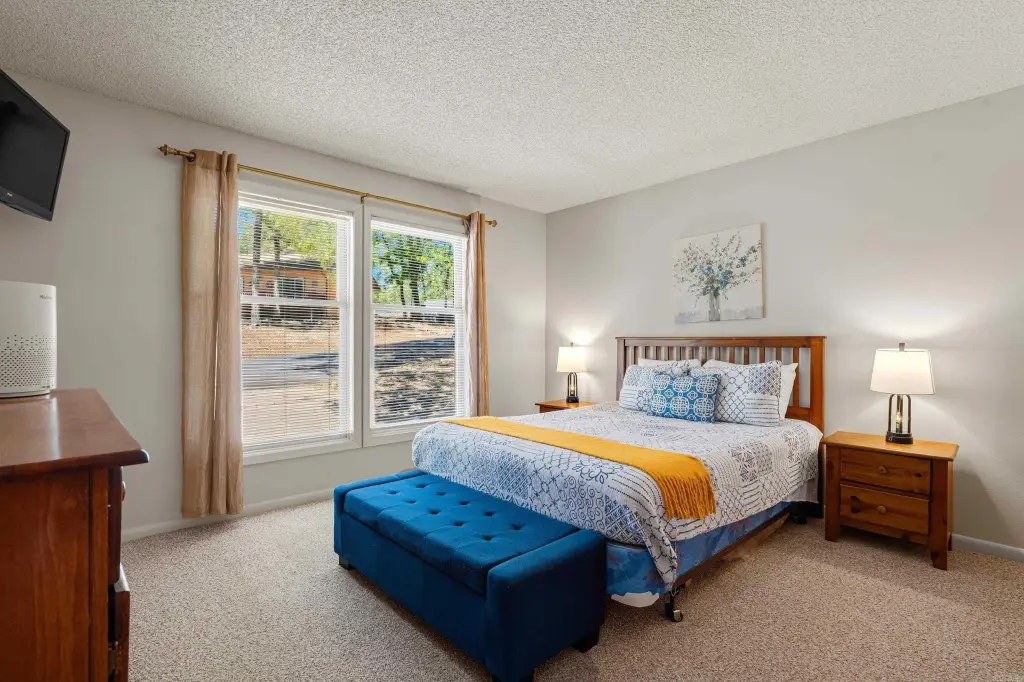
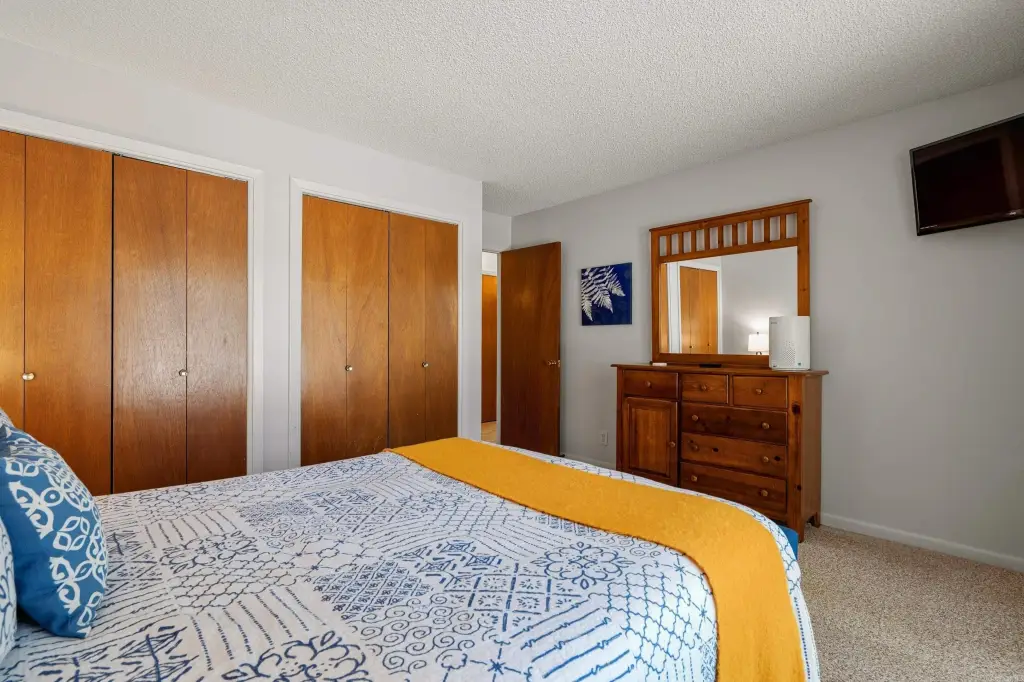
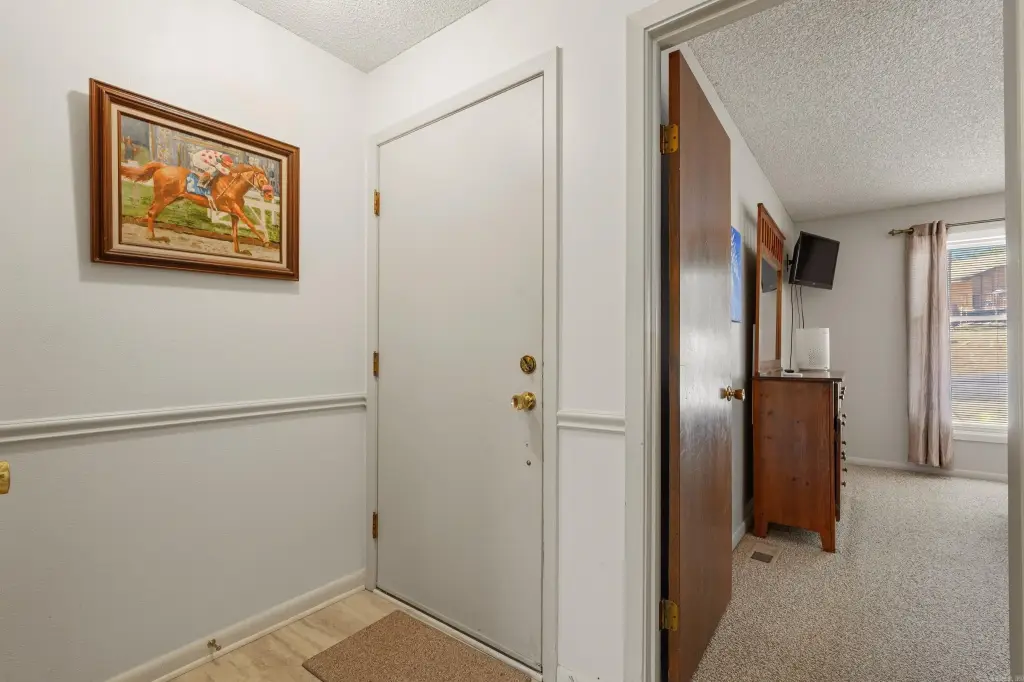
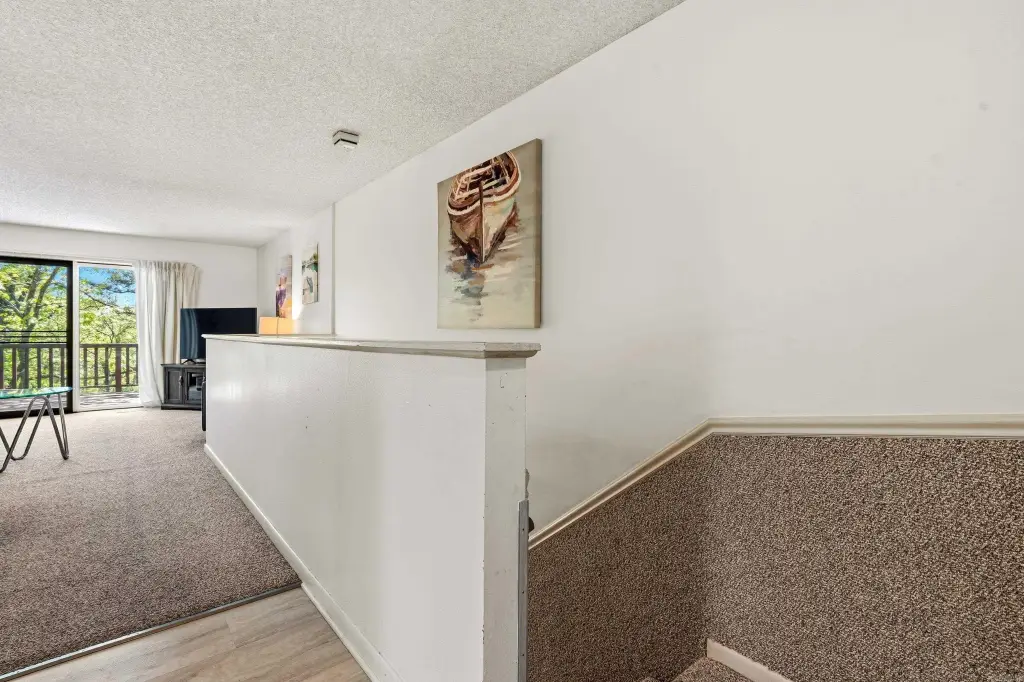
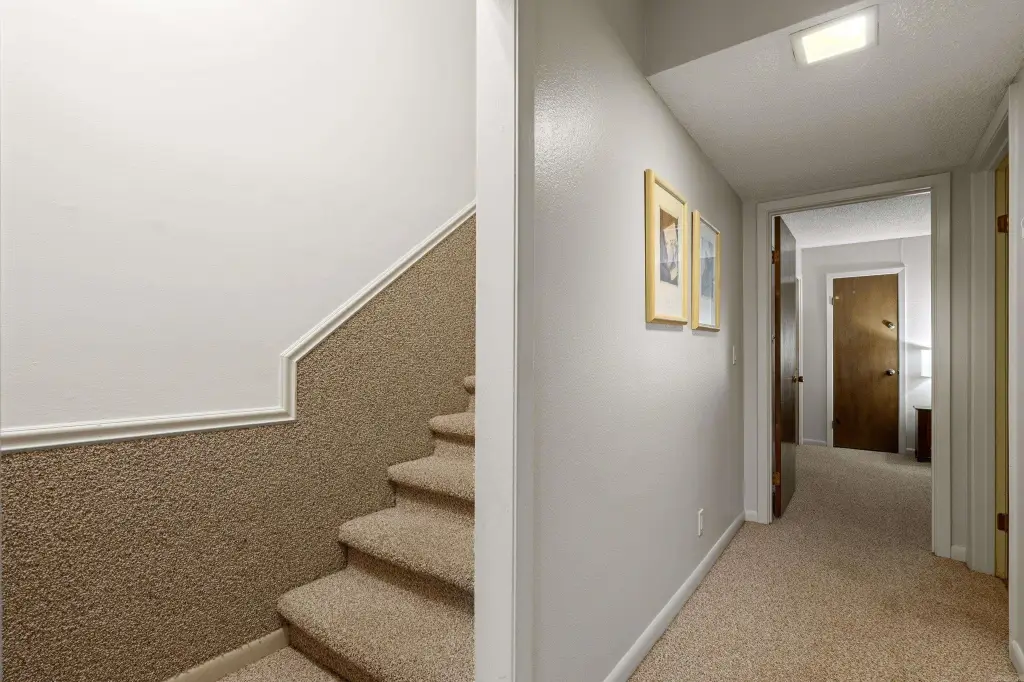
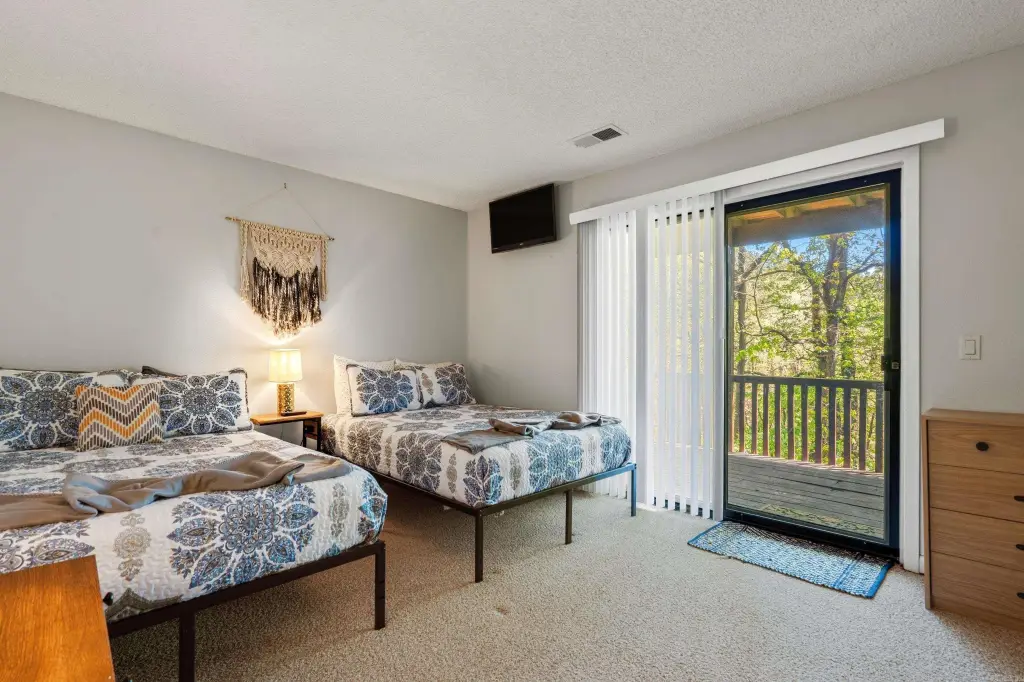
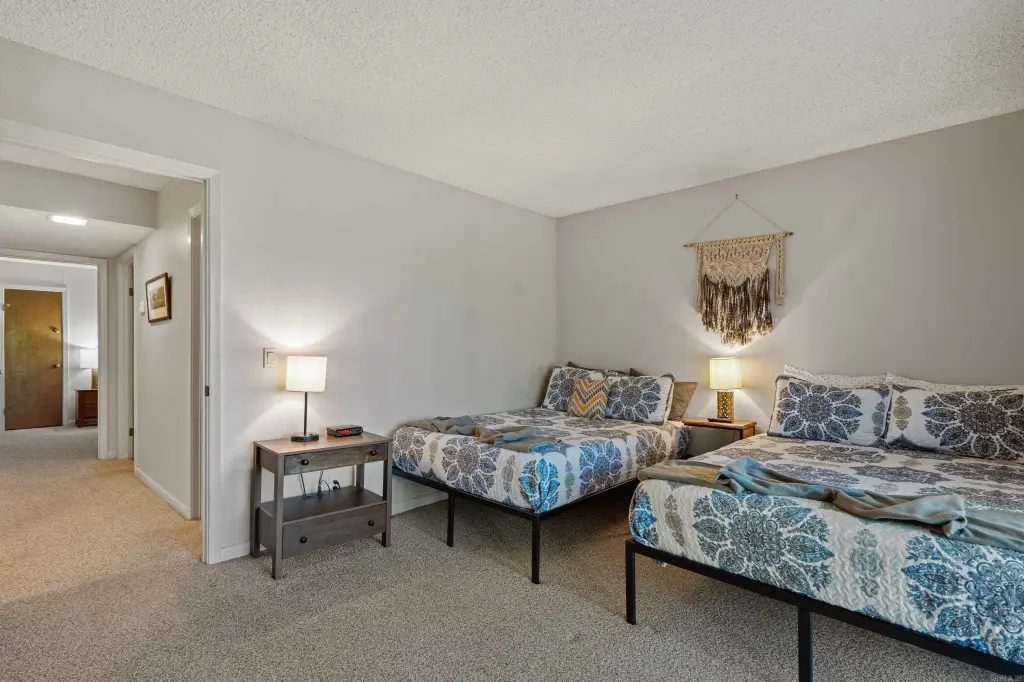
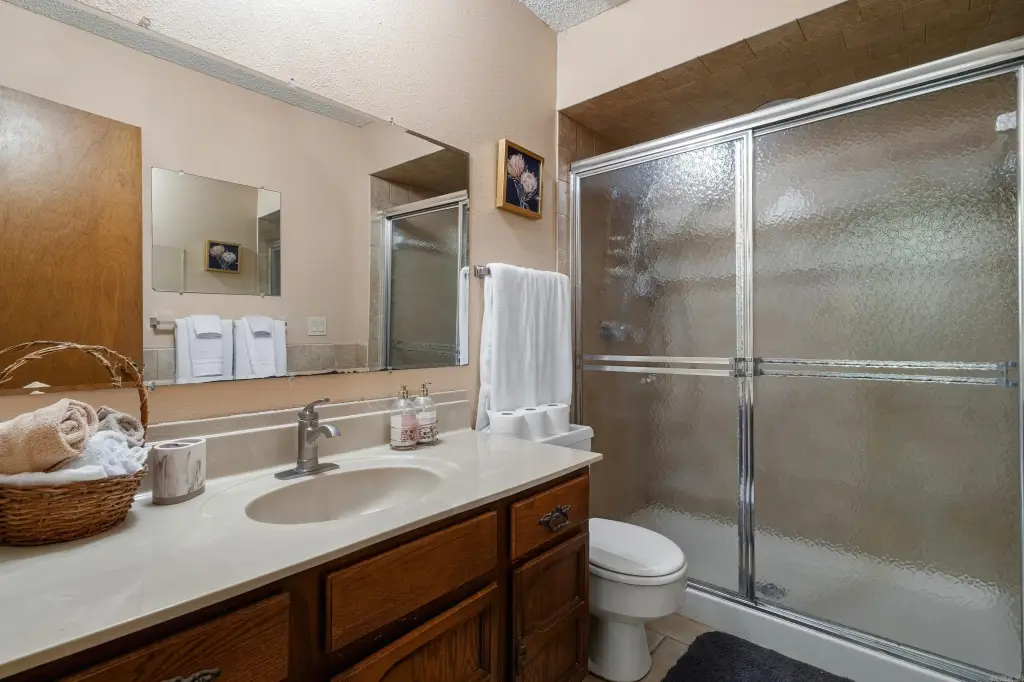
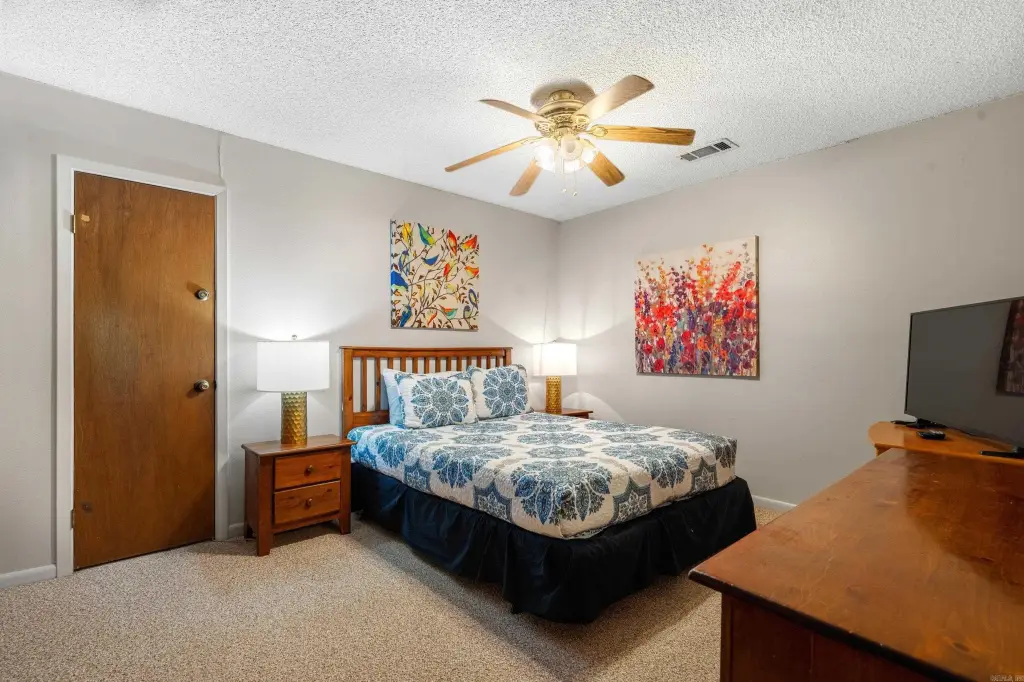
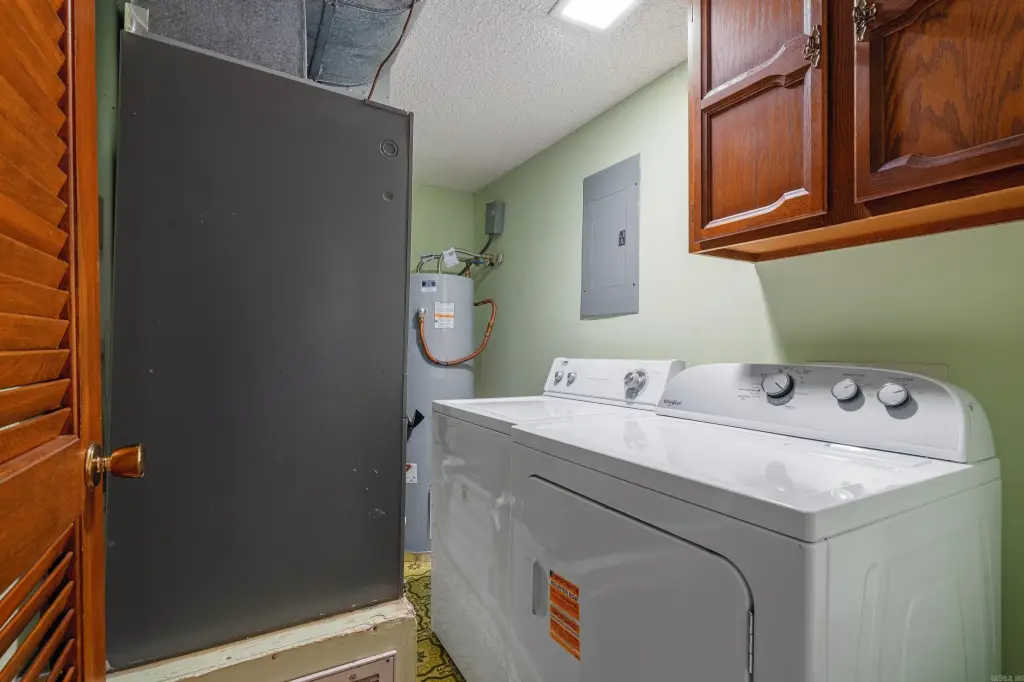
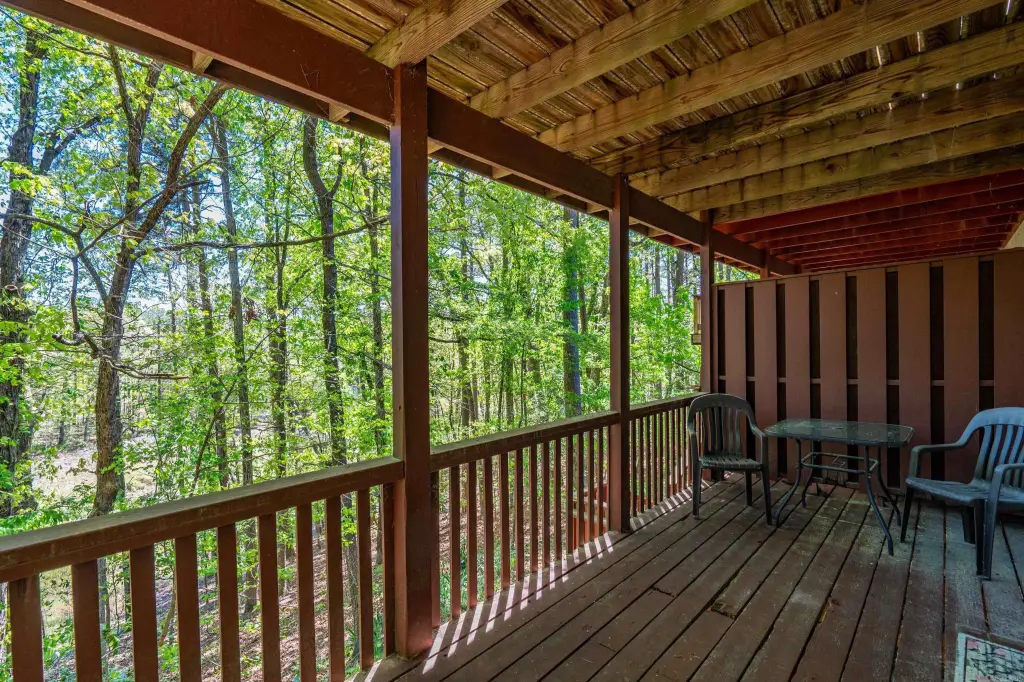
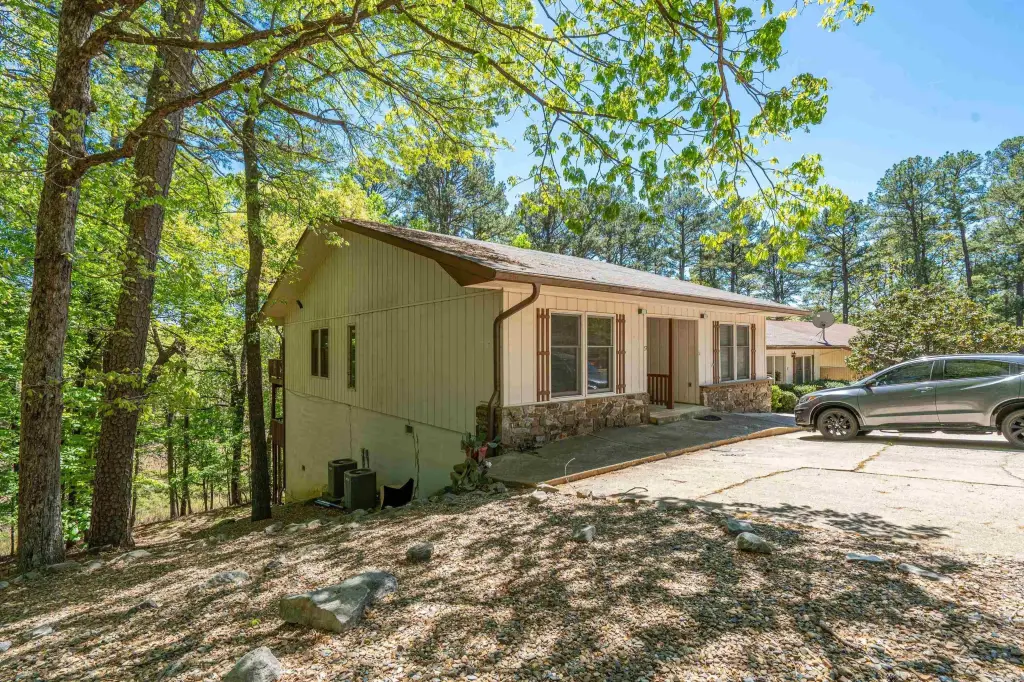
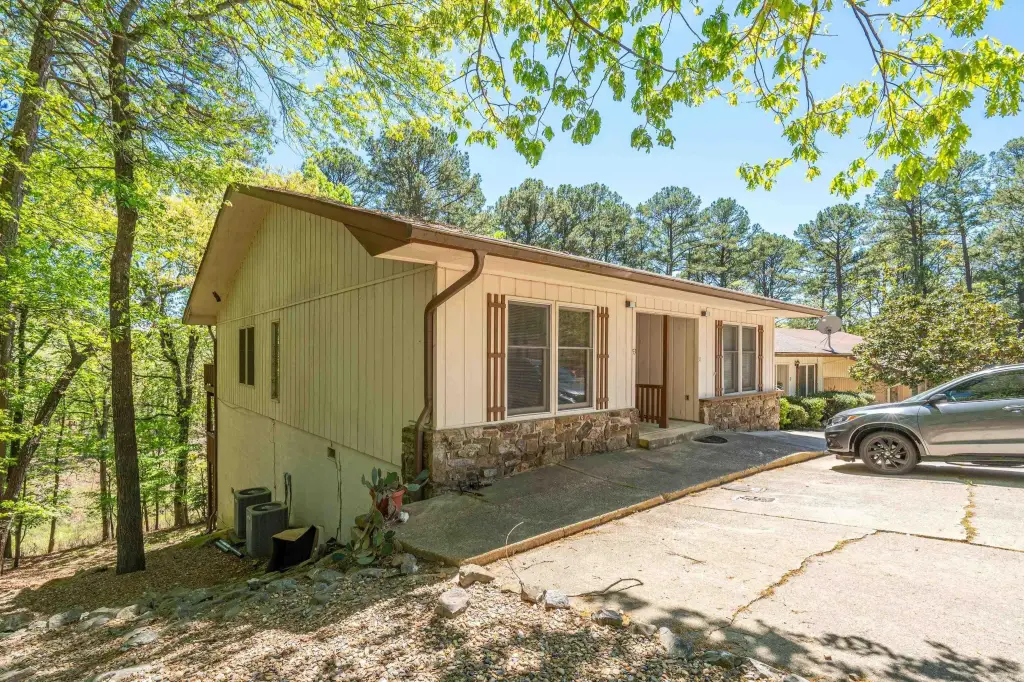
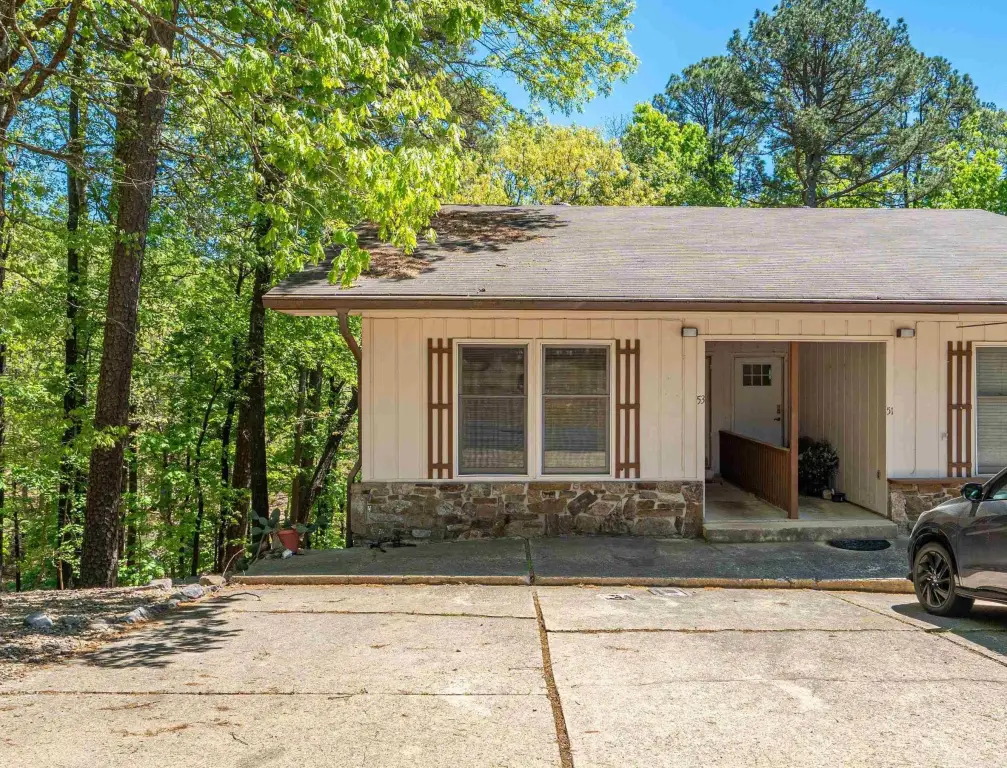
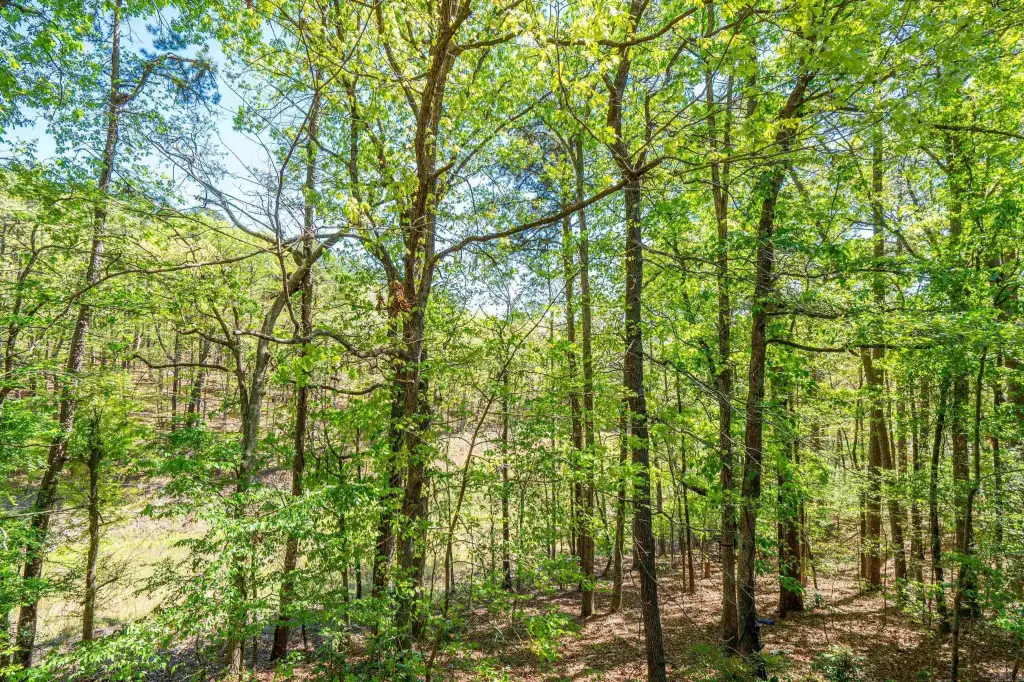
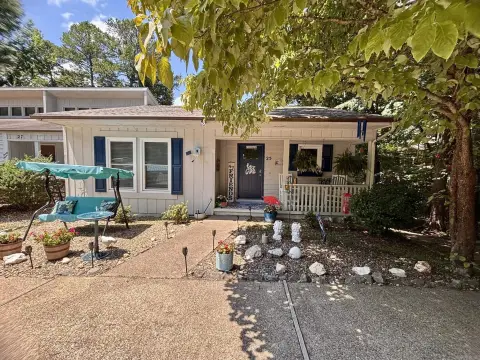
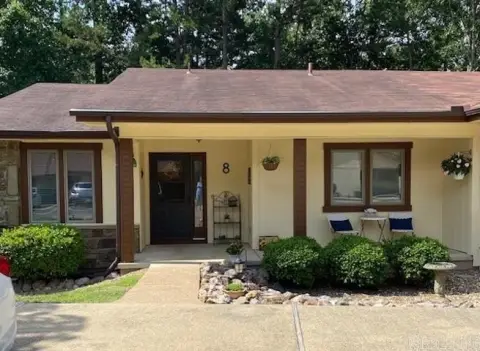
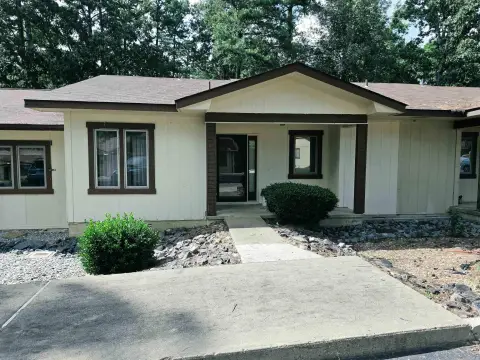
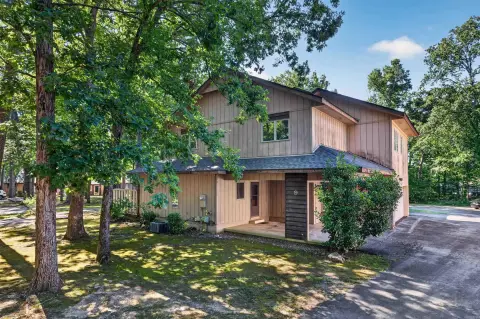
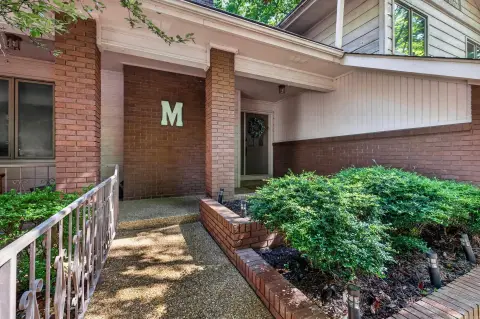
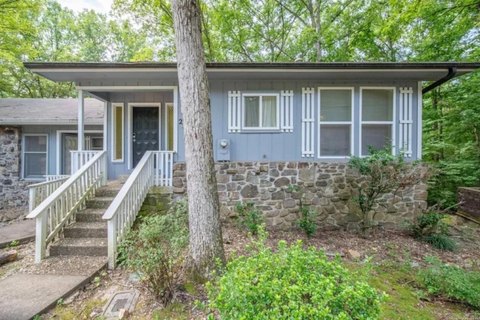
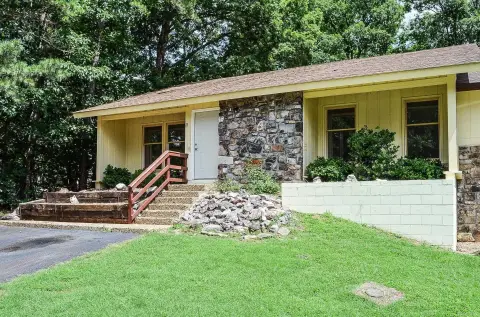
Move-in ready and fully furnished, this updated end-unit townhouse offers 3 bedrooms and 2 bathrooms with flexible living across two levels. The main level includes an open living and dining area with natural light, along with direct access to a private deck overlooking the trees. A main-level bedroom and full bath provide convenient single-level living. Downstairs, you’ll find two additional bedrooms, a full bath, a laundry area, and a versatile bonus room that can support a home office, hobby room, fitness space, or extra storage. A second private deck is accessible from the lower-level bedroom.
Located in Hot Springs Village, AR (Garland County), the home is set in a peaceful, wooded setting and offers access to community amenities listed in the remarks, including championship golf courses, lakes and marinas, pickleball and tennis, hiking and biking trails, fitness facilities, and restaurants.
A new roof was installed in July 2026, supporting a move-in ready presentation.
Located in Hot Springs Village, AR (Garland County), the home is set in a peaceful, wooded setting and offers access to community amenities listed in the remarks, including championship golf courses, lakes and marinas, pickleball and tennis, hiking and biking trails, fitness facilities, and restaurants.
A new roof was installed in July 2026, supporting a move-in ready presentation.
Key Highlights
- 3‑bedroom, 2‑bath end‑unit townhouse with 1,402 SF across two levels (1976 construction)
- Main‑level bedroom and full bath for convenient single‑level living
- Two private decks: one off the main level living/dining area and a second off the lower level
Financial Insights For Apartment 5plus
Simulate Cap Rate and NOI
NOI Build-Up
- Vacancy
- income lost from leasable area expected to sit empty during the year — subtracted from gross rent.
- EGI (Effective Gross Income)
- gross rent minus vacancy losses — the realistic income before paying operating costs.
- OpEx (Operating Expenses)
- recurring costs to operate the property (property tax, insurance, utilities, maintenance, management) — excludes financing and capital improvements.
- NOI (Net Operating Income)
- income a property generates after operating costs but before financing and taxes.
| Component | $ | $/SF |
|---|---|---|
| Gross rent | $16.8k | $12.00 |
| − Vacancy | −$1.1k | −$0.78 |
| EGI | $15.7k | $11.22 |
| − OpEx | −$7.1k | −$5.05 |
| NOI | $8.7k | $6.17 |
1,402 SF · lease $12.00/SF/yr · vacancy 6.50% · expense 45.00%
Alternative Uses
Best Use
Apartment 5plus
$123.6K
$108.2K – $144.2K
NOI $8,652 @ 7.0% cap · market cap 5.58%
Second Best
—
—
no second resolved use
Theoretical Best
Office A
$256.4K
$224.4K – $299.1K
NOI $17,948 @ 7.0% cap · market cap 11.58%
Zoning and permitted uses should be independently verified with authorities.
Property Analytics
Property Profile
Location Intelligence
Current Use


Frequently Asked Questions
What type of property is this?
Single family property - Updated 3-bedroom, 2-bath end-unit townhouse with two private decks and furnished, move-in ready condition.
Where is this single family property located?
The property is located at 53 Halcon Place Hot Springs Village, AR.
What is the asking price?
The asking price for this property is $155,000.
What are key features of this property?
This property features: 3‑bedroom, 2‑bath end‑unit townhouse with 1,402 SF across two levels (1976 construction); Main‑level bedroom and full bath for convenient single‑level living; Two private decks: one off the main level living/dining area and a second off the lower level