San Marcos Mixed-Use Investment
For Sale
$790,000
521 & 525 W Hutchison St, San Marcos, TX 78666
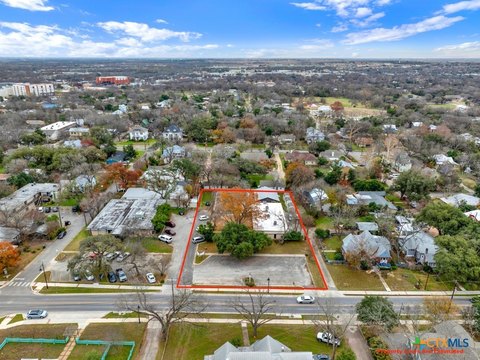
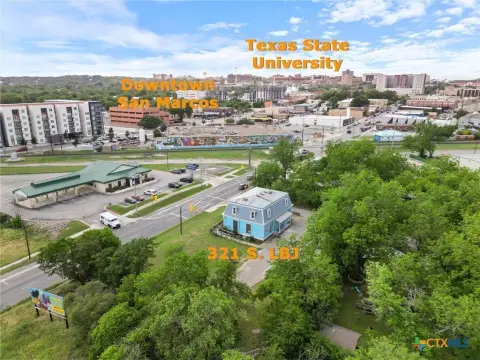
Two adjoining properties near Texas State University and Historic Downtown.
Property Size5,295 SF
Price / SF$149.20
Days on Market219

Ask AI about this property
Review the available facts, identify missing information and prepare questions for the agent.
Property Features for 521 & 525 W Hutchison St
General Information
Standard status
Active
Size
5,295 SF
Building Details
Year Built
2010
Listing Agency:
Monica & Company Real Estate
Listed By:
Michael Nolen · License #0621420
(254) 931-0102
Source:
Mlsluxurygroup
Added: Mar 11
Changed: Oct 9
Last Checked: Oct 15 at 12:39AM
Displayed information is deemed reliable but is not guaranteed and should be independently verified. All listing content including descriptions, pricing, images are the copyrighted material of Monica & Company Real Estate
Investment Insights
Based on property information with market context.
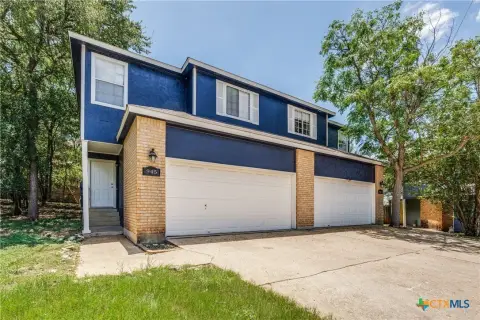
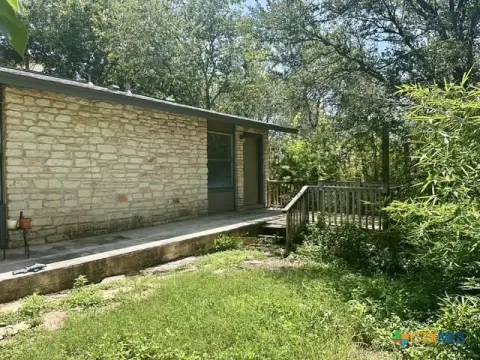
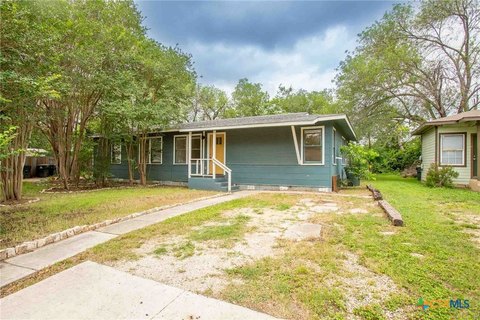
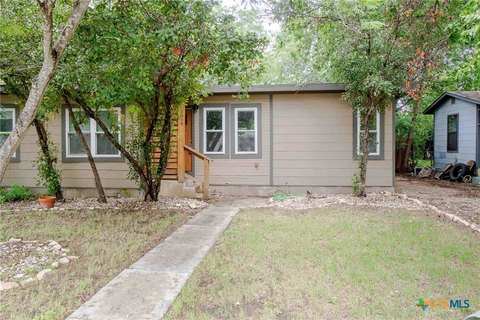
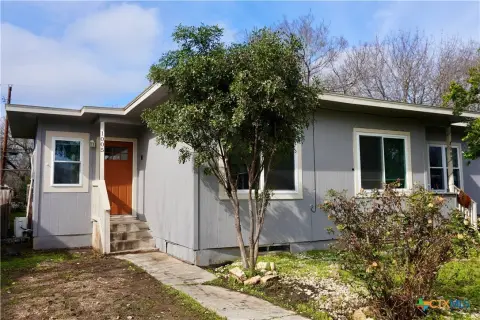
This offering features two adjoining properties situated in the heart of San Marcos, within walking distance of Texas State University and the Historic Downtown Square. The package includes a commercial building at 521 W Hutchison St and a multifamily property at 525 W Hutchison St, offering a combination of rental income and long-term potential. The commercial building, zoned Mixed Use, provides adaptable office or retail space with street visibility, convenient parking, and flexible layouts. It is suited for professional services, creative businesses, or boutique retail users. The multifamily property includes two rental units. Unit A features 3 bedrooms and 2 bathrooms and has been historically leased for $2,100 per month. Unit B features 5 bedrooms and 3 bathrooms, equipped with two refrigerators and two washer/dryer sets, and has been historically leased for $2,900 per month. Both units have demonstrated strong occupancy, appealing to students and young professionals seeking proximity to campus and downtown amenities. The properties at 521–525 W Hutchison St represent an investment with diverse income streams, walkable convenience, and redevelopment potential under the city’s downtown zoning. This offering is suitable for investors seeking dependable returns or owner-users looking for a mixed-use asset.
Key Highlights
- Prime location: Walking distance to Texas State University and the Historic Downtown Square.
- Two adjoining properties: Commercial building (521 W Hutchison St) and multifamily property (525 W Hutchison St).
- Steady rental income: Multifamily property with two historically well‑leased units.
Financial Insights
Estimated NOI and Cap Rate
NOI / Yr
$71,483
Cap Rate
9.05%
Suggested Prices Based on Cap Rates
Cap Rate 5%
$1,429,660
$1.4M
Cap Rate 7%
$1,021,186
$1.0M
Cap Rate 9%
$794,256
$794.3K
Market Conditions
NOI Build-Up for 5,295 SF
Gross rent
$127.1K $24.00/SF
− Vacancy
−$12.7K −$2.40/SF
EGI
$114.4K $21.60/SF
− OpEx
−$42.9K −$8.10/SF
NOI
$71.5K $13.50/SF
Area
Hays County, TX
Vacancy
10.00%
Lease Rate
$24.00 /SF/Yr
Expense Ratio
37.50%
Simulate Cap Rate and NOI
Suggested Prices Based on Cap Rates
Cap Rate 5%
$1,429,660
Cap Rate 7%
$1,021,186
Cap Rate 9%
$794,256
Alternative Uses
Best Use
Multifamily LT 5
$1.27M
$1.11M – $1.48M
NOI $88,790 @ 7.0% cap · market cap 11.24%
Second Best
Apartment 5plus
$1.16M
$1.01M – $1.35M
NOI $81,168 @ 7.0% cap · market cap 10.27%
Theoretical Best
Office A
$2.21M
$1.94M – $2.58M
NOI $154,941 @ 7.0% cap · market cap 19.61%
Zoning and permitted uses should be independently verified with authorities.
How Realmo checks its estimates
Property Analytics
Unlock full access to Insights
Subscribe to Realmo Intelligence
Open Analytics
Current Use
Location Intelligence
Trade Area within ½ mile
1,654
Businesses Nearby
Explore this area
Business Placement
Demographics for 78666, TX
86,584
Population
36,354
Households
2.4
Avg Household Size
27
Median Age
35%
College-Educated
89%
High-School Grad
192.4 sq mi
ZIP Area
450
Density / Sq Mi
$55,478
Median Household Income
$25,890
Median Earnings
$1,294
Median Rent
$271,900
Median Home Value
Check the figures for this property
Cap Rate, Value Estimation, Potential NOI and more
View Realmo Analytics
Market
Vacancy Rate% for Multifamily in South region




Frequently Asked Questions
What type of property is this?
Mixed-use property - Two adjoining properties near Texas State University and Historic Downtown.
Where is this mixed-use property located?
The property is located at 521 & 525 W Hutchison St San Marcos, TX.
What is the asking price?
The asking price for this property is $790,000.
What are key features of this property?
This property features: Prime location: Walking distance to Texas State University and the Historic Downtown Square.; Two adjoining properties: Commercial building (521 W Hutchison St) and multifamily property (525 W Hutchison St).; Steady rental income: Multifamily property with two historically well‑leased units.