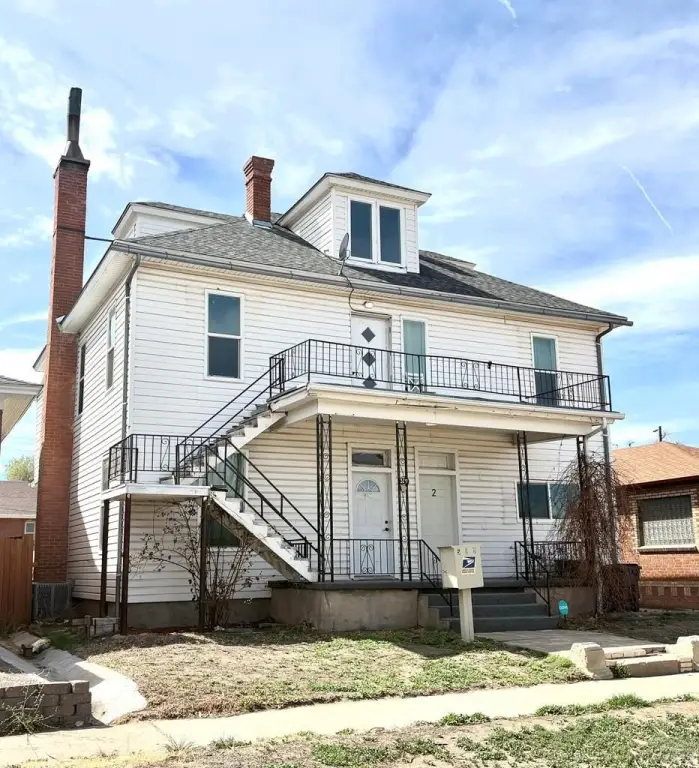
Remodeled
For Sale
$555,000
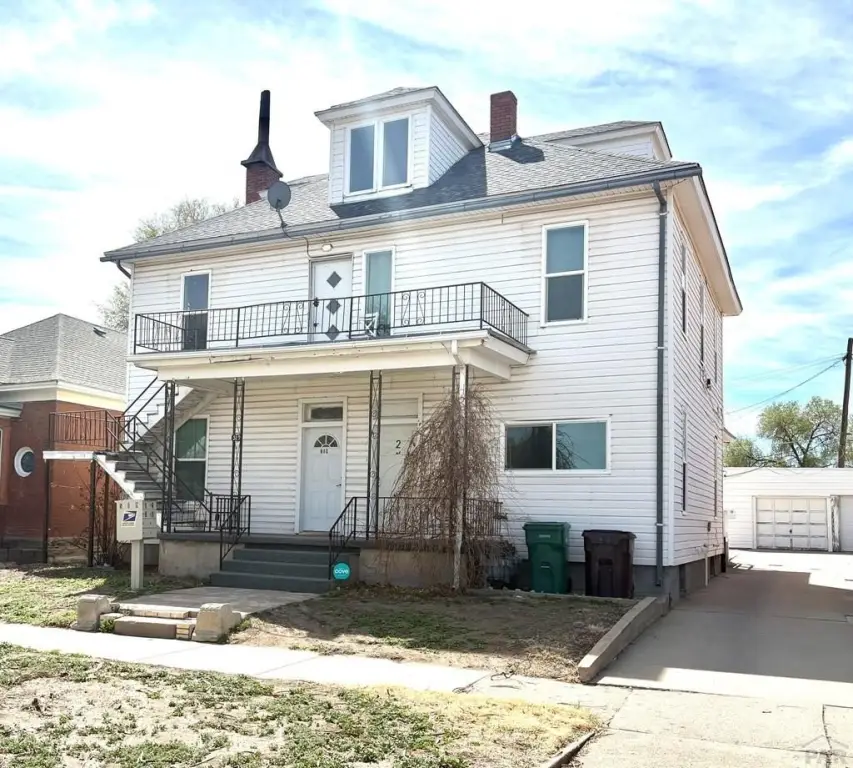
519 E Evans Ave, Pueblo, CO 81004
Residential Income, Pueblo, CO
Property Size4,394 SF
Lot Size0.13 Acres
Price / SF$126.31
Days on Market204
Property Features for 519 E Evans Ave
General Information
Property type
Residential Multi Family
Property subtype
Quadruplex
Zoning
R-3
Bedrooms
6
Bathrooms
4
Full bathrooms
4
Rooms
Bedroom 4, Bedroom 2, Bedroom 6, Bathroom 4, Bathroom 3, Bedroom 3, Bedroom 5, Bedroom 1, Bathroom 1, Bathroom 2
Parking
1
Parking features
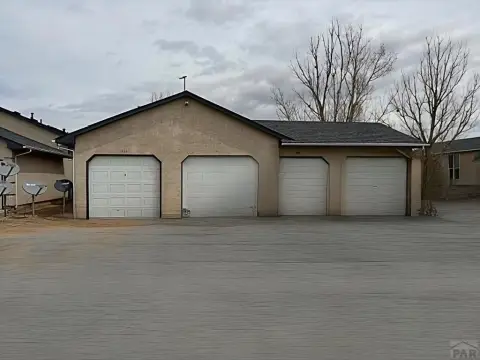
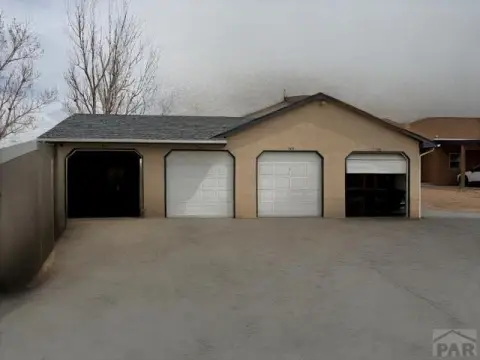
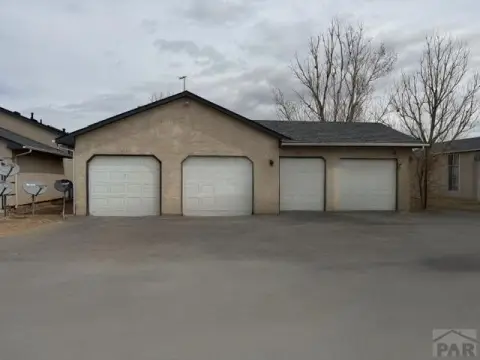
Garage - Detached
Window features
Vinyl Frames
Patio and Porch features
Porch
Basement
Full
Appliances
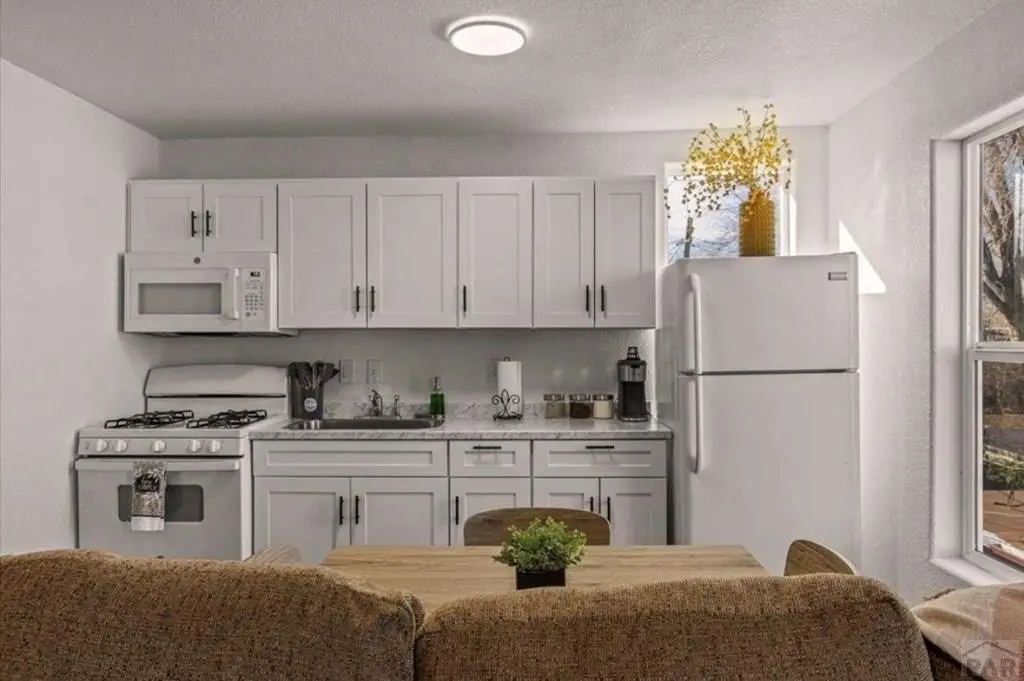
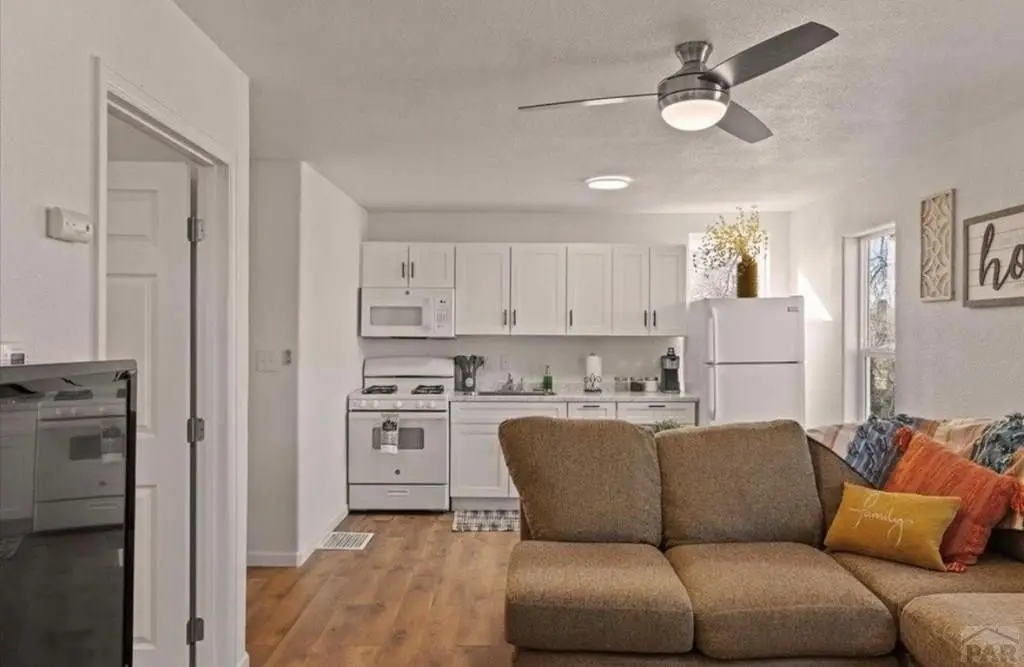
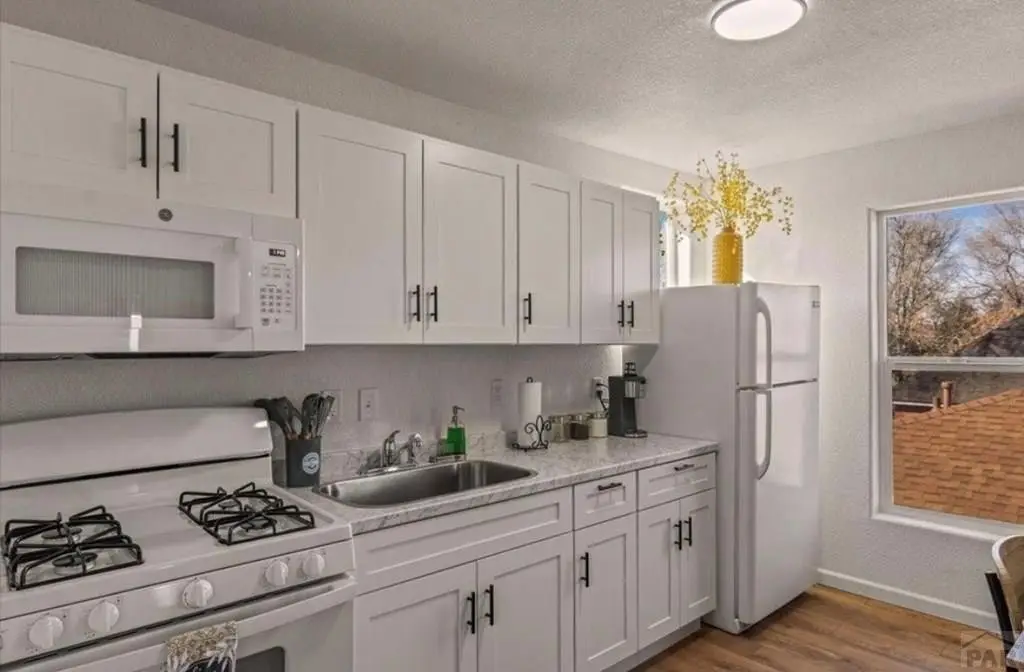
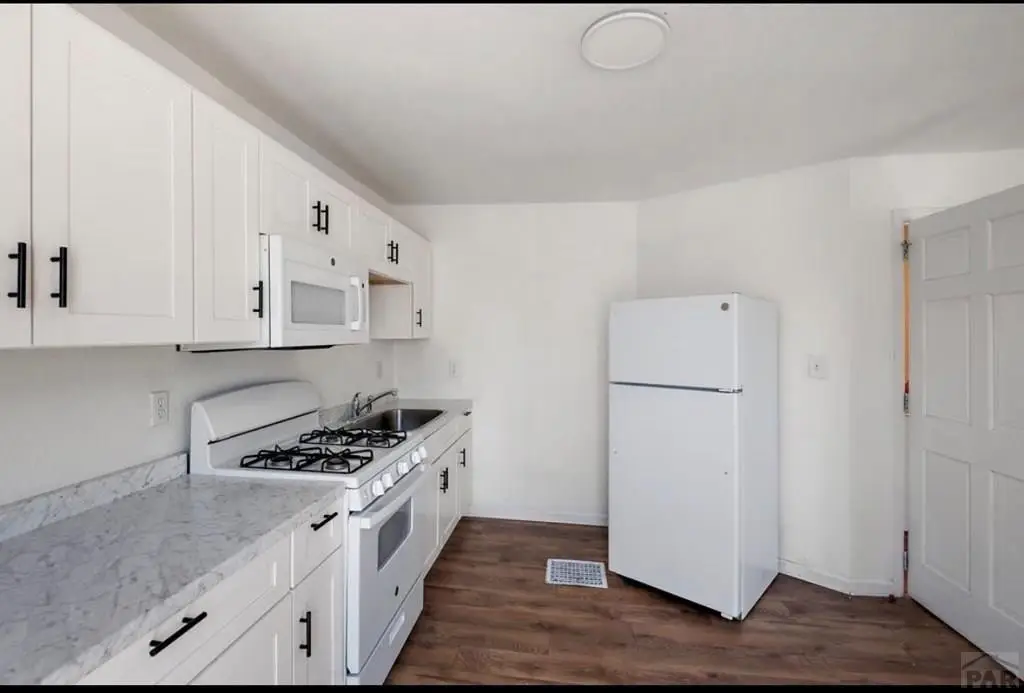
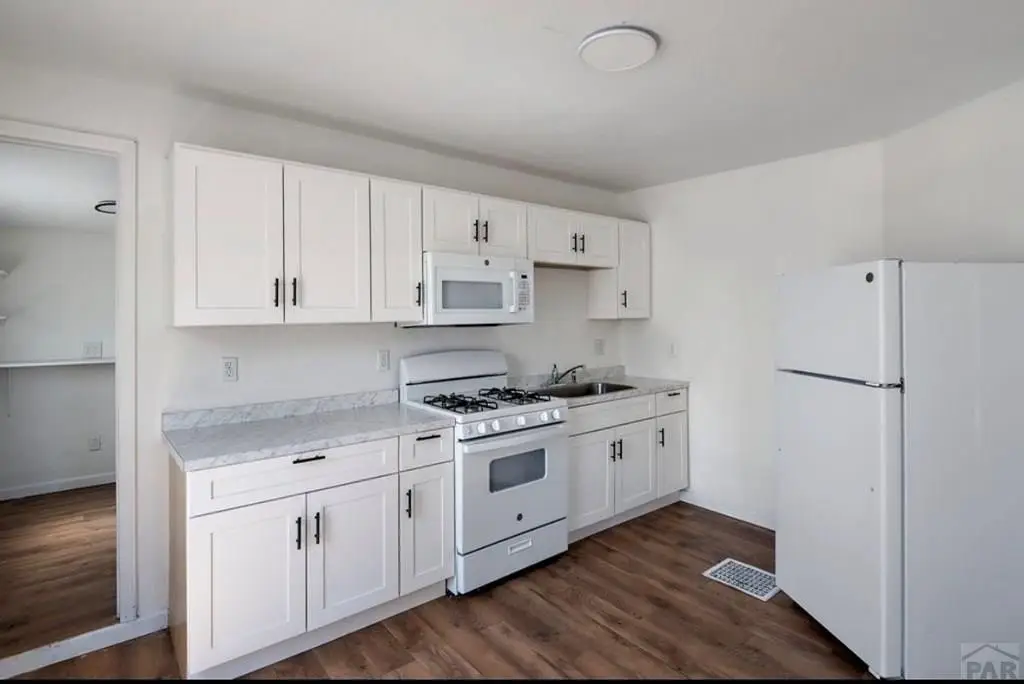
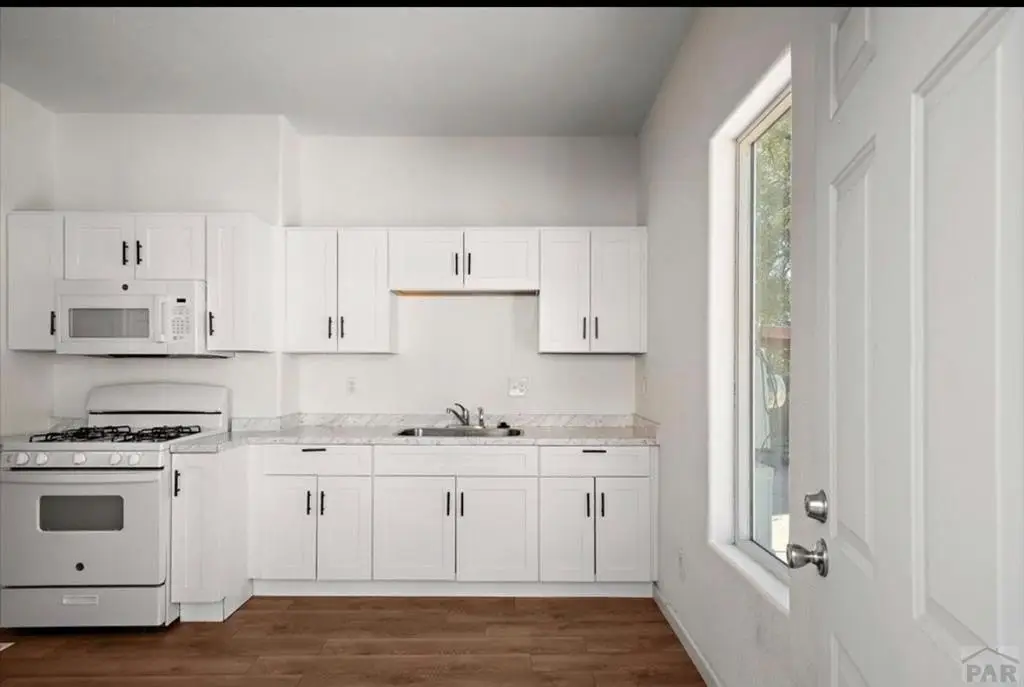
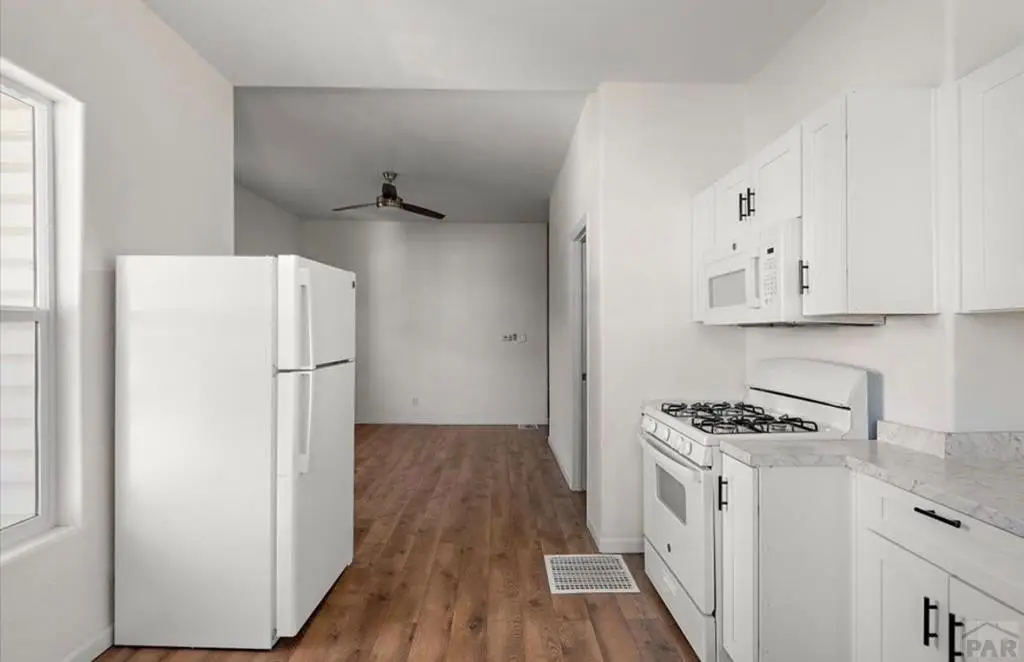
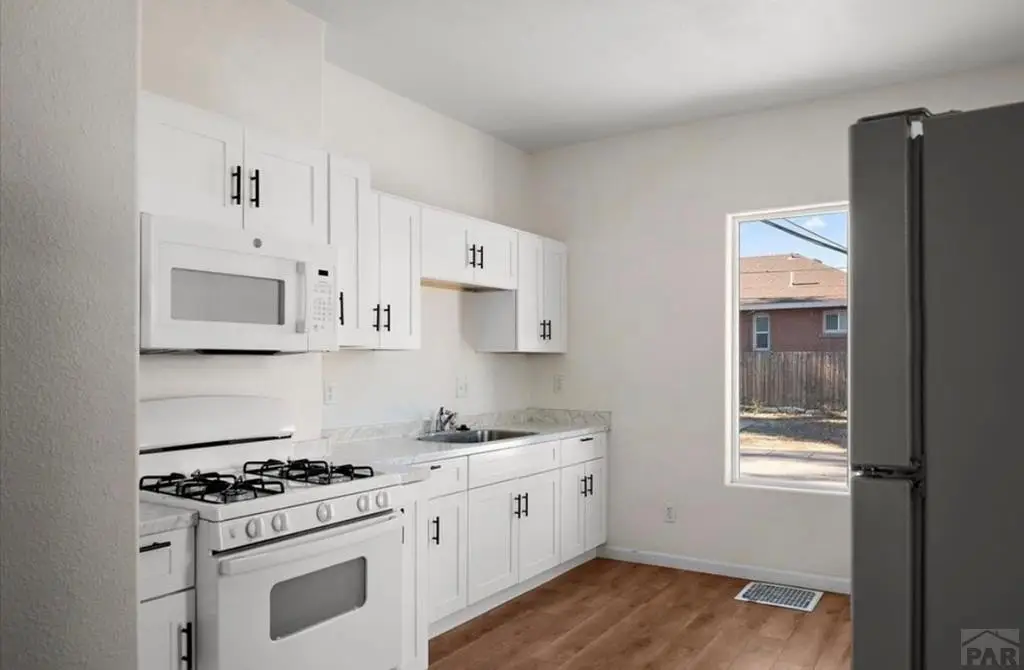
Refrigerator-All, Gas Range-All, Microwave Built-In-All
Subdivision
Central High School
Elementary school
60
Middle school
60
High school
60
Standard status
Active
APN
1501205022
Size
4,394 SF
Lot size
0.13 Acres
Taxes and HOA fees
Tax Year
2025
Tax Description
LOT B + SELY 10.5 FT OF LOT C GRAHAMS SUB OF LOTS 25 TO 32 OF BLK 165 IN COLORADO COAL + IRON COMPANYS ADDITION NO 1
Tax Annual Amount
2119
Legal Description
LOT B + SELY 10.5 FT OF LOT C GRAHAMS SUB OF LOTS 25 TO 32 OF BLK 165 IN COLORADO COAL + IRON COMPANYS ADDITION NO 1
Utilities
Sewer type
Public Sewer
Heating system
Forced Air, Natural Gas
Cooling system
Central Air
Water source
Public
Building Details
Year built
1903
Floors in Building
3
Number of units
4
Building materials
Frame, Plastic Plumbing
Roof type
Composition
Listing Agency:
Sorella Real Estate
(719) 621-4778
Listed By:
Your Hometown Team
(719) 214-3733
Added: Mar 17
Changed: Sep 17
Last Checked: Oct 6 at 10:06PM
MLS# 238699
Copyright © 2026 Pueblo Association of Realtors. All rights reserved. All information provided by the listing agent/broker is deemed reliable but is not guaranteed and should be independently verified.
Investment Insights
Based on property information with market context.
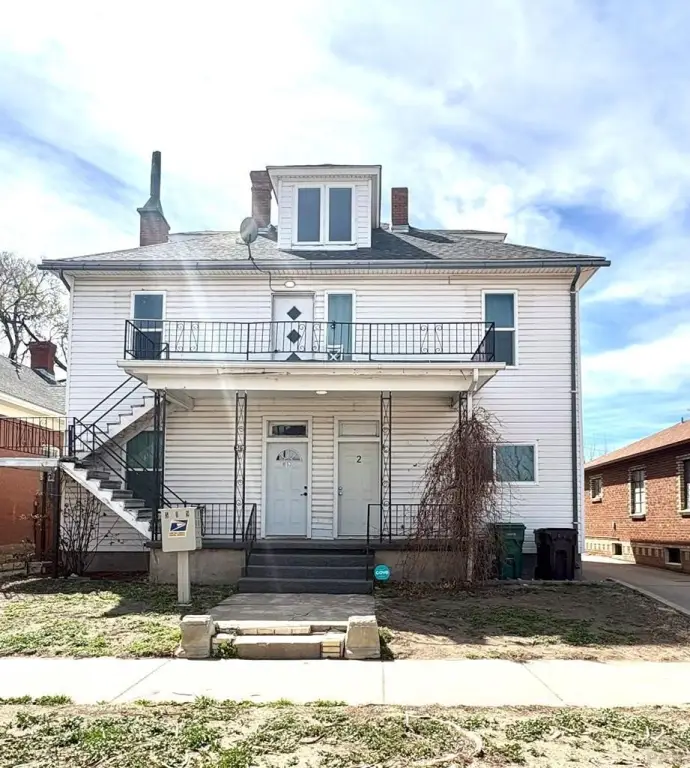
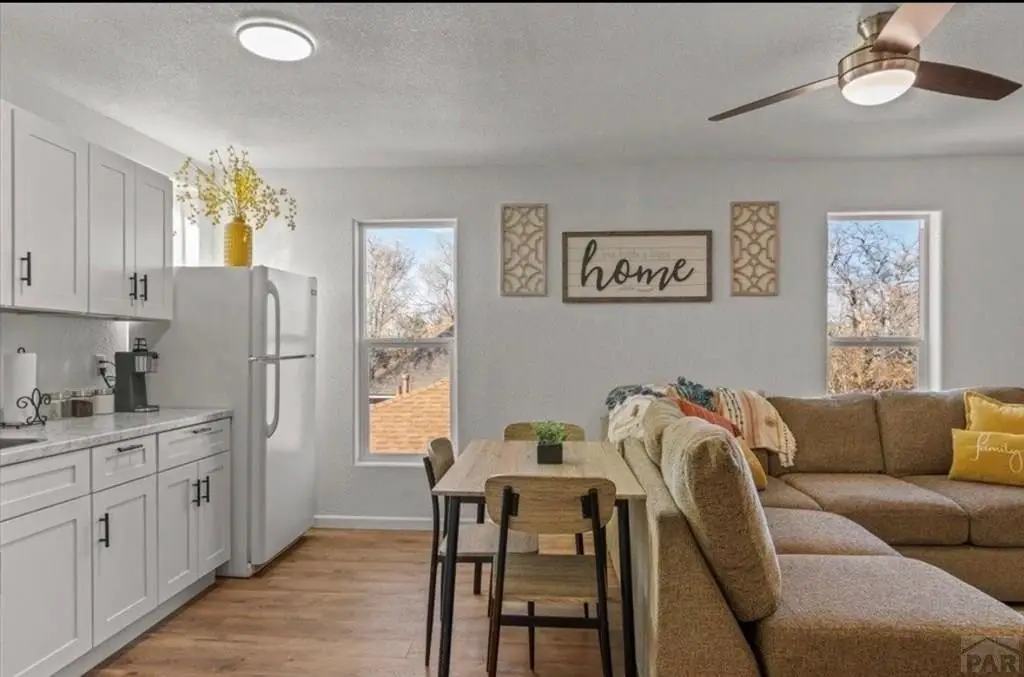
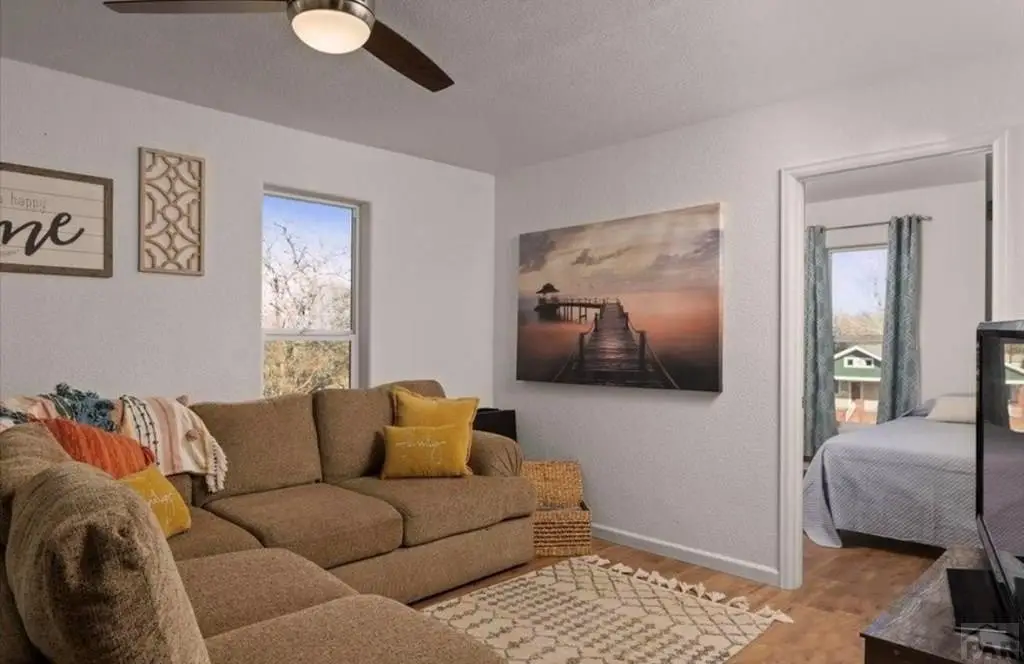
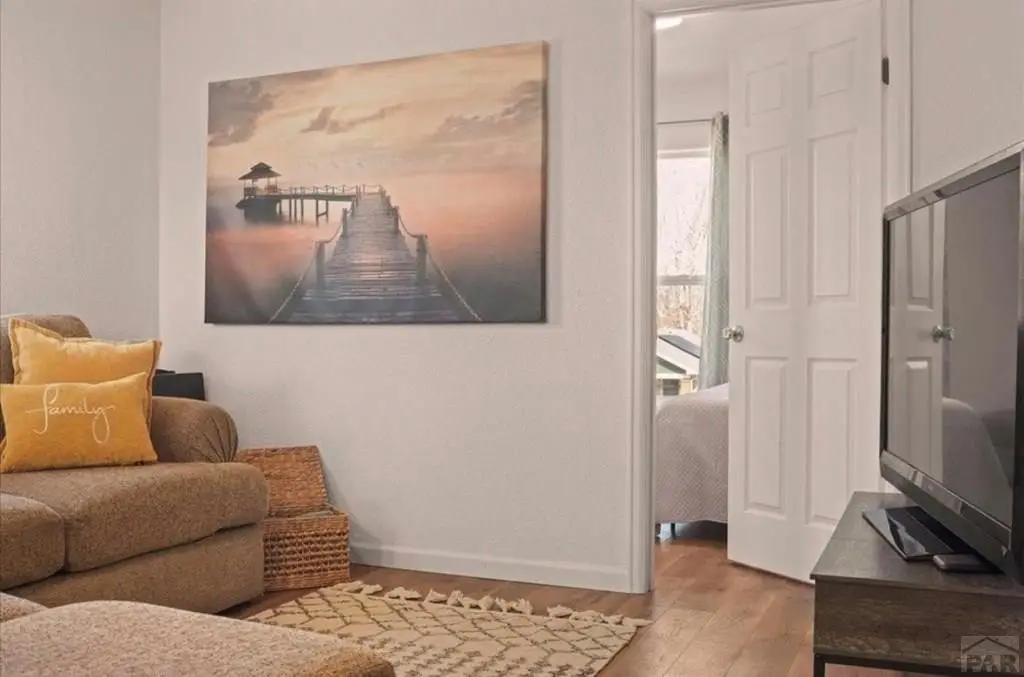
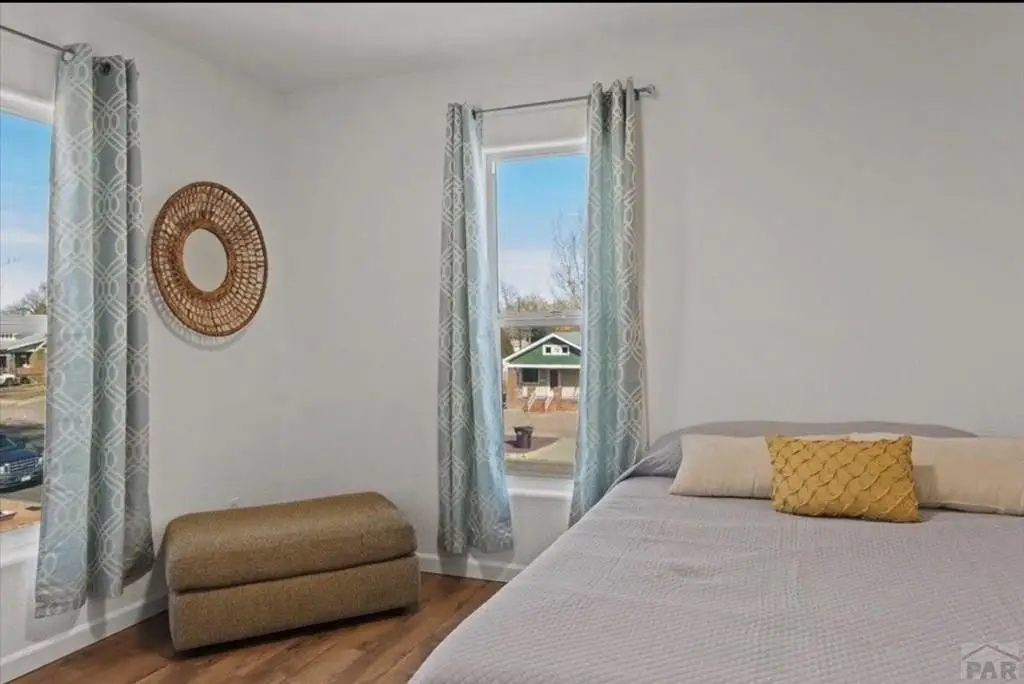
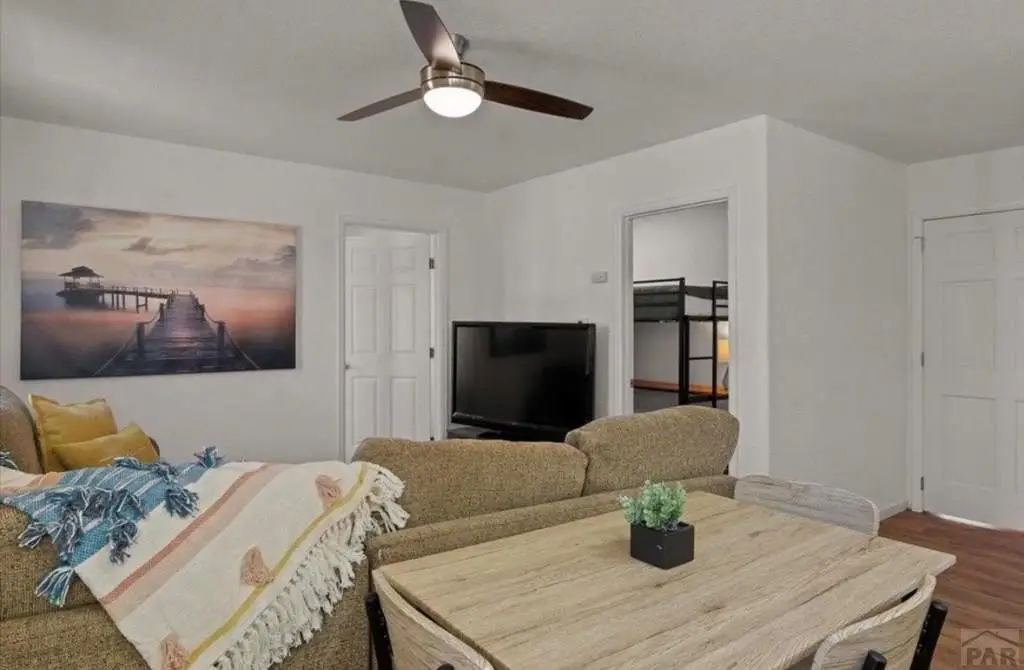
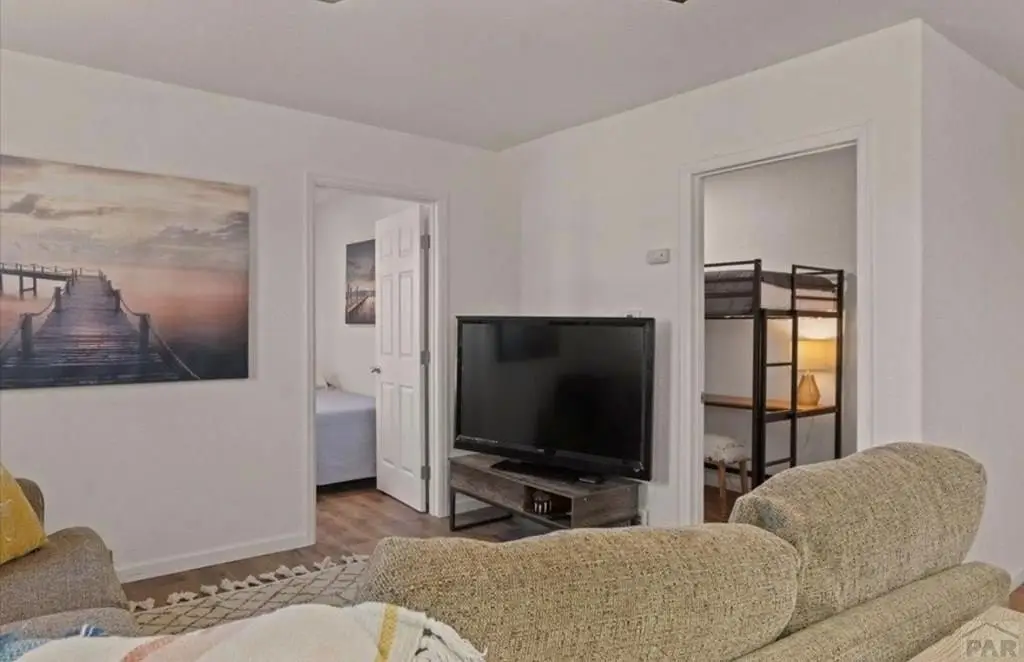
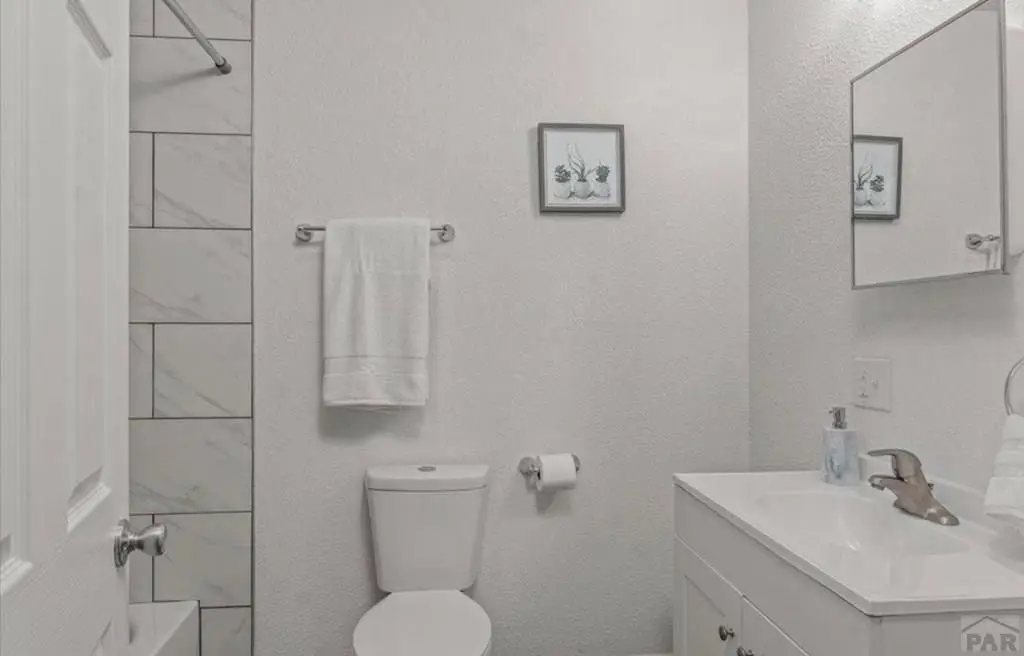
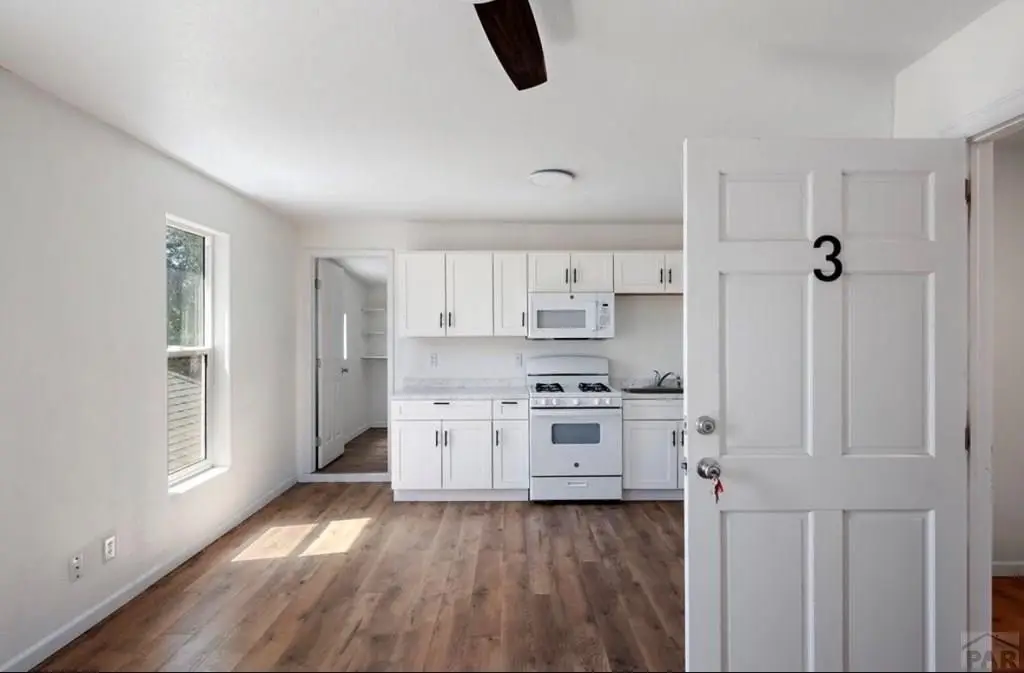
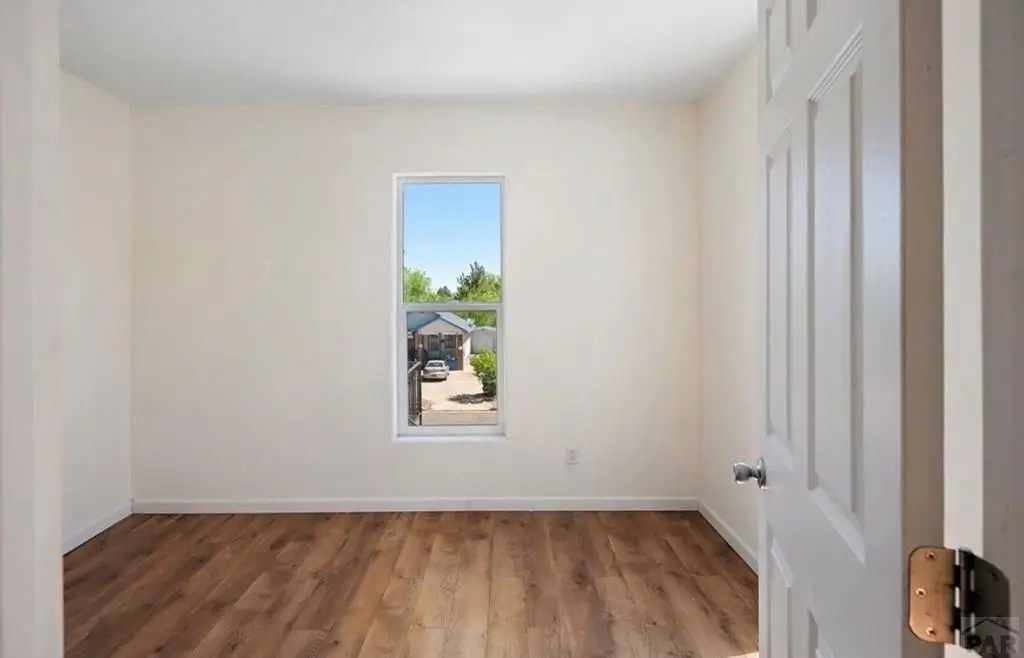
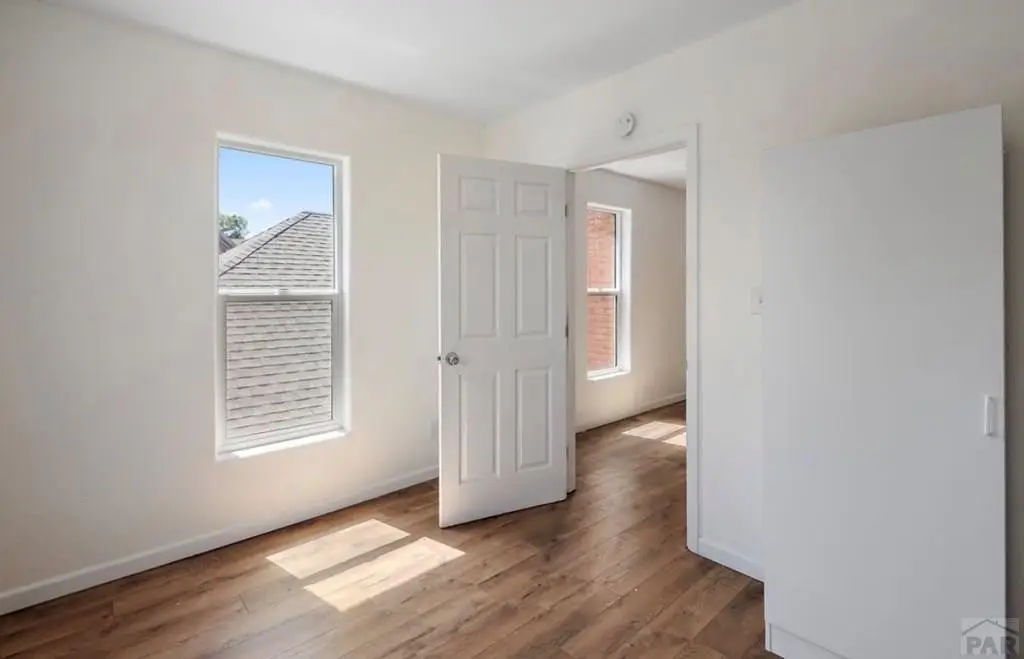
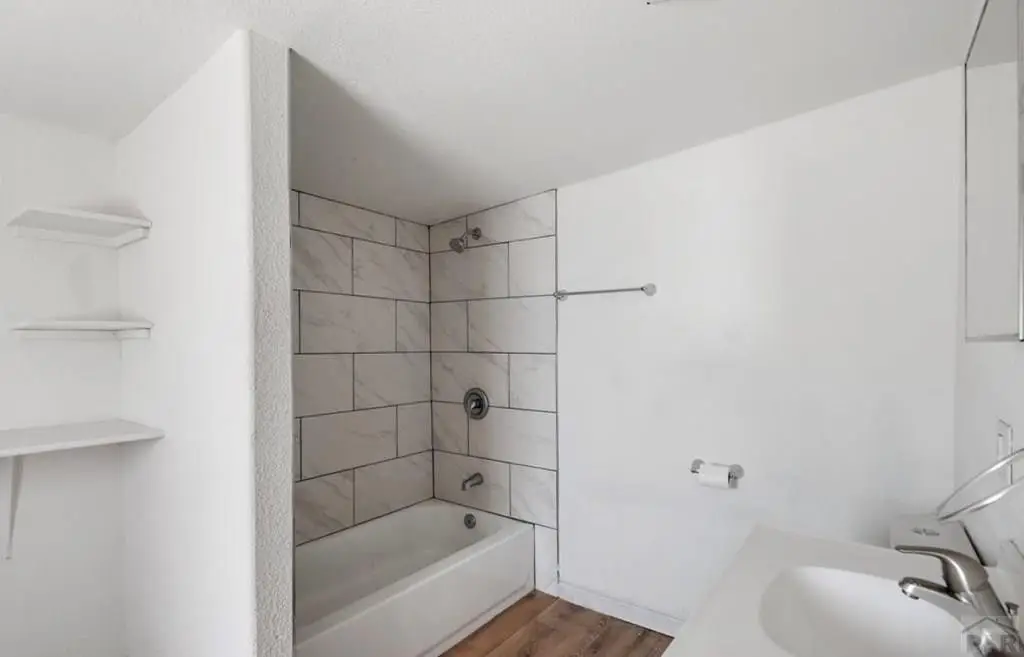
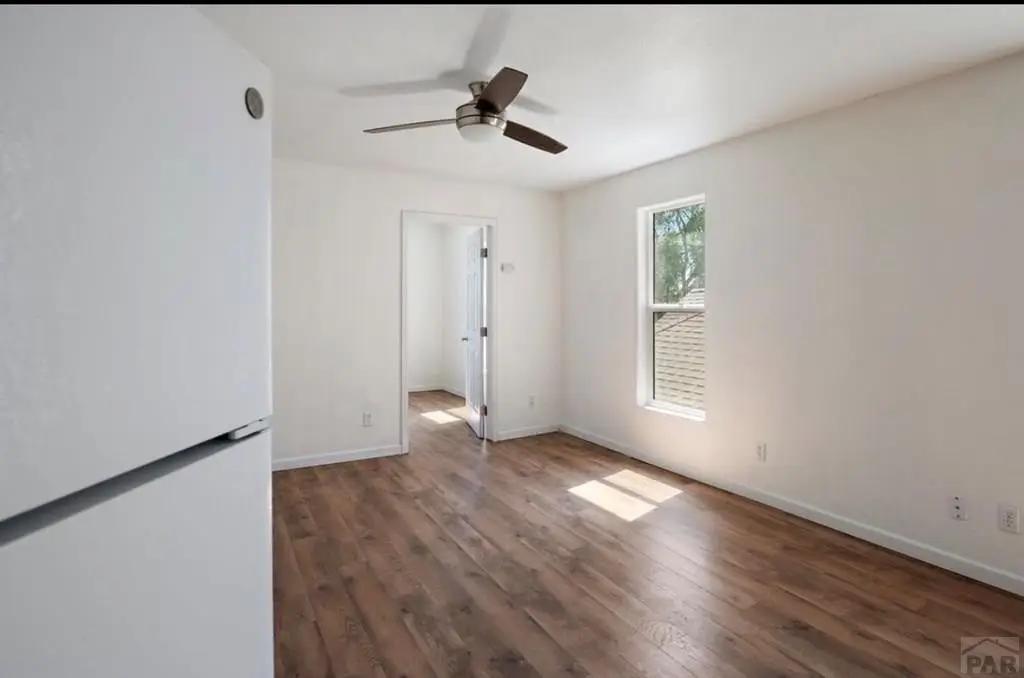
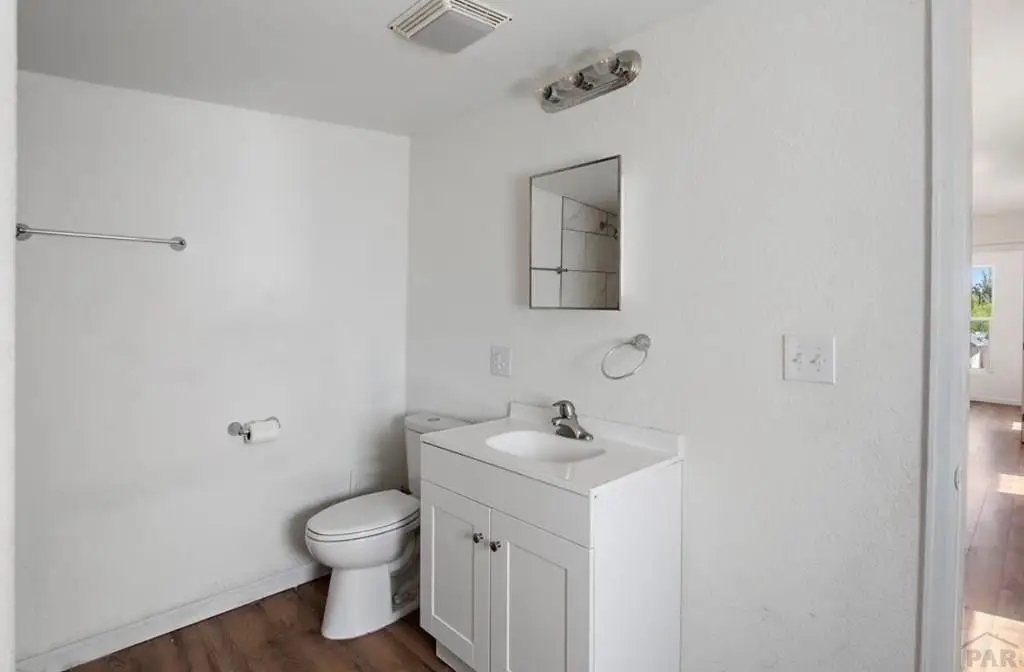
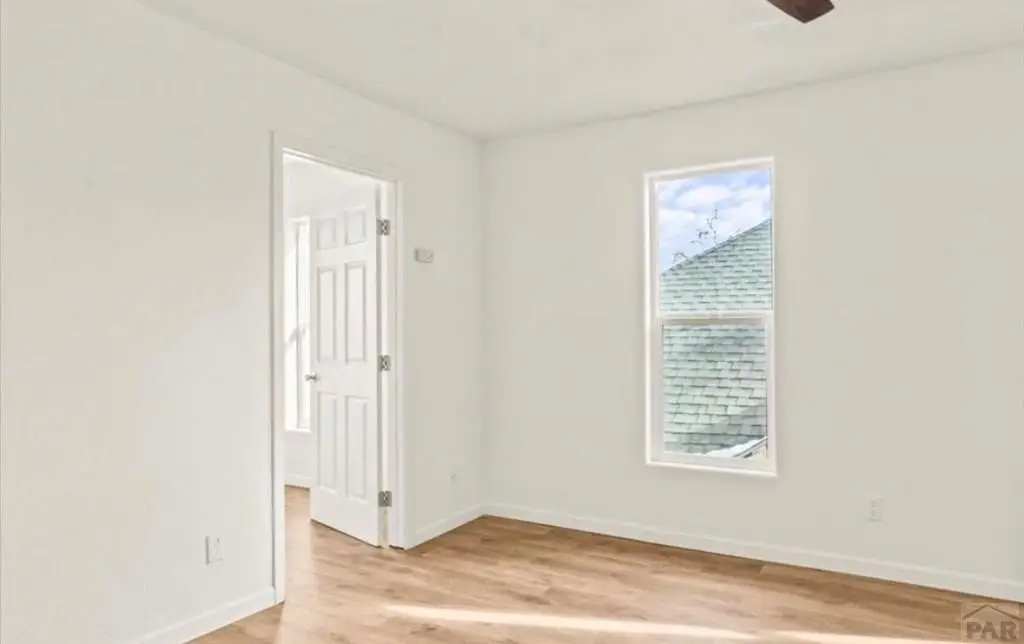
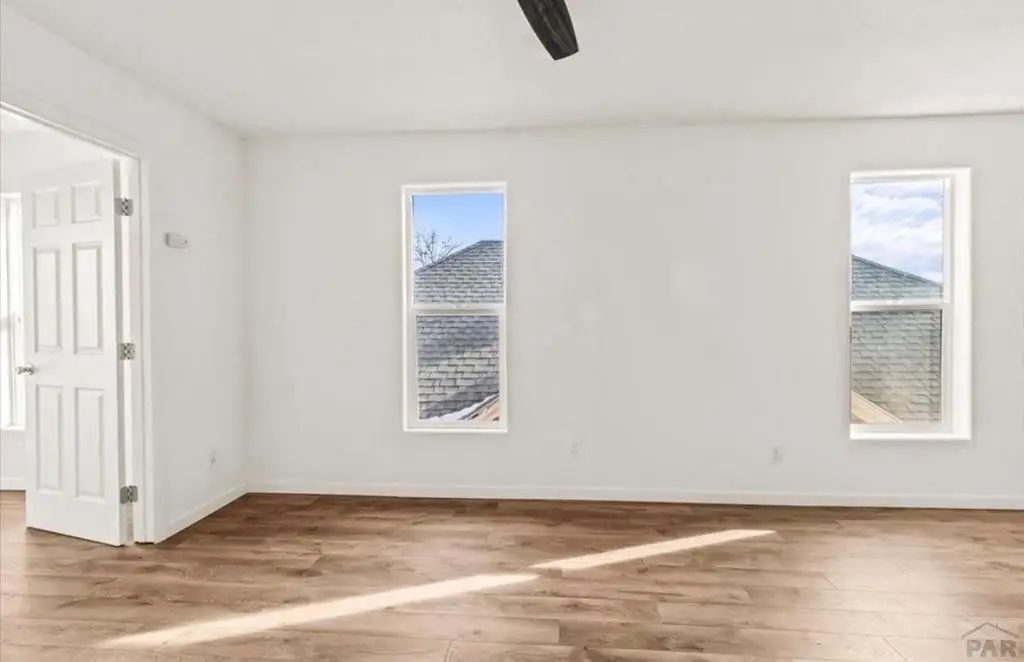
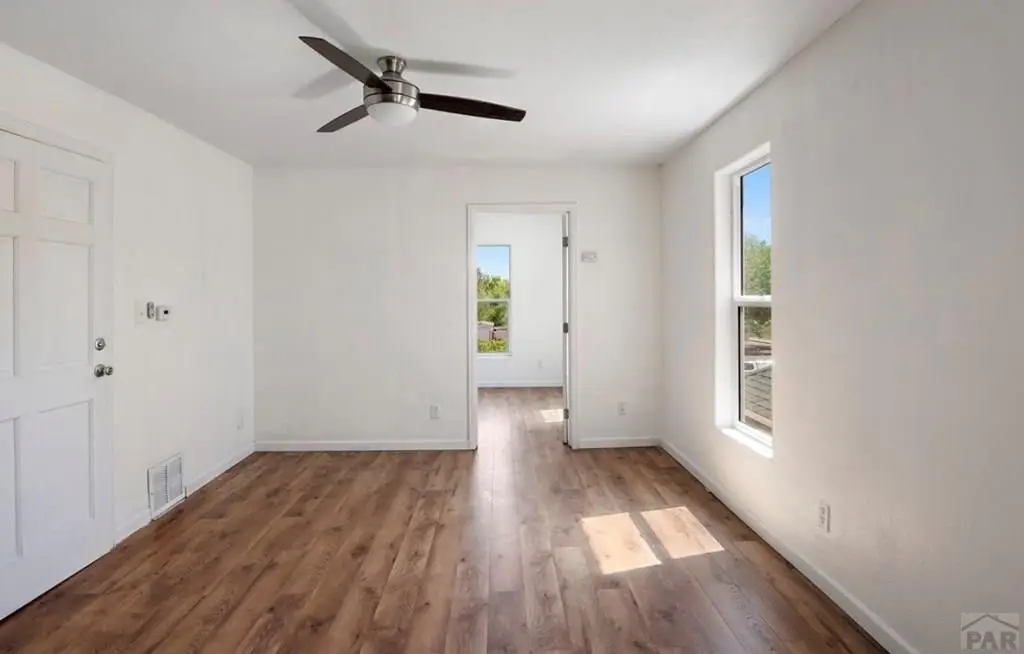
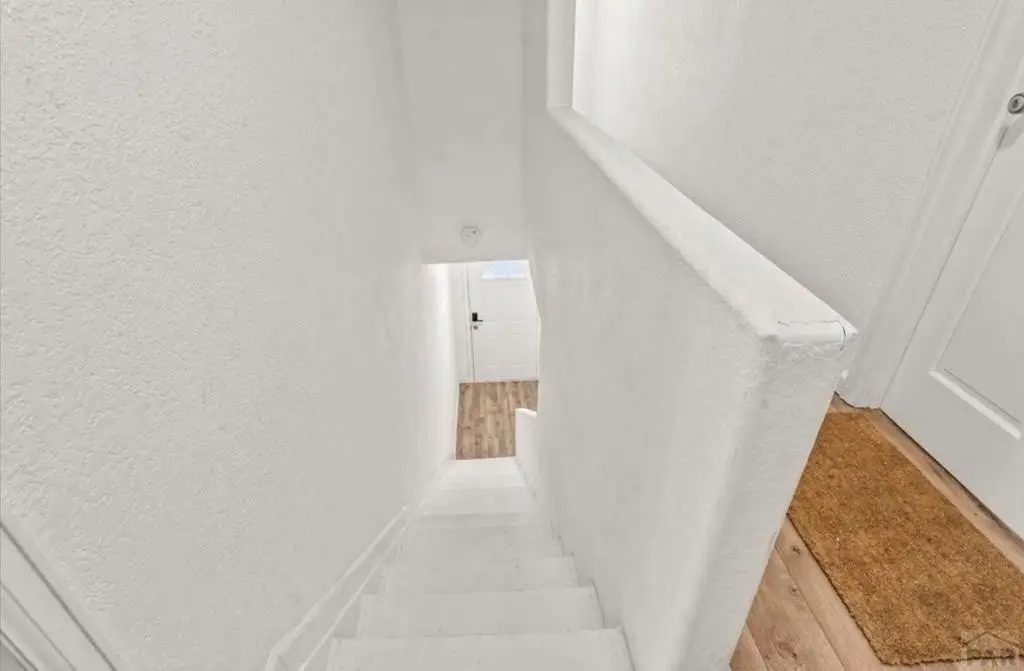
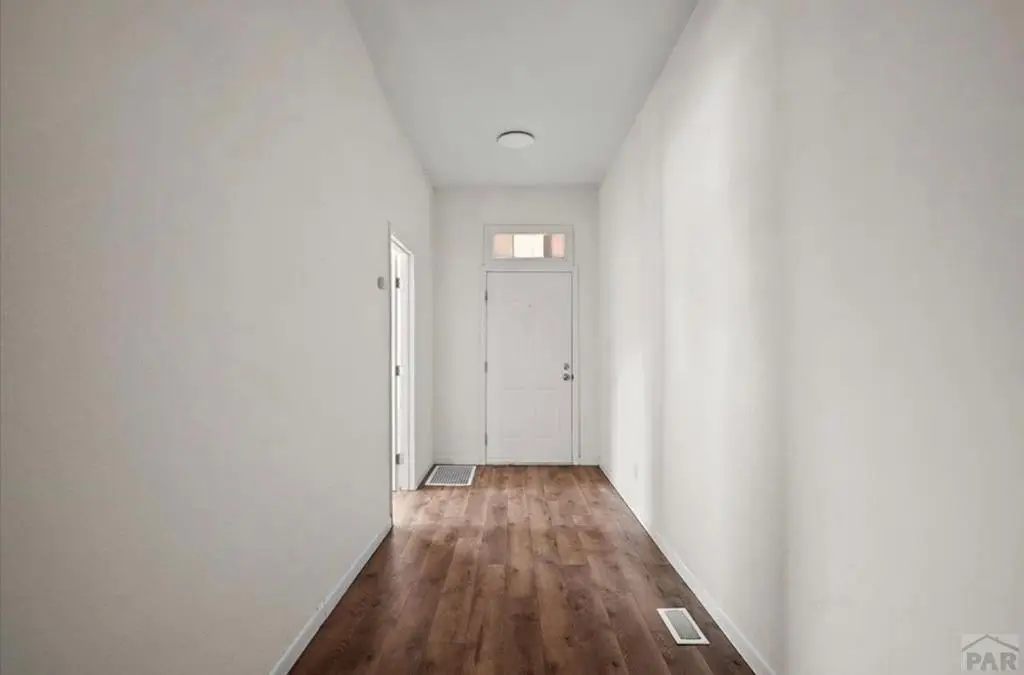
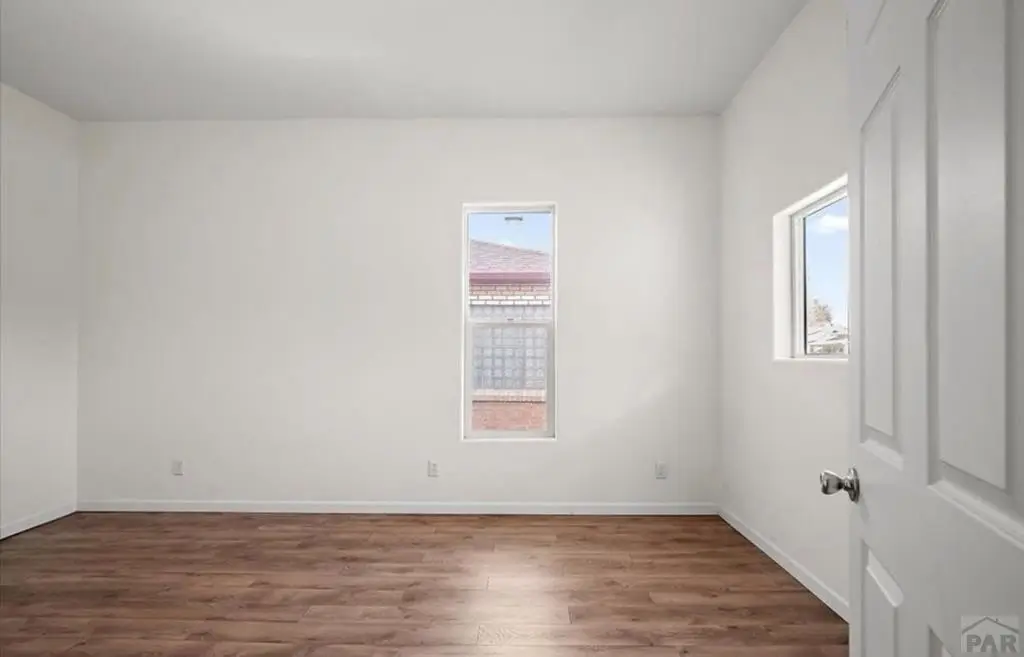
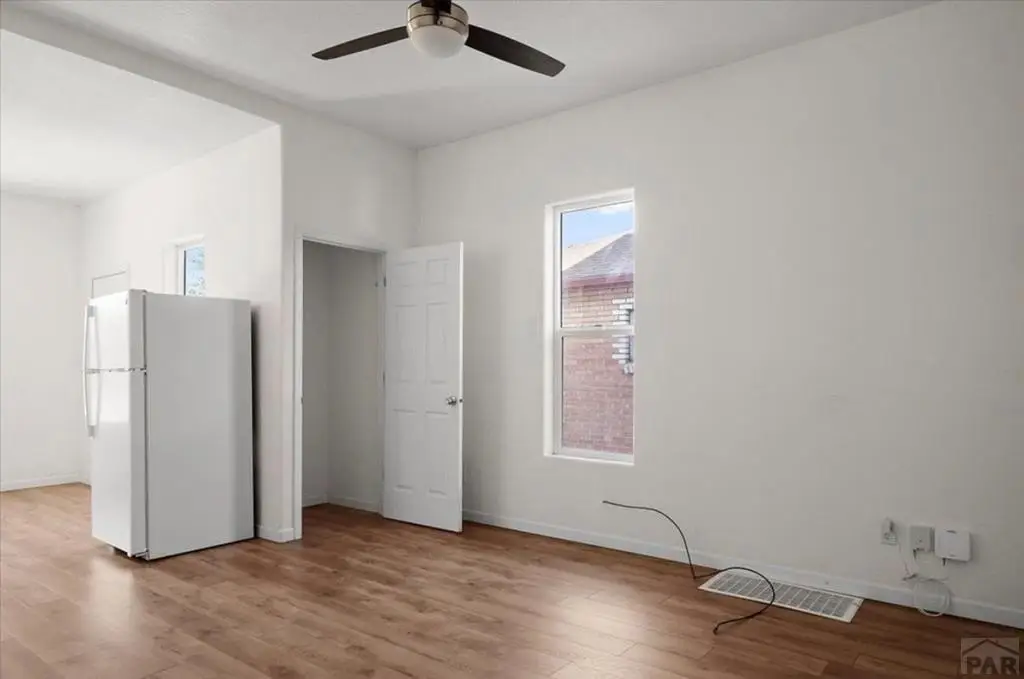
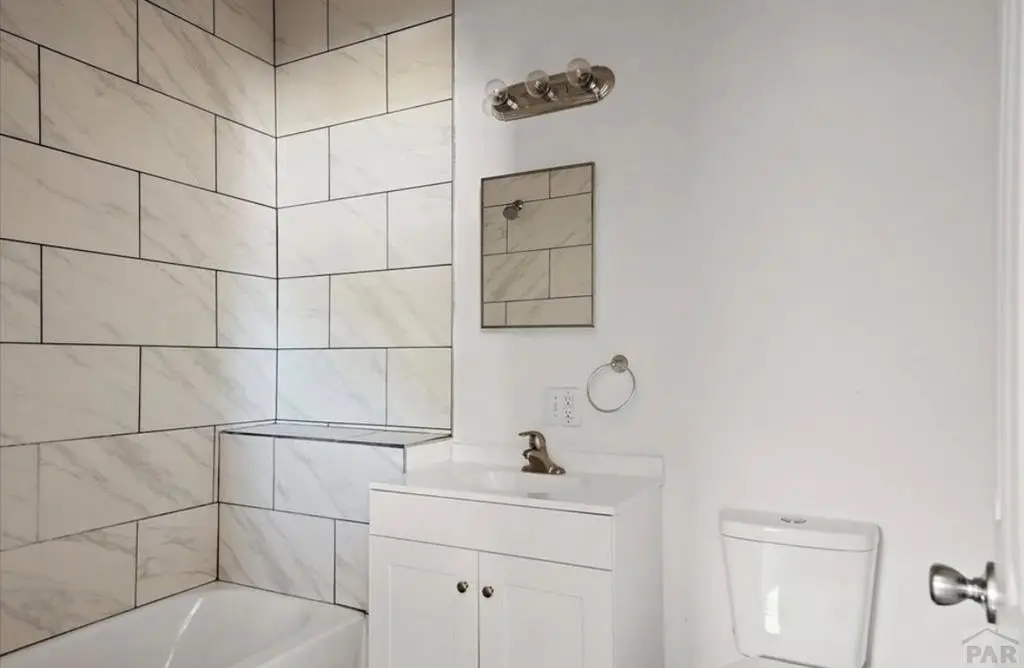
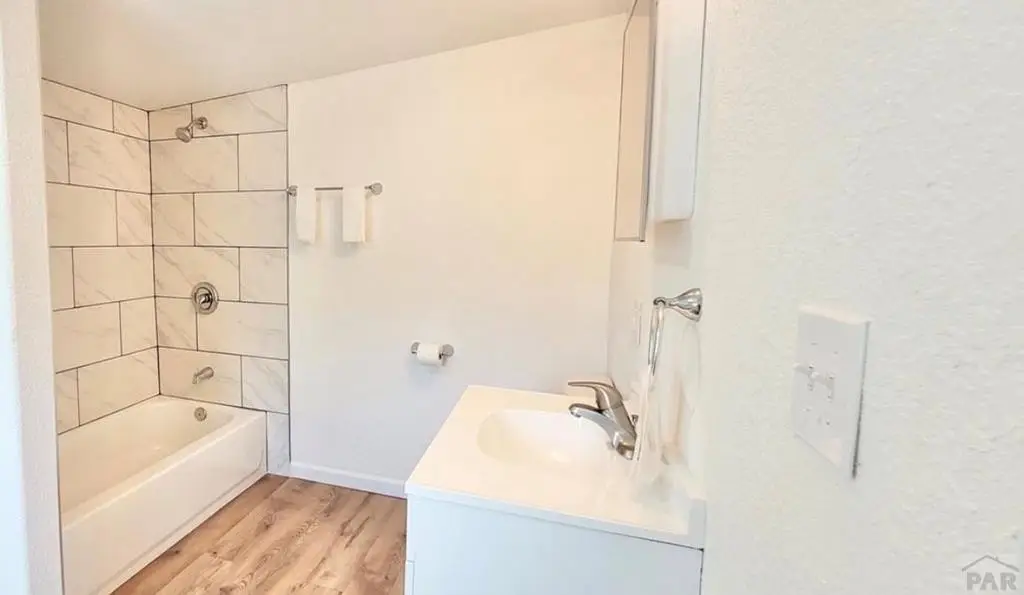
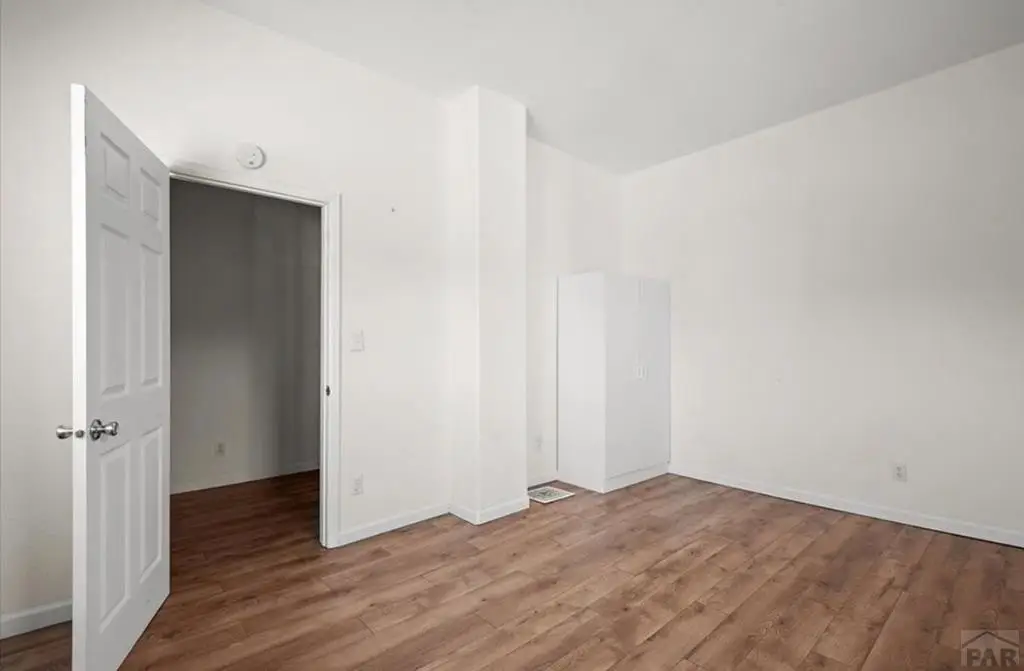
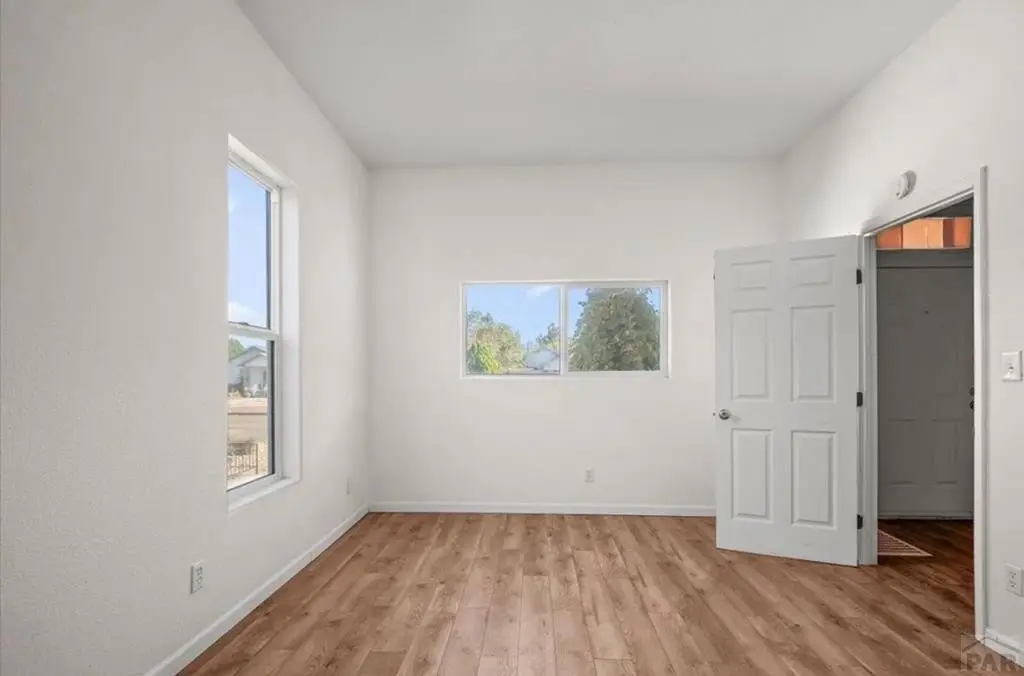
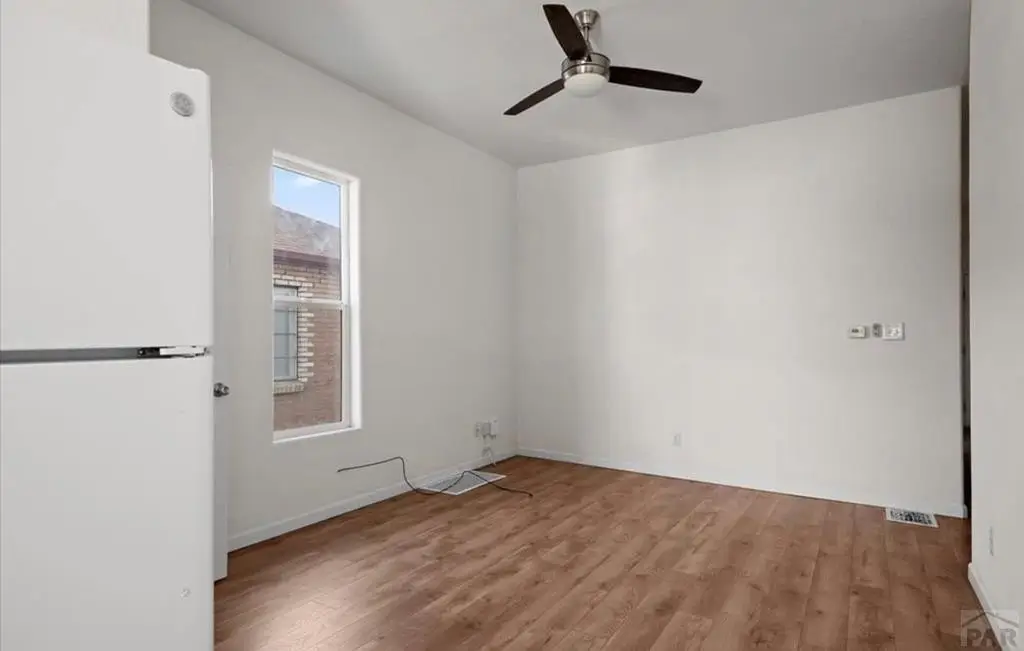
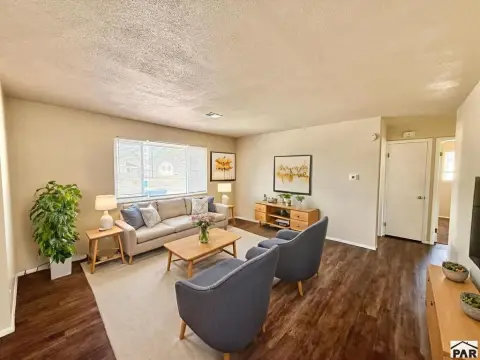
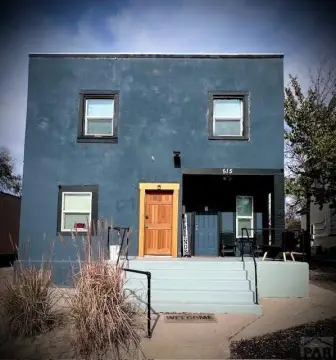
This remodeled quadplex at 519 E Evans Ave in Pueblo contains 4,394 square feet across four units, with a mix of 1-bedroom and 2-bedroom layouts. Each residence has an open-concept design, 9-foot ceilings, laminate flooring, modern kitchen appliances, and bathrooms finished with contemporary tile and vanities. Large dual-pane Low-E vinyl windows provide natural light, while updated plumbing, electrical, roofing, and furnaces support the property’s recent renovation work.
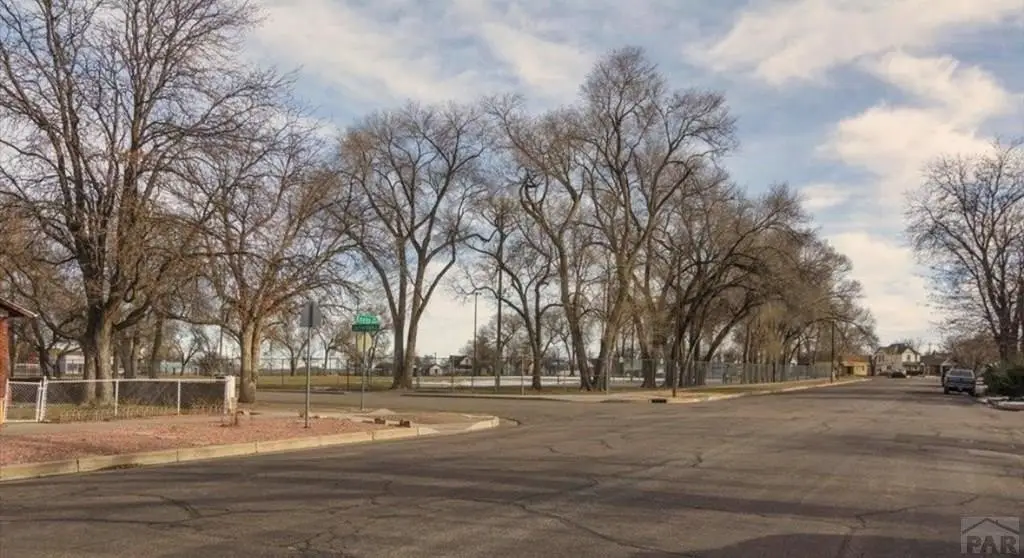
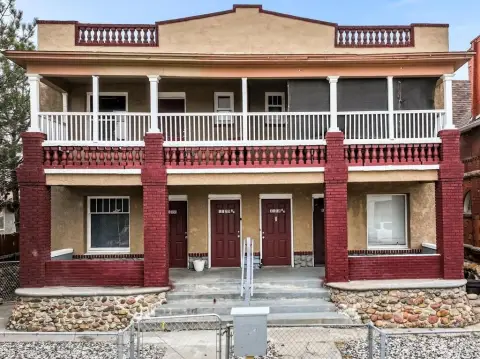
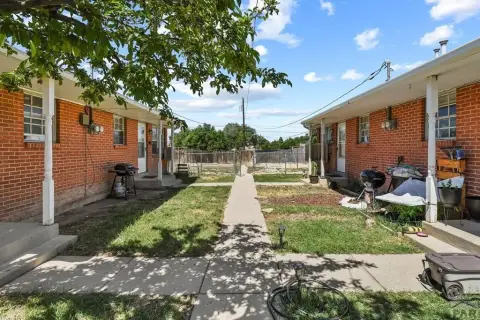
The 0.13-acre property includes 1 dedicated rear-access parking space per unit, additional street parking, a detached garage, and a porch. Building systems include forced-air heating with natural gas, central air conditioning, public water, and public sewer. Constructed in 1903, the property is zoned R-3 and includes optional upstairs storage that may be rented separately.
The 0.13-acre property includes 1 dedicated rear-access parking space per unit, additional street parking, a detached garage, and a porch. Building systems include forced-air heating with natural gas, central air conditioning, public water, and public sewer. Constructed in 1903, the property is zoned R-3 and includes optional upstairs storage that may be rented separately.
Key Highlights
- 4,394‑square‑foot remodeled quadplex with four residential units
- Unit mix includes 1‑bedroom and 2‑bedroom residences
- Open‑concept layouts with 9‑foot ceilings and laminate flooring
Financial Insights
Estimated NOI and Cap Rate
NOI / Yr
$35,966
Cap Rate
6.48%
Suggested Prices Based on Cap Rates
Cap Rate 5%
$719,320
$719.3K
Cap Rate 7%
$513,800
$513.8K
Cap Rate 9%
$399,622
$399.6K
Market Conditions
NOI Build-Up for 4,394 SF
Gross rent
$53.3K $12.12/SF
− Vacancy
−$1.9K −$0.43/SF
EGI
$51.4K $11.69/SF
− OpEx
−$15.4K −$3.51/SF
NOI
$36.0K $8.19/SF
Area
Pueblo, CO
Vacancy
3.52%
Lease Rate
$12.12 /SF/Yr
Expense Ratio
30.00%
Simulate Cap Rate and NOI
Suggested Prices Based on Cap Rates
Cap Rate 5%
$719,320
Cap Rate 7%
$513,800
Cap Rate 9%
$399,622
Alternative Uses
Best Use
Multifamily LT 5
$513.8K
$449.6K – $599.4K
NOI $35,966 @ 7.0% cap · market cap 6.48%
Second Best
Apartment 5plus
$462.8K
$405.0K – $539.9K
NOI $32,396 @ 7.0% cap · market cap 5.84%
Theoretical Best
Office A
$915.6K
$801.2K – $1.07M
NOI $64,094 @ 7.0% cap · market cap 11.55%
Zoning and permitted uses should be independently verified with authorities.
Property Analytics
Unlock full access to Insights
Subscribe to Realmo Intelligence
Open Analytics
Current Use
Lease Details
4
Residential units
Location Intelligence
Trade Area within ½ mile
893
Businesses Nearby
Explore this area
Business Placement
Demographics for 81004, CO
26,005
Population
12,597
Households
2.1
Avg Household Size
39
Median Age
20%
College-Educated
90%
High-School Grad
160.9 sq mi
ZIP Area
162
Density / Sq Mi
$48,620
Median Household Income
$33,925
Median Earnings
$1,002
Median Rent
$181,200
Median Home Value
Check the figures for this property
Cap Rate, Value Estimation, Potential NOI and more
View Realmo Analytics
Market
Vacancy Rate% for Multifamily in West region

Questions? Ask Rey
Realmo’s AI knows this listing — price, zoning, demand, history. Ask anything.



Frequently Asked Questions
What type of property is this?
Quadplex - Four mixed one- and two-bedroom units feature open layouts, updated kitchens, modern bathrooms, and dedicated parking.
Where is this quadplex located?
The property is located at 519 E Evans Ave Pueblo, CO.
What is the asking price?
The asking price for this property is $555,000.
What are key features of this property?
This property features: 4,394‑square‑foot remodeled quadplex with four residential units; Unit mix includes 1‑bedroom and 2‑bedroom residences; Open‑concept layouts with 9‑foot ceilings and laminate flooring


