Mixed-Use Corner Property with
For Sale
$1,495,000
51704 - 51710 Harrison St, Coachella, CA 92236
Mixed-use asset with three ground-floor commercial suites, two apartments, and a renovated rear warehouse with separate access and parking.
Property Size6,280 SF
Lot Size0.49 Acres
Days on Market121
Property Features for 51704 - 51710 Harrison St
General Information
Standard status
Active
Size
6,280 SF
Total Parking Spaces
20
Lot size
0.49 Acres
Property subtype
Retail
Zoning
CG
Site & Location
Highway Access
Yes
Road Access
Yes
Additional Details
Multifamily Units
2
Building Details
Building Size
6,280 SF
Stories
2
Tenancy
Multi
Listing Agency:
SVN Vanguard | San Diego
Listed By:
Pouya Rostampour · License #CalDRE #02117973
(619) 705-9670
Source:
Svn
Added: Jun 22
Changed: Oct 12
Last Checked: Oct 19 at 5:23AM
Displayed information is deemed reliable but is not guaranteed and should be independently verified. All listing content including descriptions, pricing, images are the copyrighted material of SVN Vanguard | San Diego

Ask AI about this property
Review the available facts, identify missing information and prepare questions for the agent.
Investment Insights
Based on property information with market context.
This mixed-use corner property is arranged with three ground-floor commercial suites, two second-floor residential apartments, and a recently renovated attached rear warehouse/storage building. The warehouse/storage space includes separate rear access and supports flexible site use alongside the existing retail and professional components.
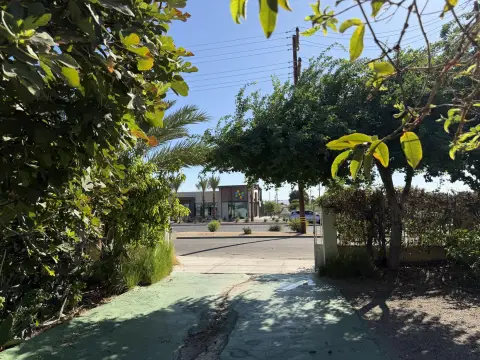
The property sits on a prominent, signalized corner with street frontage at Cesar Chavez Street and Cairo Street in Coachella’s downtown district. The commercial portion includes a neighborhood-serving CPA office and a restaurant occupying two storefront suites, creating an on-site mix of uses with daily street presence.
Zoned CG (General Commercial), the site offers a combination of commercial frontage, residential units above, and warehouse functionality within a single footprint, supported by dedicated on-site parking.
The property sits on a prominent, signalized corner with street frontage at Cesar Chavez Street and Cairo Street in Coachella’s downtown district. The commercial portion includes a neighborhood-serving CPA office and a restaurant occupying two storefront suites, creating an on-site mix of uses with daily street presence.
Zoned CG (General Commercial), the site offers a combination of commercial frontage, residential units above, and warehouse functionality within a single footprint, supported by dedicated on-site parking.
Key Highlights
- Mixed‑use property on the signalized corner of Cesar Chavez St and Cairo St in Coachella, CA
- 3 ground‑floor commercial suites plus 2 second‑floor residential apartments
- Recently renovated rear warehouse/storage building (~1,500 SF) with separate rear access
Financial Insights
Estimated NOI and Cap Rate
NOI / Yr
$98,669
Cap Rate
6.60%
Suggested Prices Based on Cap Rates
Cap Rate 5%
$1,973,380
$2.0M
Cap Rate 7%
$1,409,557
$1.4M
Cap Rate 9%
$1,096,322
$1.1M
Market Conditions
NOI Build-Up for 6,280 SF
Gross rent
$143.9K $22.92/SF
− Vacancy
−$12.4K −$1.97/SF
EGI
$131.6K $20.95/SF
− OpEx
−$32.9K −$5.24/SF
NOI
$98.7K $15.71/SF
Area
Riverside County, CA
Vacancy
8.60%
Lease Rate
$22.92 /SF/Yr
Expense Ratio
25.00%
Simulate Cap Rate and NOI
Suggested Prices Based on Cap Rates
Cap Rate 5%
$1,973,380
Cap Rate 7%
$1,409,557
Cap Rate 9%
$1,096,322
Alternative Uses
Best Use
Office B
$1.41M
$1.23M – $1.64M
NOI $98,669 @ 7.0% cap · market cap 6.60%
Second Best
Specialty Retail
$1.13M
$989.8K – $1.32M
NOI $79,185 @ 7.0% cap · market cap 5.30%
Theoretical Best
Office A
$1.88M
$1.65M – $2.19M
NOI $131,697 @ 7.0% cap · market cap 8.81%
Zoning and permitted uses should be independently verified with authorities.
How Realmo checks its estimates
Property Analytics
Current Use
Lease Details
2
Residential units
Multi-tenant
Tenancy
Yes
Highway access
Yes
Paved road access
Location Intelligence
Trade Area within ½ mile
508
Businesses Nearby
Explore this area
Business Placement
Demographics for 92236, CA
42,220
Population
12,629
Households
3.3
Avg Household Size
29
Median Age
6%
College-Educated
57%
High-School Grad
61.9 sq mi
ZIP Area
682
Density / Sq Mi
$67,235
Median Household Income
$35,117
Median Earnings
$1,113
Median Rent
$342,500
Median Home Value
Market
Vacancy Rate% for Office in West region




Frequently Asked Questions
What type of property is this?
Mixed-use property - Mixed-use asset with three ground-floor commercial suites, two apartments, and a renovated rear warehouse with separate access and parking.
Where is this mixed-use property located?
The property is located at 51704 - 51710 Harrison St Coachella, CA.
What is the asking price?
The asking price for this property is $1,495,000.
What are key features of this property?
This property features: Mixed‑use property on the signalized corner of Cesar Chavez St and Cairo St in Coachella, CA; 3 ground‑floor commercial suites plus 2 second‑floor residential apartments; Recently renovated rear warehouse/storage building (~1,500 SF) with separate rear access


