Downtown Santa Rosa Retail/Office/Medical
For Sale
$2,795,000
515 5th Street, Santa Rosa, CA 95401
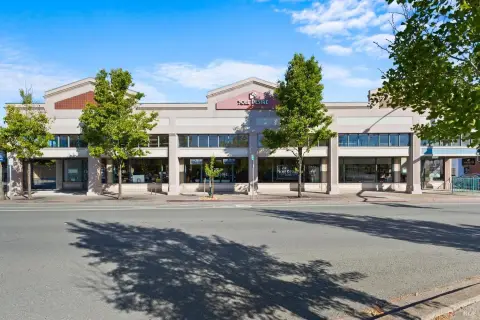
Three-story retail/office/medical space in vibrant downtown Santa Rosa.
Property Size22,440 SF
Days on Market327
Property Features for 515 5th Street
General Information
Standard status
Active
Size
22,440 SF
Property subtype
Retail
Building Details
Building Size
22,440 SF
Listed By:
Nick Egide · License #CalDRE #01859524
(415) 328-3499
Source:
Meridiancommercial
Added: Nov 21, 2025
Changed: Oct 10
Last Checked: Oct 12 at 5:58PM
Displayed information is deemed reliable but is not guaranteed and should be independently verified. All listing content including descriptions, pricing, images are the copyrighted material of Nick Egide
Investment Insights
Based on property information with market context.
This three-story building in downtown Santa Rosa offers retail, office, and medical space. The property features 61 feet of frontage on 5th Street and a rear entrance that opens into a large, city-provided parking lot. Elevator service is available within the building. ADA-compliant bathrooms are located on the first and third floors, and the premises include men's and women's locker rooms. The property benefits from great window lines and natural light. A recently built-out third floor could be used for private treatment or workout rooms. Located in the heart of vibrant Downtown Santa Rosa, it is within walking distance of restaurants, shops, and Santa Rosa Plaza, and in close proximity to Highway 101. The property is suitable for a variety of possible uses including multi-family conversion, health club, restaurant, and wellness center. Recent improvements made to downtown Santa Rosa make this property a great walking or driving destination.
Key Highlights
- Located in the heart of vibrant Downtown Santa Rosa, walking distance to restaurants, shops, and Santa Rosa Plaza.
- Variety of possible uses including multi‑family conversion, health club, restaurant, and wellness center.
- Rear entrance opens into on‑site large city‑provided parking lot.
Financial Insights
Estimated NOI and Cap Rate
NOI / Yr
$244,378
Cap Rate
8.74%
Suggested Prices Based on Cap Rates
Cap Rate 5%
$4,887,560
$4.9M
Cap Rate 7%
$3,491,114
$3.5M
Cap Rate 9%
$2,715,311
$2.7M
Market Conditions
NOI Build-Up for 22,440 SF
Gross rent
$382.4K $17.04/SF
− Vacancy
−$33.3K −$1.48/SF
EGI
$349.1K $15.56/SF
− OpEx
−$104.7K −$4.67/SF
NOI
$244.4K $10.89/SF
Area
Santa Rosa, CA
Vacancy
8.70%
Lease Rate
$17.04 /SF/Yr
Expense Ratio
30.00%
Simulate Cap Rate and NOI
Suggested Prices Based on Cap Rates
Cap Rate 5%
$4,887,560
Cap Rate 7%
$3,491,114
Cap Rate 9%
$2,715,311
Alternative Uses
Best Use
Office B
$4.53M
$3.96M – $5.28M
NOI $316,835 @ 7.0% cap · market cap 11.34%
Second Best
Healthcare Medical
$4.29M
$3.76M – $5.01M
NOI $300,411 @ 7.0% cap · market cap 10.75%
Theoretical Best
Multifamily LT 5
$6.23M
$5.46M – $7.27M
NOI $436,415 @ 7.0% cap · market cap 15.61%
Zoning and permitted uses should be independently verified with authorities.
How Realmo checks its estimates
Property Analytics
Unlock full access to Insights
Subscribe to Realmo Intelligence
Open Analytics
Current Use
Location Intelligence
Trade Area within ½ mile
4,175
Businesses Nearby
Explore this area
Business Placement
Demographics for 95401, CA
37,272
Population
14,281
Households
2.6
Avg Household Size
38
Median Age
28%
College-Educated
80%
High-School Grad
20.9 sq mi
ZIP Area
1,783
Density / Sq Mi
$93,513
Median Household Income
$45,630
Median Earnings
$1,978
Median Rent
$628,900
Median Home Value
Check the figures for this property
Cap Rate, Value Estimation, Potential NOI and more
View Realmo Analytics
Market
Vacancy Rate% for Office in West region

Questions? Ask Rey
Realmo’s AI knows this listing — price, zoning, demand, history. Ask anything.


Frequently Asked Questions
What type of property is this?
Retail space - Three-story retail/office/medical space in vibrant downtown Santa Rosa.
Where is this retail space located?
The property is located at 515 5th Street Santa Rosa, CA.
What is the asking price?
The asking price for this property is $2,795,000.
What are key features of this property?
This property features: Located in the heart of vibrant Downtown Santa Rosa, walking distance to restaurants, shops, and Santa Rosa Plaza.; Variety of possible uses including multi‑family conversion, health club, restaurant, and wellness center.; Rear entrance opens into on‑site large city‑provided parking lot.