Two-Story Mixed-Use Commercial
For Sale
Contact for pricing
589 Mendocino Ave, Santa Rosa, CA 95401
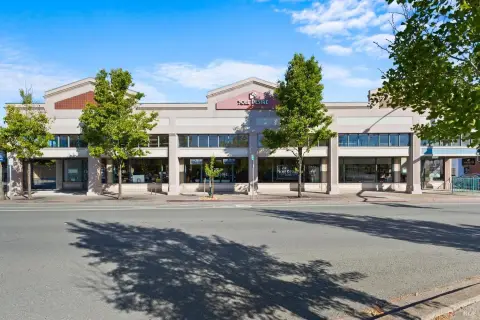
Two-floor commercial building with a first-floor fitness studio and second-floor office suite, plus two separate entrances.
Property Size8,242 SF
Price / SF$197.16
Days on Market203
Property Features for 589 Mendocino Ave
General Information
Standard status
Active
Size
8,242 SF
Property subtype
Retail, Office, Mixed Use
Zoning
CMU - Core Mixed Use
Investment Type
Owner/User
Building Details
Year Built
1978
Stories
2
Tenancy
Multi
Listing Agency:
Keegan & Coppin Co. Petaluma
Listed By:
Summer Jager · License #02222063
(707) 664-1400
Source:
Crexi
Added: Apr 3
Changed: Oct 20
Last Checked: Oct 20 at 5:14PM
Displayed information is deemed reliable but is not guaranteed and should be independently verified. All listing content including descriptions, pricing, images are the copyrighted material of Keegan & Coppin Co. Petaluma

Ask AI about this property
Review the available facts, identify missing information and prepare questions for the agent.
Investment Insights
Based on property information with market context.
589 Mendocino Avenue is a two-story commercial property totaling 8,242+/- SF, arranged with a built-out fitness studio on the first floor and private office space on the second floor. The first floor includes two studio rooms, a reception and retail area, a private room, and two restrooms, one with a shower. The second floor provides 4,126+/- SF configured as private offices with a waiting area, common area restrooms, and a kitchenette, with flexibility to occupy the entire level or subdivide it.
The building benefits from prominent signage exposure and an expansive storefront window line along Mendocino Avenue. There are two separate entrances, including one fronting Mendocino Avenue and another accessible from the rear parking lot.
Overall, the layout supports an owner-user configuration or potential lease arrangements between levels, with visibility and entry points on both the street and rear parking area.
The building benefits from prominent signage exposure and an expansive storefront window line along Mendocino Avenue. There are two separate entrances, including one fronting Mendocino Avenue and another accessible from the rear parking lot.
Overall, the layout supports an owner-user configuration or potential lease arrangements between levels, with visibility and entry points on both the street and rear parking area.
Key Highlights
- Two‑floor commercial building with 8,242+/- SF total space across 1st and 2nd floors
- First floor (4,116+/- SF) is built out as a fully operational fitness studio with two studio rooms, reception/retail area, private room, and two restrooms (one with a shower)
- Second floor (4,126+/- SF) features private offices with a waiting area, common area restrooms, and a kitchenette; can be occupied fully or subdivided
Financial Insights
Estimated NOI and Cap Rate
NOI / Yr
$116,370
Cap Rate
7.16%
Suggested Prices Based on Cap Rates
Cap Rate 5%
$2,327,400
$2.3M
Cap Rate 7%
$1,662,429
$1.7M
Cap Rate 9%
$1,293,000
$1.3M
Market Conditions
NOI Build-Up for 8,242 SF
Gross rent
$183.0K $22.20/SF
− Vacancy
−$27.8K −$3.37/SF
EGI
$155.2K $18.83/SF
− OpEx
−$38.8K −$4.71/SF
NOI
$116.4K $14.12/SF
Area
Santa Rosa, CA
Vacancy
15.20%
Lease Rate
$22.20 /SF/Yr
Expense Ratio
25.00%
Simulate Cap Rate and NOI
Suggested Prices Based on Cap Rates
Cap Rate 5%
$2,327,400
Cap Rate 7%
$1,662,429
Cap Rate 9%
$1,293,000
Alternative Uses
Best Use
Office B
$1.66M
$1.45M – $1.94M
NOI $116,370 @ 7.0% cap · market cap 7.16%
Second Best
Retail
$1.28M
$1.12M – $1.50M
NOI $89,758 @ 7.0% cap · market cap 5.52%
Theoretical Best
Multifamily LT 5
$2.29M
$2.00M – $2.67M
NOI $160,291 @ 7.0% cap · market cap 9.86%
Zoning and permitted uses should be independently verified with authorities.
How Realmo checks its estimates
Property Analytics
Contact the owner directly
Get the owner's phone numbers and email
Open Analytics
Current Use
Location Intelligence
Trade Area within ½ mile
4,126
Businesses Nearby
Well-served
Demand for This Use
Explore this area
Business Placement
Demographics for 95401, CA
37,272
Population
14,281
Households
2.6
Avg Household Size
38
Median Age
28%
College-Educated
80%
High-School Grad
20.9 sq mi
ZIP Area
1,783
Density / Sq Mi
$93,513
Median Household Income
$45,630
Median Earnings
$1,978
Median Rent
$628,900
Median Home Value
Check the figures for this property
Cap Rate, Value Estimation, Potential NOI and more
View Realmo Analytics
Market
Vacancy Rate% for Office in West region




Similar Off Market Nearby
- Soul Shine Family Chiropractic — 440 S E St, Santa Rosa, CA 95404
- Jeanie Wright Postpartum Corrective Exercise
- Stacey Richards Murray Massage Therapy — 10 4th St suite 219, Santa Rosa, CA 95401
- PJAMM Cycling — 438 1st St, Santa Rosa, CA 95401
- Li's Wushu Academy — 492 Sonoma Ave, Santa Rosa, CA 95401
Frequently Asked Questions
What type of property is this?
Fitness center & gym - Two-floor commercial building with a first-floor fitness studio and second-floor office suite, plus two separate entrances.
Where is this fitness center & gym located?
The property is located at 589 Mendocino Ave Santa Rosa, CA.
What is the asking price?
The asking price for this property is $1,625,000.
What are key features of this property?
This property features: Two‑floor commercial building with 8,242+/- SF total space across 1st and 2nd floors; First floor (4,116+/- SF) is built out as a fully operational fitness studio with two studio rooms, reception/retail area, private room, and two restrooms (one with a shower); Second floor (4,126+/- SF) features private offices with a waiting area, common area restrooms, and a kitchenette; can be occupied fully or subdivided


