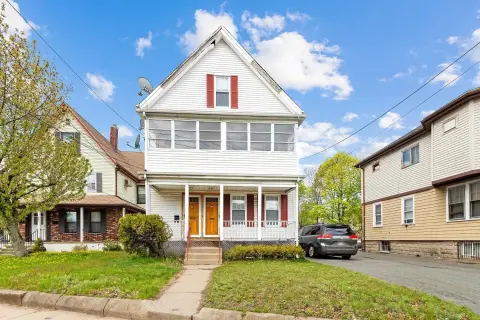
2-Unit Duplex with
For Sale
$674,900
51 Oakland St, Malden, MA 02148
Two residential units provide flexible layouts, private living areas, and additional bonus rooms for varied household needs.
Property Size2,494 SF
Price / SF$270.61
Days on Market49
Property Features for 51 Oakland St
General Information
Standard status
Active
Size
2,494 SF
Property subtype
Multi-Family
Site & Location
Highway Access
Yes
Public Transit
Yes
Utilities to Site
Yes
Additional Details
Multifamily Units
2
Building Details
Year Built
1910
Listing Agency:
Century 21 North East
Listed By:
Kristin Gennetti · License #448551493
(781) 704-7040
Source:
Livianhomesct
Added: Aug 20
Changed: Sep 27
Last Checked: Oct 7 at 3:49PM
Displayed information is deemed reliable but is not guaranteed and should be independently verified. All listing content including descriptions, pricing, images are the copyrighted material of Century 21 North East
Investment Insights
Based on property information with market context.
This 2,494-square-foot duplex, built in 1910, includes two residential units with adaptable floor plans. The first unit has a kitchen, bedroom, living room, full bathroom, and bonus room. The second unit spans two living levels and contains three bedrooms, a bonus room, kitchen, living areas, and a full bathroom. Interior features include oil heat, gas cooking, and fuse-based electrical service.
The property includes a 2-car garage, additional parking, yard space, granite front steps, and a front porch. It is near Malden Train Station, Malden Center, restaurants, breweries, and stores, with access to Assembly Row, Wellington Station, downtown Boston, and major highways. The property is offered in as-is condition, and condo conversion is identified as a possibility.
The property includes a 2-car garage, additional parking, yard space, granite front steps, and a front porch. It is near Malden Train Station, Malden Center, restaurants, breweries, and stores, with access to Assembly Row, Wellington Station, downtown Boston, and major highways. The property is offered in as-is condition, and condo conversion is identified as a possibility.
Key Highlights
- 2,494 SF duplex built in 1910
- Two residential units with flexible floor plans
- Second unit spans two living levels and includes 3 bedrooms plus a bonus room
Financial Insights
Estimated NOI and Cap Rate
NOI / Yr
$52,774
Cap Rate
7.82%
Suggested Prices Based on Cap Rates
Cap Rate 5%
$1,055,480
$1.1M
Cap Rate 7%
$753,914
$753.9K
Cap Rate 9%
$586,378
$586.4K
Market Conditions
NOI Build-Up for 2,494 SF
Gross rent
$79.3K $31.80/SF
− Vacancy
−$3.9K −$1.57/SF
EGI
$75.4K $30.23/SF
− OpEx
−$22.6K −$9.07/SF
NOI
$52.8K $21.16/SF
Area
Middlesex County, MA
Vacancy
4.94%
Lease Rate
$31.80 /SF/Yr
Expense Ratio
30.00%
Simulate Cap Rate and NOI
Suggested Prices Based on Cap Rates
Cap Rate 5%
$1,055,480
Cap Rate 7%
$753,914
Cap Rate 9%
$586,378
Alternative Uses
Best Use
Multifamily LT 5
$753.9K
$659.7K – $879.6K
NOI $52,774 @ 7.0% cap · market cap 7.82%
Second Best
Apartment 5plus
$708.9K
$620.3K – $827.0K
NOI $49,622 @ 7.0% cap · market cap 7.35%
Theoretical Best
Office A
$1.48M
$1.29M – $1.72M
NOI $103,351 @ 7.0% cap · market cap 15.31%
Zoning and permitted uses should be independently verified with authorities.
Property Analytics
Unlock full access to Insights
Subscribe to Realmo Intelligence
Open Analytics
Current Use
Lease Details
2
Residential units
Yes
Highway access
Yes
Utilities to site
Location Intelligence
Trade Area within ½ mile
1,426
Businesses Nearby
Explore this area
Business Placement
Demographics for 02148, MA
66,274
Population
28,043
Households
2.4
Avg Household Size
36
Median Age
45%
College-Educated
87%
High-School Grad
5.0 sq mi
ZIP Area
13,255
Density / Sq Mi
$95,298
Median Household Income
$56,077
Median Earnings
$2,066
Median Rent
$607,500
Median Home Value
Check the figures for this property
Cap Rate, Value Estimation, Potential NOI and more
View Realmo Analytics
Market
Vacancy Rate% for Multifamily in Northeast region

Questions? Ask Rey
Realmo’s AI knows this listing — price, zoning, demand, history. Ask anything.






Frequently Asked Questions
What type of property is this?
Duplex - Two residential units provide flexible layouts, private living areas, and additional bonus rooms for varied household needs.
Where is this duplex located?
The property is located at 51 Oakland St Malden, MA.
What is the asking price?
The asking price for this property is $674,900.
What are key features of this property?
This property features: 2,494 SF duplex built in 1910; Two residential units with flexible floor plans; Second unit spans two living levels and includes 3 bedrooms plus a bonus room