New-Construction Duplex with
For Sale
$2,250,000
5-7 Vassall St, Quincy, MA 02170
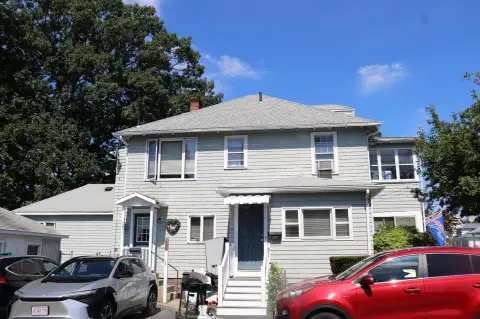
Two townhouse-style residences offer three-level layouts, private outdoor areas, and convenient access to transit and major routes.
Property Size4,800 SF
Days on Market59
Property Features for 5-7 Vassall St
General Information
Standard status
Active
Size
4,800 SF
Total Parking Spaces
8
Property subtype
Multifamily
Site & Location
Highway Access
Yes
Public Transit
Yes
Units
Unit Mix
2 x 3BR/3.5BA
Multifamily Units
2
Building Details
Building Size
4,800 SF
Year Built
2026
Buildings
1
Stories
3
Construction
townhouse-style
Listing Agency:
V & E Realty
Listed By:
Derek Wong · License #455500324
(617) 290-8289
Source:
Classifiedrealtygroup
Added: Aug 8
Changed: Sep 30
Last Checked: Oct 4 at 6:59AM
Displayed information is deemed reliable but is not guaranteed and should be independently verified. All listing content including descriptions, pricing, images are the copyrighted material of V & E Realty
Investment Insights
Based on property information with market context.
Completed in 2026, this duplex includes two townhouse-style residences totaling 4,800 square feet. Each unit provides approximately 2,400 square feet across three levels, with three bedrooms, 3.5 bathrooms, an office, and an attached two-car garage. Interior features include quartz kitchen surfaces, stainless steel appliances, hardwood flooring on the upper floors, luxury vinyl plank flooring on the first level, central air conditioning and heating, and in-unit laundry. Each residence also includes a balcony, private patio and yard areas, a paver driveway, and one dedicated guest parking space.
The property offers practical access to public transportation, a T station, and highway connections. Restaurants, supermarkets, and schools are also located nearby. The building includes gas heating and cooking, EV-ready garage infrastructure, Ring security equipment, and finished outdoor walkways.
The property offers practical access to public transportation, a T station, and highway connections. Restaurants, supermarkets, and schools are also located nearby. The building includes gas heating and cooking, EV-ready garage infrastructure, Ring security equipment, and finished outdoor walkways.
Key Highlights
- Duplex completed in 2026 with 4,800 square feet total
- Two units, each approximately 2,400 sq. ft. across 3 levels
- Each residence includes 3 bedrooms, 3.5 bathrooms, and 1 office
Financial Insights
Estimated NOI and Cap Rate
NOI / Yr
$81,053
Cap Rate
3.60%
Suggested Prices Based on Cap Rates
Cap Rate 5%
$1,621,060
$1.6M
Cap Rate 7%
$1,157,900
$1.2M
Cap Rate 9%
$900,589
$900.6K
Market Conditions
NOI Build-Up for 4,800 SF
Gross rent
$123.8K $25.80/SF
− Vacancy
−$8.0K −$1.68/SF
EGI
$115.8K $24.12/SF
− OpEx
−$34.7K −$7.24/SF
NOI
$81.1K $16.89/SF
Area
Quincy, MA
Vacancy
6.50%
Lease Rate
$25.80 /SF/Yr
Expense Ratio
30.00%
Simulate Cap Rate and NOI
Suggested Prices Based on Cap Rates
Cap Rate 5%
$1,621,060
Cap Rate 7%
$1,157,900
Cap Rate 9%
$900,589
Alternative Uses
Best Use
Multifamily LT 5
$1.16M
$1.01M – $1.35M
NOI $81,053 @ 7.0% cap · market cap 3.60%
Second Best
Apartment 5plus
$1.06M
$930.6K – $1.24M
NOI $74,448 @ 7.0% cap · market cap 3.31%
Theoretical Best
Office A
$2.84M
$2.48M – $3.31M
NOI $198,605 @ 7.0% cap · market cap 8.83%
Zoning and permitted uses should be independently verified with authorities.
Property Analytics
Unlock full access to Insights
Subscribe to Realmo Intelligence
Open Analytics
Current Use
Lease Details
2
Residential units
Yes
Highway access
Location Intelligence
Trade Area within ½ mile
1,115
Businesses Nearby
Explore this area
Business Placement
Demographics for 02170, MA
19,950
Population
8,471
Households
2.4
Avg Household Size
39
Median Age
46%
College-Educated
86%
High-School Grad
2.1 sq mi
ZIP Area
9,500
Density / Sq Mi
$101,840
Median Household Income
$54,561
Median Earnings
$1,801
Median Rent
$661,800
Median Home Value
Check the figures for this property
Cap Rate, Value Estimation, Potential NOI and more
View Realmo Analytics
Market
Vacancy Rate% for Multifamily in Northeast region

Questions? Ask Rey
Realmo’s AI knows this listing — price, zoning, demand, history. Ask anything.




Frequently Asked Questions
What type of property is this?
Duplex - Two townhouse-style residences offer three-level layouts, private outdoor areas, and convenient access to transit and major routes.
Where is this duplex located?
The property is located at 5-7 Vassall St Quincy, MA.
What is the asking price?
The asking price for this property is $2,250,000.
What are key features of this property?
This property features: Duplex completed in 2026 with 4,800 square feet total; Two units, each approximately 2,400 sq. ft. across 3 levels; Each residence includes 3 bedrooms, 3.5 bathrooms, and 1 office


