Flex Space with Fleet
For Sale
$2,100,000
4910 N Market Street, Shreveport, LA 71107
CommercialSale, Shreveport, LA
Property Size20,548 SF
Lot Size9.00 Acres
Price / SF$102.20
Days on Market56
Property Features for 4910 N Market Street
General Information
Property type
Commercial Sale
Property subtype
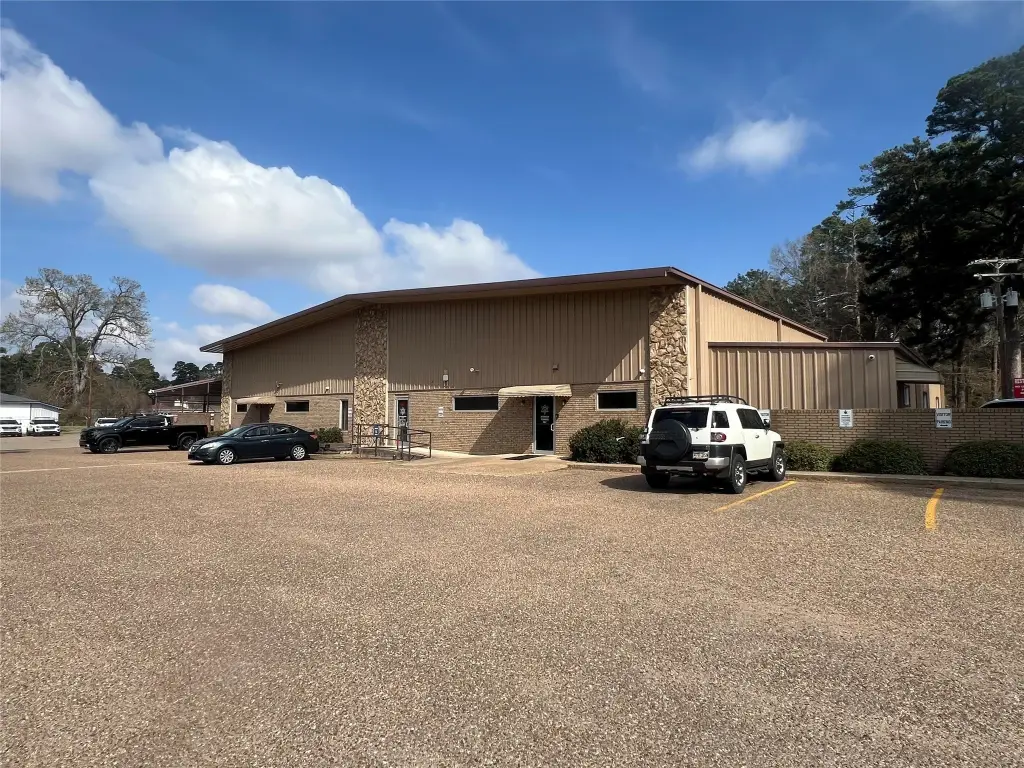
Office
Zoning description
C-2
Parking features
Open
Subdivision
Brazzel North Sub
Lot features
Acreage
Directions
4910 North Market Close to the library
Standard status
Active
APN
191432052000100,191432004002300
Lot size
9.00 Acres
Taxes and HOA fees
Tax Description
5.333 ACS. M/L - LOT 1, BRAZZEL NORTH SUBDIVI,2.13
Tax Annual Amount
14568
Legal Description
5.333 ACS. M/L - LOT 1, BRAZZEL NORTH SUBDIVI,2.13
Utilities
Sewer type
Public Sewer
Heating system
Central
Water source
Public
Amenities
multiple private offices
three restrooms
conference room
training areas
interior and exterior storage
100 kW diesel backup generator
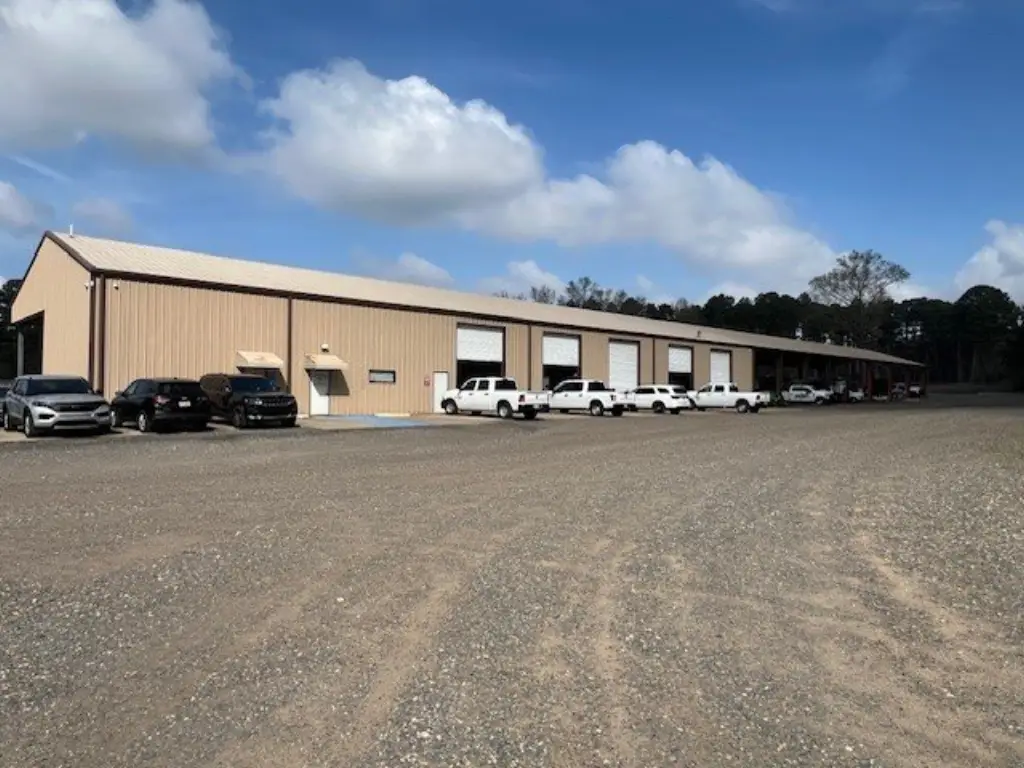
five enclosed service bays
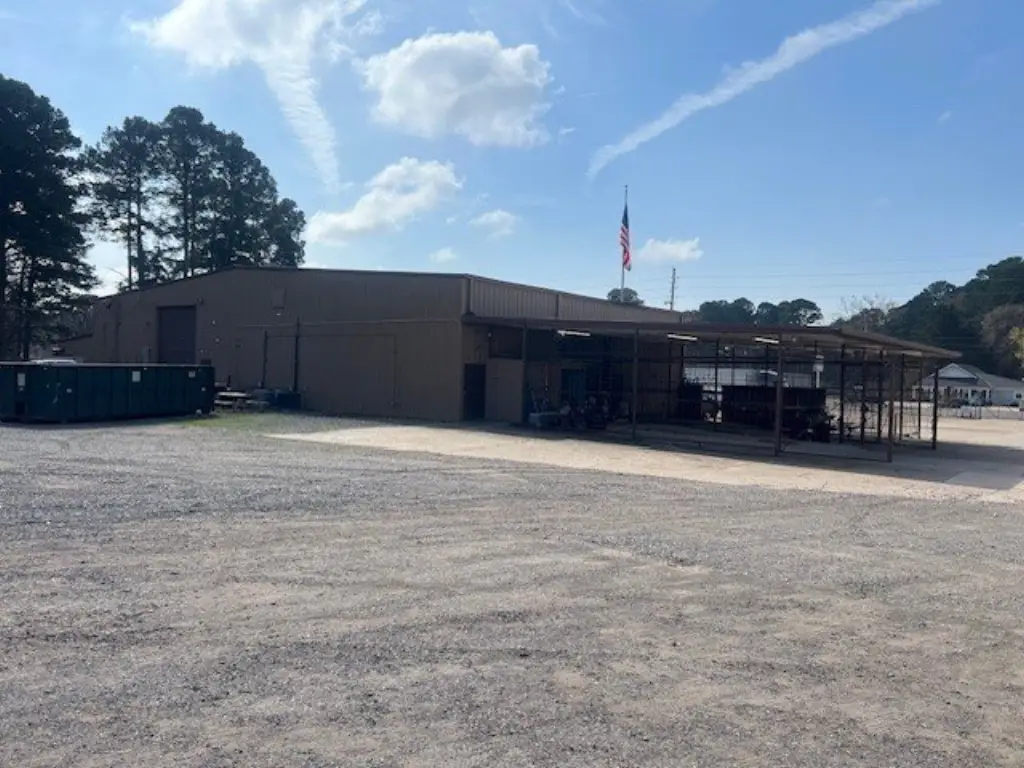
five open bays
compressed air systems
exhaust hose ventilation
fully decked mezzanine
on-site fueling station
fully enclosed perimeter
Building Details
Year built
2018
Floors in Building
2
Number of units
2
Flooring type
Combination, Tile
Building materials
AluminumSiding, Brick, MetalSiding
Roof type
Metal
Listing Agency:
Walker-Alley & Associates
(318) 222-2022
Listed By:
Danielle Cummings · License #0995687005
(318) 572-7926
Added: Aug 12
Changed: Sep 15
Last Checked: Oct 6 at 6:06PM
MLS# 21358056
Copyright © 2026 North Texas Real Estate Information Systems, Inc. All rights reserved. All information provided by the listing agent/broker is deemed reliable but is not guaranteed and should be independently verified.
Investment Insights
Based on property information with market context.
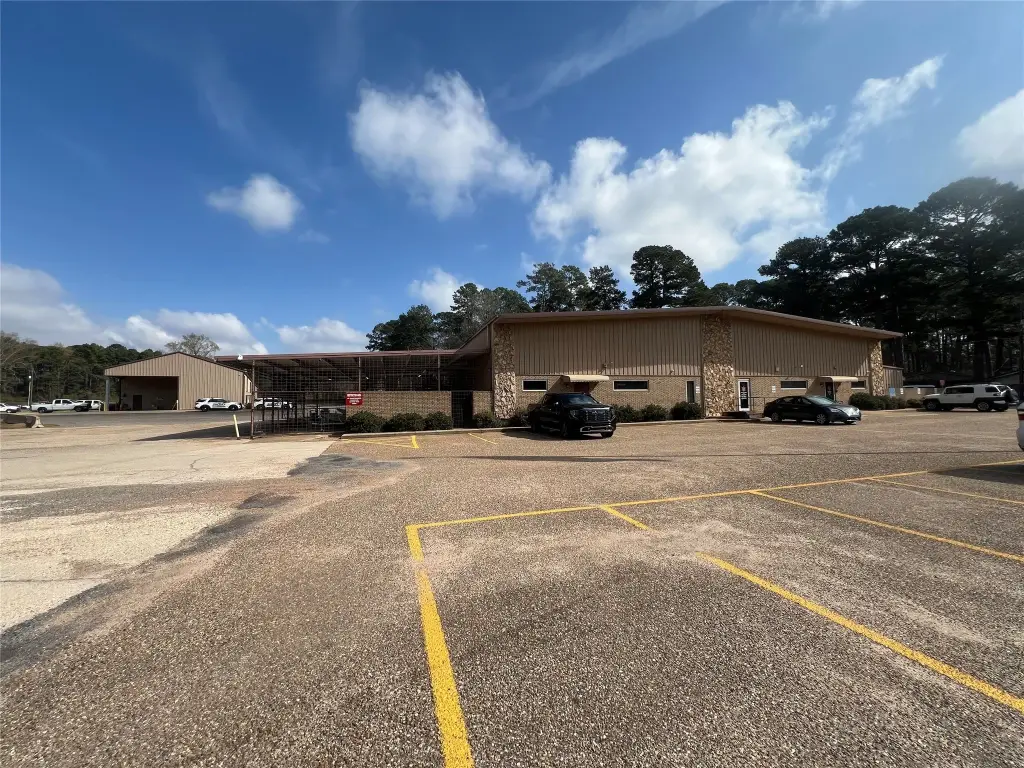
This flex-space campus combines an office building with a dedicated fleet maintenance facility and secured outdoor operating area. The office component includes private offices, three restrooms, a conference room, training areas, and interior and exterior storage, along with a 100 kW diesel backup generator. The maintenance building provides five enclosed service bays and five open bays, with compressed air and exhaust hose ventilation in the enclosed bays. A fully decked mezzanine adds parts and equipment storage.
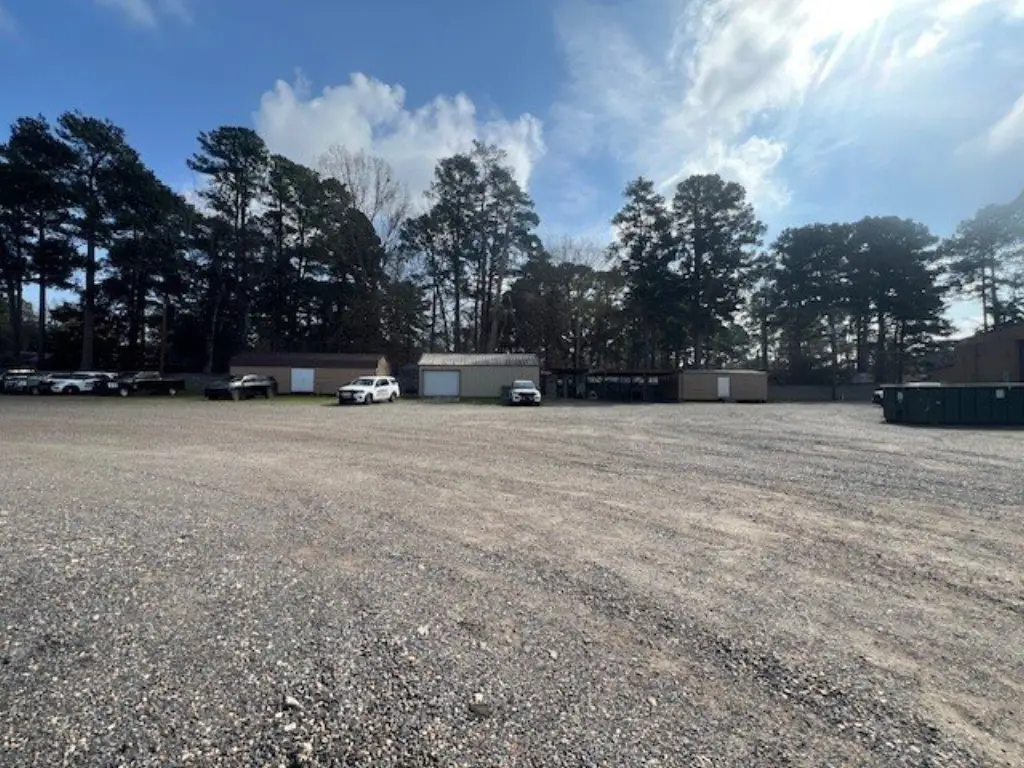
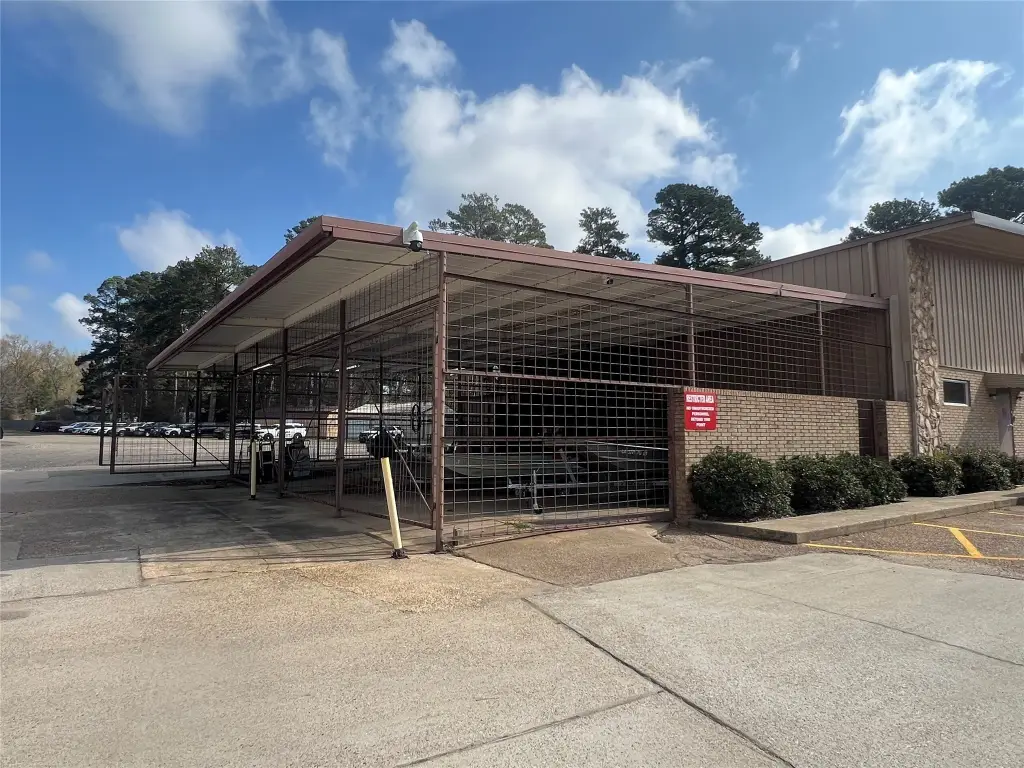
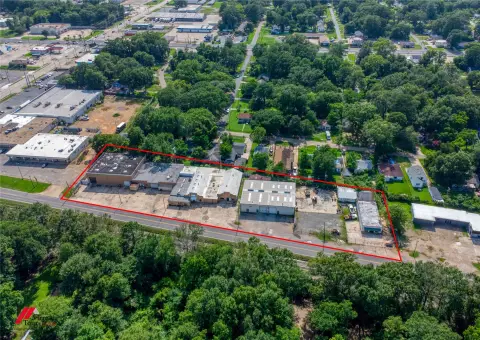
The 9-acre property includes an on-site fueling station with two unleaded gasoline pumps. Concrete block masonry and six-foot cyclone fencing topped with barbed wire enclose the perimeter, while the yard supports vehicle circulation and equipment security. Located at 4910 N Market Street in Shreveport, the campus is near retail, service, and light industrial businesses with access to Interstate 49.
The 9-acre property includes an on-site fueling station with two unleaded gasoline pumps. Concrete block masonry and six-foot cyclone fencing topped with barbed wire enclose the perimeter, while the yard supports vehicle circulation and equipment security. Located at 4910 N Market Street in Shreveport, the campus is near retail, service, and light industrial businesses with access to Interstate 49.
Key Highlights
- 9‑acre commercial campus at 4910 N Market Street in Shreveport
- Five enclosed service bays and five open bays
- 100 kW diesel backup generator serving the office building
Financial Insights
Estimated NOI and Cap Rate
NOI / Yr
$135,592
Cap Rate
6.46%
Suggested Prices Based on Cap Rates
Cap Rate 5%
$2,711,840
$2.7M
Cap Rate 7%
$1,937,029
$1.9M
Cap Rate 9%
$1,506,578
$1.5M
Market Conditions
NOI Build-Up for 20,548 SF
Gross rent
$221.9K $10.80/SF
− Vacancy
−$13.3K −$0.65/SF
EGI
$208.6K $10.15/SF
− OpEx
−$73.0K −$3.55/SF
NOI
$135.6K $6.60/SF
Area
Shreveport, LA
Vacancy
6.00%
Lease Rate
$10.80 /SF/Yr
Expense Ratio
35.00%
Simulate Cap Rate and NOI
Suggested Prices Based on Cap Rates
Cap Rate 5%
$2,711,840
Cap Rate 7%
$1,937,029
Cap Rate 9%
$1,506,578
Alternative Uses
Best Use
Office B
$3.33M
$2.91M – $3.88M
NOI $233,014 @ 7.0% cap · market cap 11.10%
Second Best
Retail
$2.91M
$2.55M – $3.39M
NOI $203,672 @ 7.0% cap · market cap 9.70%
Theoretical Best
Office A
$4.34M
$3.79M – $5.06M
NOI $303,584 @ 7.0% cap · market cap 14.46%
Zoning and permitted uses should be independently verified with authorities.
Property Analytics
Unlock full access to Insights
Subscribe to Realmo Intelligence
Open Analytics
Current Use
Lease Details
10
Service bays
Yes
Fenced yard
Yes
Highway access
Yes
Paved road access
Location Intelligence
Trade Area within ½ mile
92
Businesses Nearby
Under-served
Demand for This Use
Explore this area
Business Placement
Demographics for 71107, LA
31,311
Population
13,636
Households
2.3
Avg Household Size
38
Median Age
18%
College-Educated
85%
High-School Grad
137.2 sq mi
ZIP Area
228
Density / Sq Mi
$48,114
Median Household Income
$31,075
Median Earnings
$909
Median Rent
$157,000
Median Home Value
Check the figures for this property
Cap Rate, Value Estimation, Potential NOI and more
View Realmo Analytics
Market
Vacancy Rate% for Office in South region

Questions? Ask Rey
Realmo’s AI knows this listing — price, zoning, demand, history. Ask anything.


Frequently Asked Questions
What type of property is this?
Flex space - Secure commercial campus combining office, vehicle maintenance, fueling, storage, and controlled yard operations.
Where is this flex space located?
The property is located at 4910 N Market Street Shreveport, LA.
What is the asking price?
The asking price for this property is $2,100,000.
What are key features of this property?
This property features: 9‑acre commercial campus at 4910 N Market Street in Shreveport; Five enclosed service bays and five open bays; 100 kW diesel backup generator serving the office building



