Renovated Mixed-Use Downtown
For Sale
$3,950,000
49 Stone Street, Rochester, NY 14604
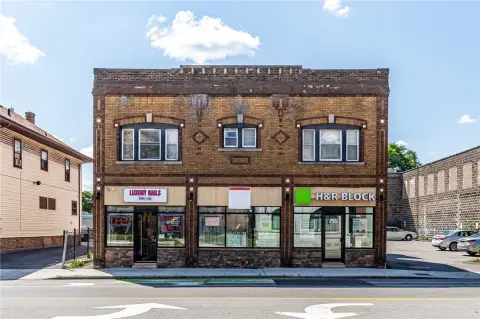
Fully renovated mixed-use property with residential and commercial spaces.
Property Size39,831 SF
Price / SF$130.60
Days on Market212
Property Features for 49 Stone Street
General Information
Standard status
Active
Size
39,831 SF
Property subtype
Office
Taxes and HOA fees
Annual Taxes
$28,169
Building Details
Building Size
39,831 SF
Year Built
1900
Listing Agency:
Empire Realty Group
Listed By:
Thomas G. Lockwood · License #30LO0935938
(585) 737-4055
Source:
Griffith-realty
Added: Mar 9
Changed: Sep 24
Last Checked: Oct 6 at 12:08AM
Displayed information is deemed reliable but is not guaranteed and should be independently verified. All listing content including descriptions, pricing, images are the copyrighted material of Empire Realty Group
Investment Insights
Based on property information with market context.
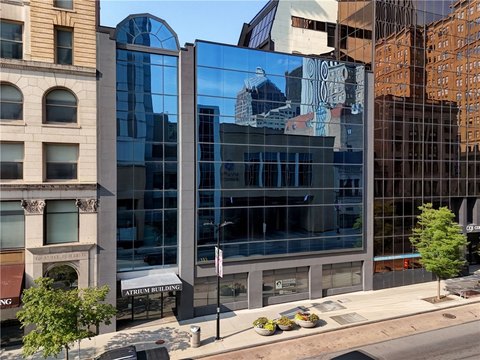
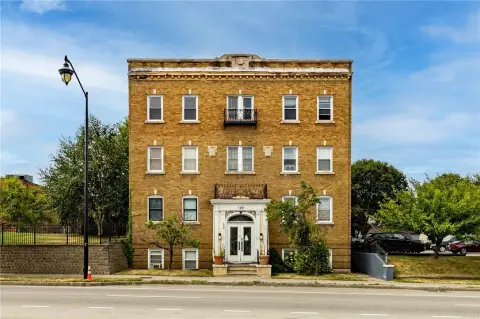
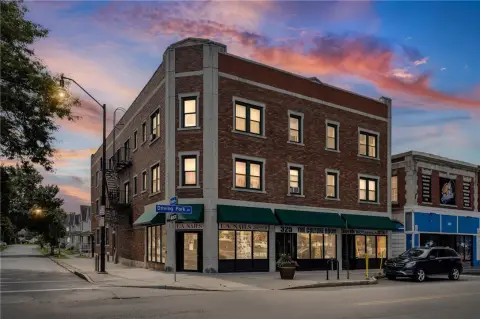
This is a fully renovated, stabilized four-story mixed-use asset located in Downtown Rochester, New York. The property features 21 residential apartment units and 4,946 square feet of ground-floor commercial space. The building was completely renovated in 2020, modernizing both infrastructure and interior living spaces, including new mechanical systems, upgraded electrical and plumbing components, enhanced life-safety systems, and modernized common areas. The residential portion consists of thoughtfully designed one-bedroom and two-bedroom layouts with open-concept layouts, energy-efficient systems, loft-style ceilings, contemporary kitchens, and in-unit laundry. Units incorporate an industrial-inspired aesthetic featuring exposed HVAC ductwork, contract ceilings, and loft-style architectural elements. Tenant amenities include an open-air rooftop deck with a dedicated dog park, pet-friendly accommodations, and convenient adjacent parking access. The commercial space is suited for retail, boutique fitness, restaurant/café, professional office, or service-oriented uses, and features strong street visibility, dedicated storefront access, consistent residential foot traffic, and high vehicular exposure. The property benefits from immediate access to employment hubs, entertainment venues, retail corridors, and public transportation infrastructure.
Key Highlights
- Fully Renovated in 2020: Enjoy comprehensive modernization with new mechanical systems and interior finishes.
- Diversified Income Stream: Benefit from a combination of 21 residential units and 4,946 SF of commercial space.
- Strong Amenity Package: Includes an open‑air rooftop deck, dedicated dog park, and secure building access.
Financial Insights
Estimated NOI and Cap Rate
NOI / Yr
$310,275
Cap Rate
7.86%
Suggested Prices Based on Cap Rates
Cap Rate 5%
$6,205,500
$6.2M
Cap Rate 7%
$4,432,500
$4.4M
Cap Rate 9%
$3,447,500
$3.4M
Market Conditions
NOI Build-Up for 30,246 SF
Gross rent
$598.9K $19.80/SF
− Vacancy
−$34.7K −$1.15/SF
EGI
$564.1K $18.65/SF
− OpEx
−$253.9K −$8.39/SF
NOI
$310.3K $10.26/SF
Area
Rochester, NY
Vacancy
5.80%
Lease Rate
$19.80 /SF/Yr
Expense Ratio
45.00%
Simulate Cap Rate and NOI
Suggested Prices Based on Cap Rates
Cap Rate 5%
$6,205,500
Cap Rate 7%
$4,432,500
Cap Rate 9%
$3,447,500
Alternative Uses
Best Use
Mixed Use
$5.25M
$4.59M – $6.12M
NOI $367,489 @ 7.0% cap · market cap 9.30%
Second Best
Apartment 5plus
$4.43M
$3.88M – $5.17M
NOI $310,275 @ 7.0% cap · market cap 7.86%
Theoretical Best
Office A
$8.29M
$7.25M – $9.67M
NOI $579,997 @ 7.0% cap · market cap 14.68%
Zoning and permitted uses should be independently verified with authorities.
Property Analytics
Unlock full access to Insights
Subscribe to Realmo Intelligence
Open Analytics
Current Use
Location Intelligence
Trade Area within ½ mile
4,853
Businesses Nearby
Explore this area
Business Placement
Demographics for 14604, NY
3,138
Population
2,367
Households
1.3
Avg Household Size
39
Median Age
62%
College-Educated
94%
High-School Grad
0.3 sq mi
ZIP Area
10,460
Density / Sq Mi
$63,672
Median Household Income
$62,935
Median Earnings
$1,253
Median Rent
$705,100
Median Home Value
Check the figures for this property
Cap Rate, Value Estimation, Potential NOI and more
View Realmo Analytics
Market
Vacancy Rate% for Multifamily in Northeast region

Questions? Ask Rey
Realmo’s AI knows this listing — price, zoning, demand, history. Ask anything.







Frequently Asked Questions
What type of property is this?
Mixed-use property - Fully renovated mixed-use property with residential and commercial spaces.
Where is this mixed-use property located?
The property is located at 49 Stone Street Rochester, NY.
What is the asking price?
The asking price for this property is $3,950,000.
What are key features of this property?
This property features: Fully Renovated in 2020: Enjoy comprehensive modernization with new mechanical systems and interior finishes.; Diversified Income Stream: Benefit from a combination of 21 residential units and 4,946 SF of commercial space.; Strong Amenity Package: Includes an open‑air rooftop deck, dedicated dog park, and secure building access.



