Downtown Exeter Development
For Sale
$2,990,000
Pending
48 Lincoln St, Exeter, NH 03833
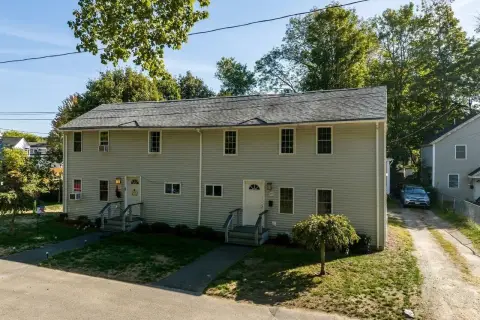
1.5+ acre mixed-use development site in downtown Exeter, NH.
Property Size16,119 SF
Lot Size1.50 Acres
Days on Market197
Property Features for 48 Lincoln St
General Information
Standard status
Pending
Size
16,119 SF
Lot size
1.50 Acres
Property subtype
Commercial
Building Details
Building Size
16,119 SF
Year Built
1900
Listing Agency:
Carey Giampa, LLC/Portsmouth
Listed By:
Nick Ponte
(603) 964-7000
Source:
Elliman
Added: Mar 24
Changed: Oct 1
Last Checked: Oct 5 at 7:02PM
Displayed information is deemed reliable but is not guaranteed and should be independently verified. All listing content including descriptions, pricing, images are the copyrighted material of Carey Giampa, LLC/Portsmouth
Investment Insights
Based on property information with market context.
This property presents a development opportunity in downtown Exeter, New Hampshire. The site, spanning over 1.5 acres, is located within the MUND Overlay District, which supports a mix of residential and commercial development. The property includes a building of over 16,000 square feet that formerly served as a rubber step manufacturing plant in the early 1900s and, for the past 40 years, has been home to the Exeter Handkerchief Factory. The site borders the Amtrak rail line, which provides daily service from Exeter to Boston. It is also located within walking distance of downtown Exeter's shops and restaurants, as well as Phillips Exeter Academy. This property is located in Exeter, one of New Hampshire’s most desirable towns.
Key Highlights
- Over 1.5 acres in downtown Exeter, NH
- Located within the MUND Overlay District, allowing mixed‑use development
- 16,000+ sq ft building with redevelopment potential**
Financial Insights
Estimated NOI and Cap Rate
NOI / Yr
$149,040
Cap Rate
4.98%
Suggested Prices Based on Cap Rates
Cap Rate 5%
$2,980,800
$3.0M
Cap Rate 7%
$2,129,143
$2.1M
Cap Rate 9%
$1,656,000
$1.7M
Market Conditions
NOI Build-Up for 16,000 SF
Gross rent
$259.2K $16.20/SF
− Vacancy
−$20.7K −$1.30/SF
EGI
$238.5K $14.90/SF
− OpEx
−$89.4K −$5.59/SF
NOI
$149.0K $9.32/SF
Area
Rockingham County, NH
Vacancy
8.00%
Lease Rate
$16.20 /SF/Yr
Expense Ratio
37.50%
Simulate Cap Rate and NOI
Suggested Prices Based on Cap Rates
Cap Rate 5%
$2,980,800
Cap Rate 7%
$2,129,143
Cap Rate 9%
$1,656,000
Alternative Uses
Best Use
Mixed Use
$2.13M
$1.86M – $2.48M
NOI $149,040 @ 7.0% cap · market cap 4.98%
Second Best
—
—
no second resolved use
Theoretical Best
Office A
$5.33M
$4.66M – $6.21M
NOI $372,879 @ 7.0% cap · market cap 12.47%
Zoning and permitted uses should be independently verified with authorities.
Property Analytics
Unlock full access to Insights
Subscribe to Realmo Intelligence
Open Analytics
Current Use
Location Intelligence
Trade Area within ½ mile
800
Businesses Nearby
Explore this area
Business Placement
Demographics for 03833, NH
22,662
Population
9,789
Households
2.3
Avg Household Size
47
Median Age
54%
College-Educated
98%
High-School Grad
48.5 sq mi
ZIP Area
467
Density / Sq Mi
$110,566
Median Household Income
$59,220
Median Earnings
$1,632
Median Rent
$456,000
Median Home Value
Check the figures for this property
Cap Rate, Value Estimation, Potential NOI and more
View Realmo Analytics

Questions? Ask Rey
Realmo’s AI knows this listing — price, zoning, demand, history. Ask anything.




Frequently Asked Questions
What type of property is this?
Commercial land - 1.5+ acre mixed-use development site in downtown Exeter, NH.
Where is this commercial land located?
The property is located at 48 Lincoln St Exeter, NH.
What is the asking price?
The asking price for this property is $2,990,000.
What are key features of this property?
This property features: Over 1.5 acres in downtown Exeter, NH; Located within the MUND Overlay District, allowing mixed‑use development; 16,000+ sq ft building with redevelopment potential**


