Renovated
For Sale
$689,000
17-19 Dartmouth Street, Exeter, NH 03833
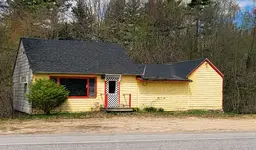
Side-by-side townhouse-style layout with three-bedroom units and separately metered services.
Property Size2,240 SF
Price / SF$307.59
Days on Market112
Property Features for 17-19 Dartmouth Street
General Information
Standard status
Active
Size
2,240 SF
Property subtype
Multi-family
Additional Details
Public Transit
Yes
Multifamily Units
2
Building Details
Year Built
1900
Year Renovated
2012
Buildings
1
Construction
townhouse-style
Listing Agency:
KW Coastal and Lakes & Mountains Realty/Exeter
Listed By:
Nancy Kingston
(603) 642-5171
Source:
Mbgre
Added: Jun 19
Changed: Oct 7
Last Checked: Oct 7 at 1:37PM
Displayed information is deemed reliable but is not guaranteed and should be independently verified. All listing content including descriptions, pricing, images are the copyrighted material of KW Coastal and Lakes & Mountains Realty/Exeter
Investment Insights
Based on property information with market context.
This side-by-side duplex contains two townhouse-style units, each offering 1,120 square feet and three bedrooms. The property was comprehensively renovated in 2012, including new electrical, plumbing, roofing, vinyl siding, insulation, and sheetrock. Kitchens and bathrooms were also remodeled, with laminate flooring and carpeting throughout the units.
Each side has its own wall-mounted hot water boiler, on-demand hot water heater, electric service, and metered water and sewer. The building dates to 1900 and is designated as lead safe inside and out.
Located at 17-19 Dartmouth Street in Exeter, the property sits on a dead-end street near downtown, with access to shopping, schools, restaurants, specialty shops, and the Amtrak train depot.
Each side has its own wall-mounted hot water boiler, on-demand hot water heater, electric service, and metered water and sewer. The building dates to 1900 and is designated as lead safe inside and out.
Located at 17-19 Dartmouth Street in Exeter, the property sits on a dead-end street near downtown, with access to shopping, schools, restaurants, specialty shops, and the Amtrak train depot.
Key Highlights
- Two‑unit duplex with 2,240 square feet total
- Each unit provides 1,120 sq ft and 3 bedrooms
- Comprehensive renovation completed in 2012
Financial Insights
Estimated NOI and Cap Rate
NOI / Yr
$37,735
Cap Rate
5.48%
Suggested Prices Based on Cap Rates
Cap Rate 5%
$754,700
$754.7K
Cap Rate 7%
$539,071
$539.1K
Cap Rate 9%
$419,278
$419.3K
Market Conditions
NOI Build-Up for 2,240 SF
Gross rent
$56.4K $25.20/SF
− Vacancy
−$2.5K −$1.13/SF
EGI
$53.9K $24.07/SF
− OpEx
−$16.2K −$7.22/SF
NOI
$37.7K $16.85/SF
Area
Rockingham County, NH
Vacancy
4.50%
Lease Rate
$25.20 /SF/Yr
Expense Ratio
30.00%
Simulate Cap Rate and NOI
Suggested Prices Based on Cap Rates
Cap Rate 5%
$754,700
Cap Rate 7%
$539,071
Cap Rate 9%
$419,278
Alternative Uses
Best Use
Multifamily LT 5
$539.1K
$471.7K – $628.9K
NOI $37,735 @ 7.0% cap · market cap 5.48%
Second Best
Apartment 5plus
$485.6K
$424.9K – $566.5K
NOI $33,991 @ 7.0% cap · market cap 4.93%
Theoretical Best
Office A
$745.8K
$652.5K – $870.1K
NOI $52,203 @ 7.0% cap · market cap 7.58%
Zoning and permitted uses should be independently verified with authorities.
Property Analytics
Unlock full access to Insights
Subscribe to Realmo Intelligence
Open Analytics
Current Use
Lease Details
2
Residential units
Location Intelligence
Trade Area within ½ mile
825
Businesses Nearby
Explore this area
Business Placement
Demographics for 03833, NH
22,662
Population
9,789
Households
2.3
Avg Household Size
47
Median Age
54%
College-Educated
98%
High-School Grad
48.5 sq mi
ZIP Area
467
Density / Sq Mi
$110,566
Median Household Income
$59,220
Median Earnings
$1,632
Median Rent
$456,000
Median Home Value
Check the figures for this property
Cap Rate, Value Estimation, Potential NOI and more
View Realmo Analytics
Market
Vacancy Rate% for Multifamily in Northeast region

Questions? Ask Rey
Realmo’s AI knows this listing — price, zoning, demand, history. Ask anything.




Frequently Asked Questions
What type of property is this?
Duplex - Side-by-side townhouse-style layout with three-bedroom units and separately metered services.
Where is this duplex located?
The property is located at 17-19 Dartmouth Street Exeter, NH.
What is the asking price?
The asking price for this property is $689,000.
What are key features of this property?
This property features: Two‑unit duplex with 2,240 square feet total; Each unit provides 1,120 sq ft and 3 bedrooms; Comprehensive renovation completed in 2012


