Palm Springs Industrial Property For
For Sale
$7,500,000
4775-4779 E Ramon Rd, Palm Springs, CA 92264
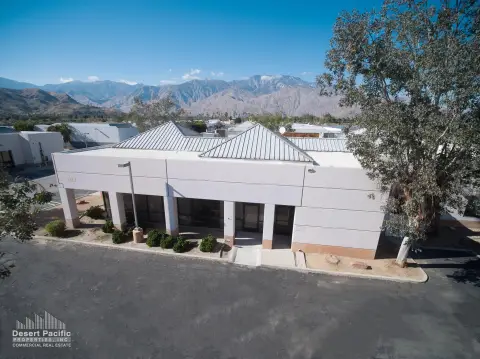
Three buildings on 2.03 acres near Palm Springs Airport.
Property Size45,000 SF
Lot Size2.03 Acres
Days on Market225
Property Features for 4775-4779 E Ramon Rd
General Information
Standard status
Active
Size
45,000 SF
Class
B
Lot size
2.03 Acres
Property subtype
Industrial
Building Details
Building Size
45,000 SF
Year Built
1940
Listing Agency:
Coldwell Banker Commercial Lyle & Associates
Listed By:
Rob Wenthold · License #CalDRE #01153834
(760) 641-7602
Source:
Cbclyle
Added: Mar 5
Changed: Oct 15
Last Checked: Oct 14 at 9:58PM
Displayed information is deemed reliable but is not guaranteed and should be independently verified. All listing content including descriptions, pricing, images are the copyrighted material of Coldwell Banker Commercial Lyle & Associates

Ask AI about this property
Review the available facts, identify missing information and prepare questions for the agent.
Investment Insights
Based on property information with market context.
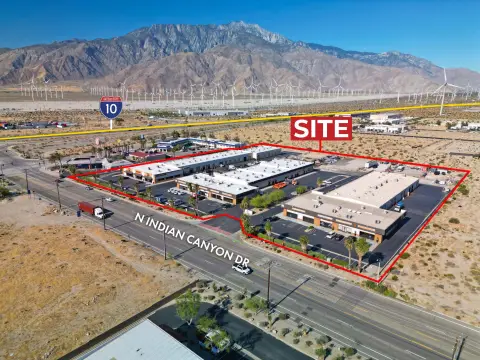
This unique property, situated in the City's center, comprises three buildings on a 2.03-acre parcel spanning from E. Ramon Road to E. Camino Parocella. Located on the south side of E. Ramon Road, between Williams Road and Gene Autry Trail, the property is strategically positioned in the highly desirable M-1 Zone, across from the Palm Springs International Airport and near the intersection of Ramon Road and Gene Autry Trail. The walled, fenced, and gated environment allows for monitored security. The property provides easy access to the 10 Freeway and other areas of the Coachella Valley, in addition to multiple yard areas and ample private parking.
Key Highlights
- Located in the highly desirable M‑1 Zone.
- Strategic location across from Palm Springs International Airport and near the intersection of Ramon Road/Gene Autry Trail.
- Consists of three separate buildings on a 2.03‑acre parcel spanning from E. Ramon Road to E. Camino Parocella.
Financial Insights
Estimated NOI and Cap Rate
NOI / Yr
$369,533
Cap Rate
4.93%
Suggested Prices Based on Cap Rates
Cap Rate 5%
$7,390,660
$7.4M
Cap Rate 7%
$5,279,043
$5.3M
Cap Rate 9%
$4,105,922
$4.1M
Market Conditions
NOI Build-Up for 45,000 SF
Gross rent
$561.6K $12.48/SF
− Vacancy
−$33.7K −$0.75/SF
EGI
$527.9K $11.73/SF
− OpEx
−$158.4K −$3.52/SF
NOI
$369.5K $8.21/SF
Area
Riverside County, CA
Vacancy
6.00%
Lease Rate
$12.48 /SF/Yr
Expense Ratio
30.00%
Simulate Cap Rate and NOI
Suggested Prices Based on Cap Rates
Cap Rate 5%
$7,390,660
Cap Rate 7%
$5,279,043
Cap Rate 9%
$4,105,922
Alternative Uses
Best Use
Industrial
$5.28M
$4.62M – $6.16M
NOI $369,533 @ 7.0% cap · market cap 4.93%
Second Best
—
—
no second resolved use
Theoretical Best
Office A
$13.48M
$11.80M – $15.73M
NOI $943,687 @ 7.0% cap · market cap 12.58%
Zoning and permitted uses should be independently verified with authorities.
How Realmo checks its estimates
Property Analytics
Unlock full access to Insights
Subscribe to Realmo Intelligence
Open Analytics
Current Use
Location Intelligence
Trade Area within ½ mile
636
Businesses Nearby
Explore this area
Business Placement
Demographics for 92264, CA
19,254
Population
17,518
Households
1.1
Avg Household Size
61
Median Age
48%
College-Educated
94%
High-School Grad
50.9 sq mi
ZIP Area
378
Density / Sq Mi
$75,246
Median Household Income
$46,756
Median Earnings
$1,581
Median Rent
$498,200
Median Home Value
Check the figures for this property
Cap Rate, Value Estimation, Potential NOI and more
View Realmo Analytics
Market
Vacancy Rate% for Industrial in West region







Frequently Asked Questions
What type of property is this?
Industrial property - Three buildings on 2.03 acres near Palm Springs Airport.
Where is this industrial property located?
The property is located at 4775-4779 E Ramon Rd Palm Springs, CA.
What is the asking price?
The asking price for this property is $7,500,000.
What are key features of this property?
This property features: Located in the highly desirable M‑1 Zone.; Strategic location across from Palm Springs International Airport and near the intersection of Ramon Road/Gene Autry Trail.; Consists of three separate buildings on a 2.03‑acre parcel spanning from E. Ramon Road to E. Camino Parocella.


