24-Unit Apartment Community with
For Sale
$3,500,000
1433 1455 N Indian Canyon Drive, Palm Springs, CA 92262
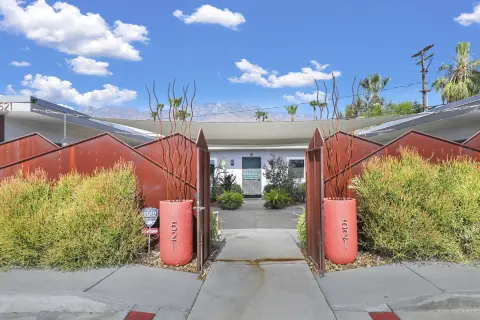
Sunset Palms Apartments offers studios, one- and two-bedroom units with upgraded interiors, plus two gated pool courtyards and open parking.
Property Size11,183 SF
Days on Market87
Property Features for 1433 1455 N Indian Canyon Drive
General Information
Standard status
Active
Size
11,183 SF
Property subtype
Apartment
Additional Details
Cap Rate
5.5%
Multifamily Units
24
Building Details
Building Size
11,183 SF
Year Built
1936
Tenancy
Multi
Listing Agency:
Triqor Group
Listed By:
Ryan Loria · License #02006138
(949) 756-3232
Source:
Velocityrealtysd
Added: Jul 17
Changed: Oct 8
Last Checked: Oct 9 at 11:43PM
Displayed information is deemed reliable but is not guaranteed and should be independently verified. All listing content including descriptions, pricing, images are the copyrighted material of Triqor Group
Investment Insights
Based on property information with market context.
Sunset Palms Apartments is a well-maintained 24-unit apartment community offering studios, one-bedroom, and two-bedroom units across three side-by-side individual parcels. Many units feature wood-look porcelain tile flooring, upgraded kitchens and bathrooms, stainless steel sinks, and new dual-pane windows and sliding glass doors. Community improvements include two swimming pools located within gated courtyards, along with new ductless mini split heating and air conditioning systems and ample open parking.
The property is presented for sale as a value-add investment opportunity. It is currently generating a 5.5% cap rate on in-place rents, with an indicated 28% upside in rental income and the potential to achieve an 8.2% cap rate as rents are brought to market.
Overall, the mix and recent interior and mechanical upgrades support a straightforward strategy to improve operating performance through rent management within the existing apartment configuration.
The property is presented for sale as a value-add investment opportunity. It is currently generating a 5.5% cap rate on in-place rents, with an indicated 28% upside in rental income and the potential to achieve an 8.2% cap rate as rents are brought to market.
Overall, the mix and recent interior and mechanical upgrades support a straightforward strategy to improve operating performance through rent management within the existing apartment configuration.
Key Highlights
- 24‑unit apartment community built in 1936 in Palm Springs, CA
- Unit mix includes studios, 1‑bedroom, and 2‑bedroom units across three side‑by‑side individual parcels
- Most units feature upgraded wood‑look porcelain tile floors, upgraded kitchens and bathrooms, and dual pane windows/sliding glass doors
Financial Insights
Estimated NOI and Cap Rate
NOI / Yr
$181,014
Cap Rate
5.17%
Suggested Prices Based on Cap Rates
Cap Rate 5%
$3,620,280
$3.6M
Cap Rate 7%
$2,585,914
$2.6M
Cap Rate 9%
$2,011,267
$2.0M
Market Conditions
NOI Build-Up for 11,183 SF
Gross rent
$335.5K $30.00/SF
− Vacancy
−$6.4K −$0.57/SF
EGI
$329.1K $29.43/SF
− OpEx
−$148.1K −$13.24/SF
NOI
$181.0K $16.19/SF
Area
Riverside County, CA
Vacancy
1.90%
Lease Rate
$30.00 /SF/Yr
Expense Ratio
45.00%
Simulate Cap Rate and NOI
Suggested Prices Based on Cap Rates
Cap Rate 5%
$3,620,280
Cap Rate 7%
$2,585,914
Cap Rate 9%
$2,011,267
Alternative Uses
Best Use
Apartment 5plus
$2.59M
$2.26M – $3.02M
NOI $181,014 @ 7.0% cap · market cap 5.17%
Second Best
—
—
no second resolved use
Theoretical Best
Office A
$3.35M
$2.93M – $3.91M
NOI $234,517 @ 7.0% cap · market cap 6.70%
Zoning and permitted uses should be independently verified with authorities.
Property Analytics
Unlock full access to Insights
Subscribe to Realmo Intelligence
Open Analytics
Current Use
Lease Details
24
Residential units
Multi-tenant
Tenancy
Location Intelligence
Trade Area within ½ mile
1,448
Businesses Nearby
Explore this area
Business Placement
Demographics for 92262, CA
26,593
Population
19,940
Households
1.3
Avg Household Size
54
Median Age
42%
College-Educated
93%
High-School Grad
35.1 sq mi
ZIP Area
758
Density / Sq Mi
$70,514
Median Household Income
$42,940
Median Earnings
$1,420
Median Rent
$600,600
Median Home Value
Check the figures for this property
Cap Rate, Value Estimation, Potential NOI and more
View Realmo Analytics
Market
Vacancy Rate% for Multifamily in West region

Questions? Ask Rey
Realmo’s AI knows this listing — price, zoning, demand, history. Ask anything.




Frequently Asked Questions
What type of property is this?
Apartment building - Sunset Palms Apartments offers studios, one- and two-bedroom units with upgraded interiors, plus two gated pool courtyards and open parking.
Where is this apartment building located?
The property is located at 1433 1455 N Indian Canyon Drive Palm Springs, CA.
What is the asking price?
The asking price for this property is $3,500,000.
What are key features of this property?
This property features: 24‑unit apartment community built in 1936 in Palm Springs, CA; Unit mix includes studios, 1‑bedroom, and 2‑bedroom units across three side‑by‑side individual parcels; Most units feature upgraded wood‑look porcelain tile floors, upgraded kitchens and bathrooms, and dual pane windows/sliding glass doors


