Denver Industrial Property with
For Sale
Contact for pricing
4755 Washington St, Denver, CO
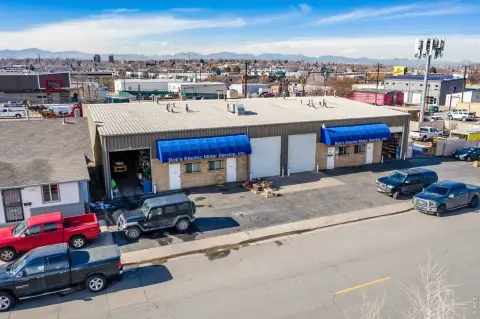
Industrial property in central Denver with fenced yard space.
Property Size18,955 SF
Lot Size0.85 Acres
Price / SF$125.56
Days on Market336
Property Features for 4755 Washington St
General Information
Standard status
Active
Size
18,955 SF
Lot size
0.85 Acres
Property subtype
INDUSTRIAL
Lease Type
NNN
Site & Location
Neighborhood
Globeville
Properties For Sale
at 4755 Washington St
4755 Washington St
AVAILABLE, Now
Floor
Bldg
Size
18,987 SF
Type
INDUSTRIAL
Lease Type
NNN
Sublease
No
- ±0.30 Acre fenced parking/yard area (paved and gravel)
- New office refresh
- New LED lighting and unit heaters in the warehouse
- Oversized drive-in doors with drive thru bays
- Central Denver location within minutes of Downtown Denver and multiple thoroughfares
- Potential redevelopment opportunity
Contact us
Listing Agency:
Cushman & Wakefield | Denver
(303) 292-3700
Listed By:
Joe Krahn · License #FA.100019052
(970) 218-4436
Source:
Moodyscre
Added: Nov 24, 2025
Changed: Oct 25
Last Checked: Oct 24 at 9:04PM
Displayed information is deemed reliable but is not guaranteed and should be independently verified. All listing content including descriptions, pricing, images are the copyrighted material of Cushman & Wakefield | Denver

Ask AI about this property
Review the available facts, identify missing information and prepare questions for the agent.
Investment Insights
Based on property information with market context.
Located near the intersection of I-70 and I-25, the property at 4755 Washington Street is situated in Denver's central submarket. The site benefits from its proximity to Downtown Denver and major thoroughfares. The property includes 0.5 acres of fenced yard space at building 1. Zoned for mixed industrial use, this site offers opportunities for industrial tenants and users. The property has a size of 18955 square feet.
Key Highlights
- Ideal Central Denver location right off I‑70 and I‑25.
- Mixed industrial use zoning.
- Immediate proximity to Downtown Denver and major thoroughfares.
Financial Insights
Estimated NOI and Cap Rate
NOI / Yr
$195,874
Cap Rate
8.23%
Suggested Prices Based on Cap Rates
Cap Rate 5%
$3,917,480
$3.9M
Cap Rate 7%
$2,798,200
$2.8M
Cap Rate 9%
$2,176,378
$2.2M
Market Conditions
NOI Build-Up for 18,955 SF
Gross rent
$250.2K $13.20/SF
− Vacancy
−$19.8K −$1.04/SF
EGI
$230.4K $12.16/SF
− OpEx
−$34.6K −$1.82/SF
NOI
$195.9K $10.33/SF
Area
Denver, CO
Vacancy
7.90%
Lease Rate
$13.20 /SF/Yr
Expense Ratio
15.00%
Simulate Cap Rate and NOI
Suggested Prices Based on Cap Rates
Cap Rate 5%
$3,917,480
Cap Rate 7%
$2,798,200
Cap Rate 9%
$2,176,378
Alternative Uses
Best Use
Warehouse
$2.80M
$2.45M – $3.26M
NOI $195,874 @ 7.0% cap · market cap 8.23%
Second Best
Flex RnD
$2.53M
$2.21M – $2.95M
NOI $176,827 @ 7.0% cap · market cap 7.43%
Theoretical Best
Office A
$6.03M
$5.28M – $7.04M
NOI $422,384 @ 7.0% cap · market cap 17.75%
Zoning and permitted uses should be independently verified with authorities.
How Realmo checks its estimates
Property Analytics
Unlock full access to Insights
Subscribe to Realmo Intelligence
Open Analytics
Current Use
Location Intelligence
Trade Area within ½ mile
659
Businesses Nearby
Balanced
Demand for This Use
Explore this area
Business Placement
Check the figures for this property
Cap Rate, Value Estimation, Potential NOI and more
View Realmo Analytics
Market
Vacancy Rate% for Industrial in Denver, CO


Similar Off Market Nearby
- StorQuest Self Storage — 4501 Washington St, Denver, CO 80216
- Two Men With Big Hearts Moving And Storage — 5203 Lincoln St, Denver, CO 80216
Frequently Asked Questions
What type of property is this?
Warehouse - Industrial property in central Denver with fenced yard space.
Where is this warehouse located?
The property is located at 4755 Washington St Denver, CO.
What is the asking price?
The asking price for this property is $2,380,000.
What are key features of this property?
This property features: Ideal Central Denver location right off I‑70 and I‑25.; Mixed industrial use zoning.; Immediate proximity to Downtown Denver and major thoroughfares.