Historic Mixed-Use
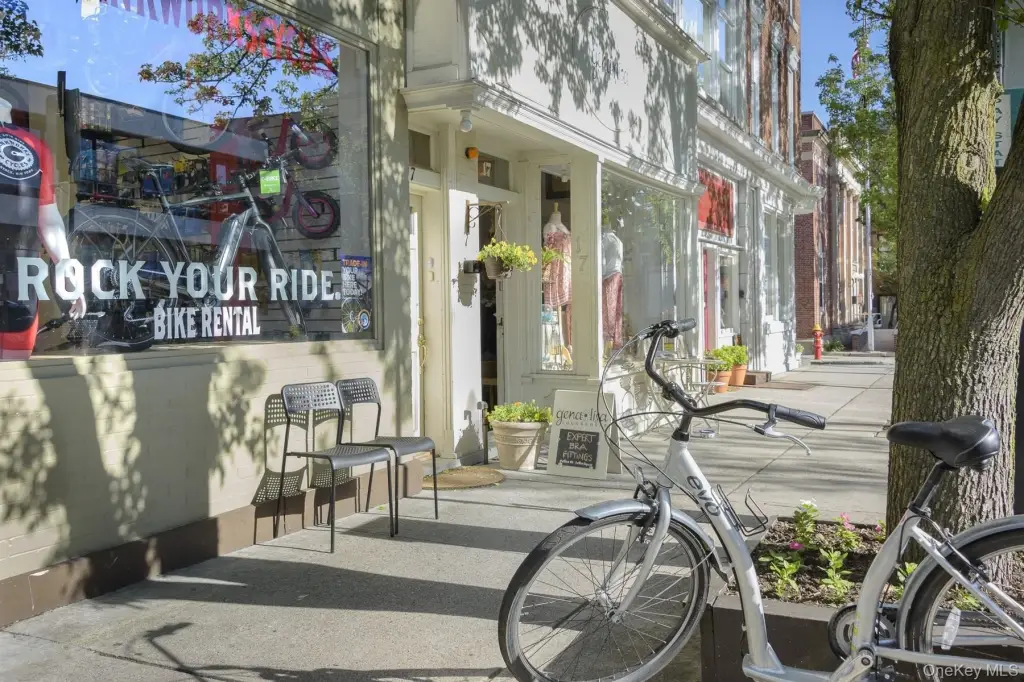
For Sale
$1,850,000
46 South Broadway, Nyack, NY 10960
Commercial Sale, Nyack, NY
Property Size5,000 SF
Lot Size0.17 Acres
Price / SF$370
Days on Market330
Property Features for 46 South Broadway
General Information
Property type
Commercial Sale
Property subtype
Other
Zoning
DMU-1
Rooms
Basement
Parking
6
Parking features
Assigned, Driveway, Garage
Security features
Security
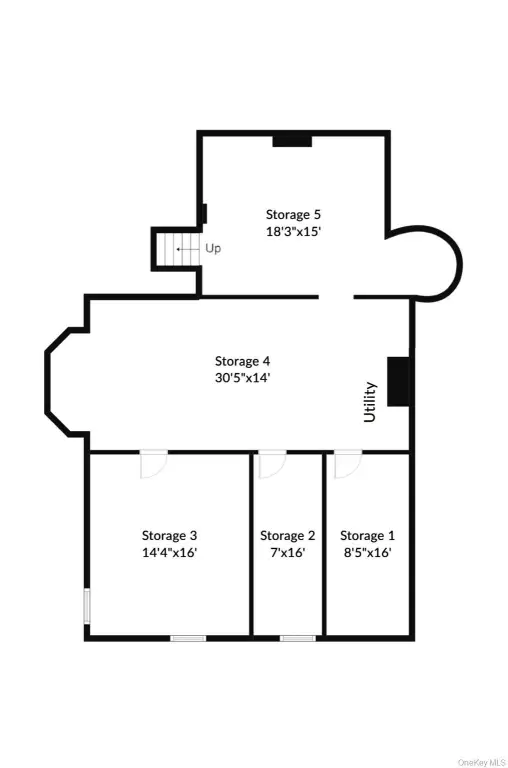
Basement
Storage Space, Walk-Out Access, Unfinished
Accessibility
Accessible Approach with Ramp
Appliances
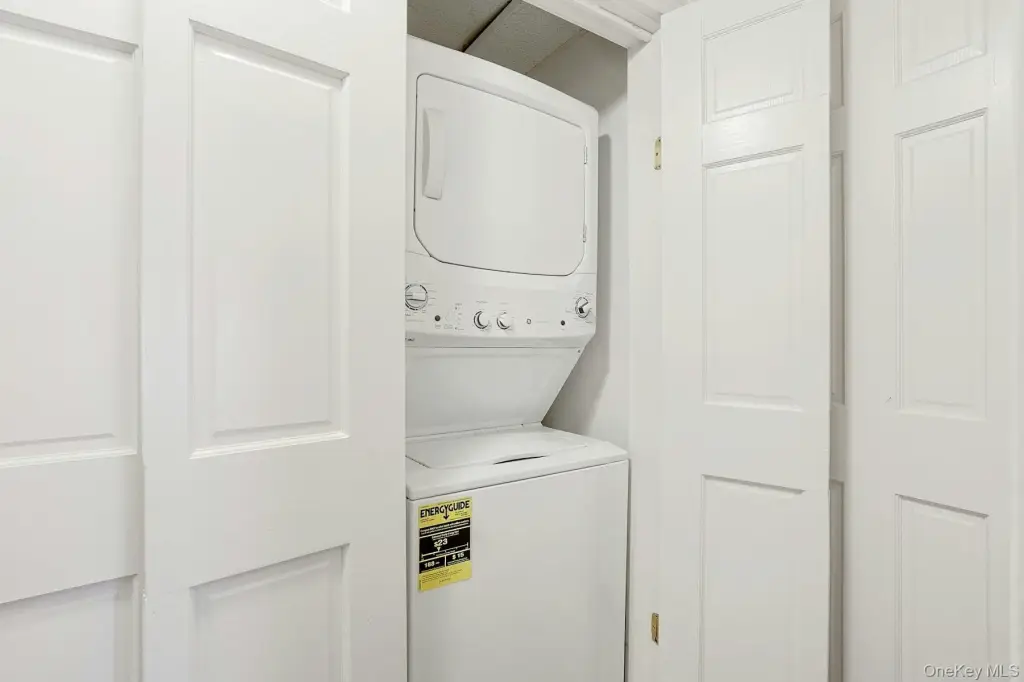
Dishwasher, Dryer, Gas Oven, Microwave, Refrigerator, Washer, Gas Water Heater
Lot features
Corner Lot, Garden, Landscaped, Near Public Transit, Paved, Sprinklers In Front, Views
View
River, City
Elementary school
Liberty Elementary School
Middle school
Nyack Middle School
High school
Nyack Senior High School
Elementary school district
Nyack
Middle school district
Nyack
High school district
Nyack
Directions
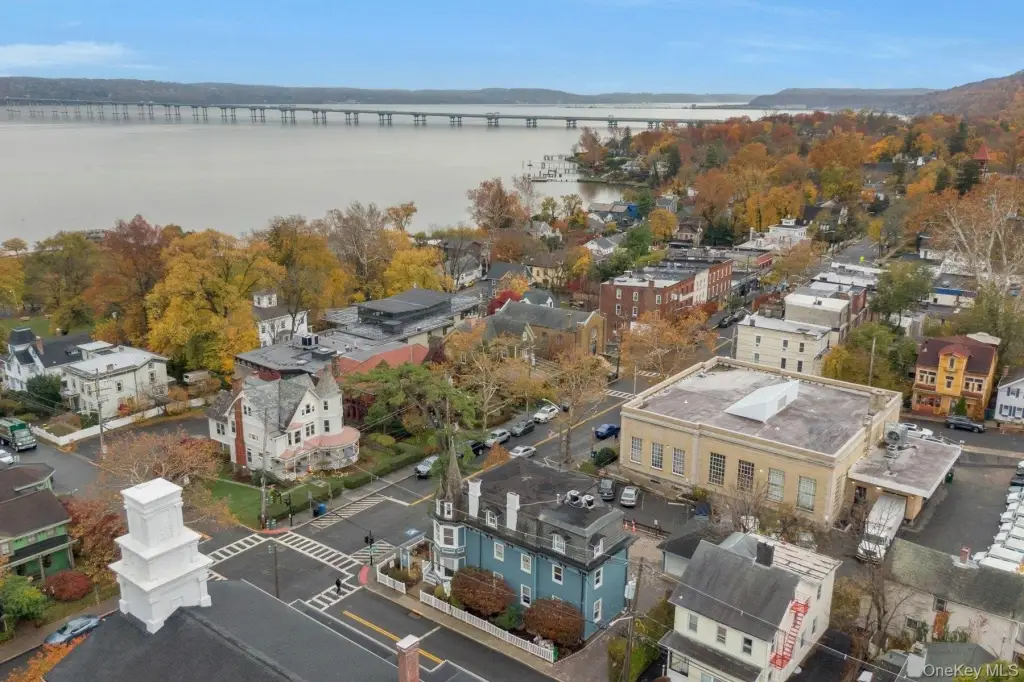
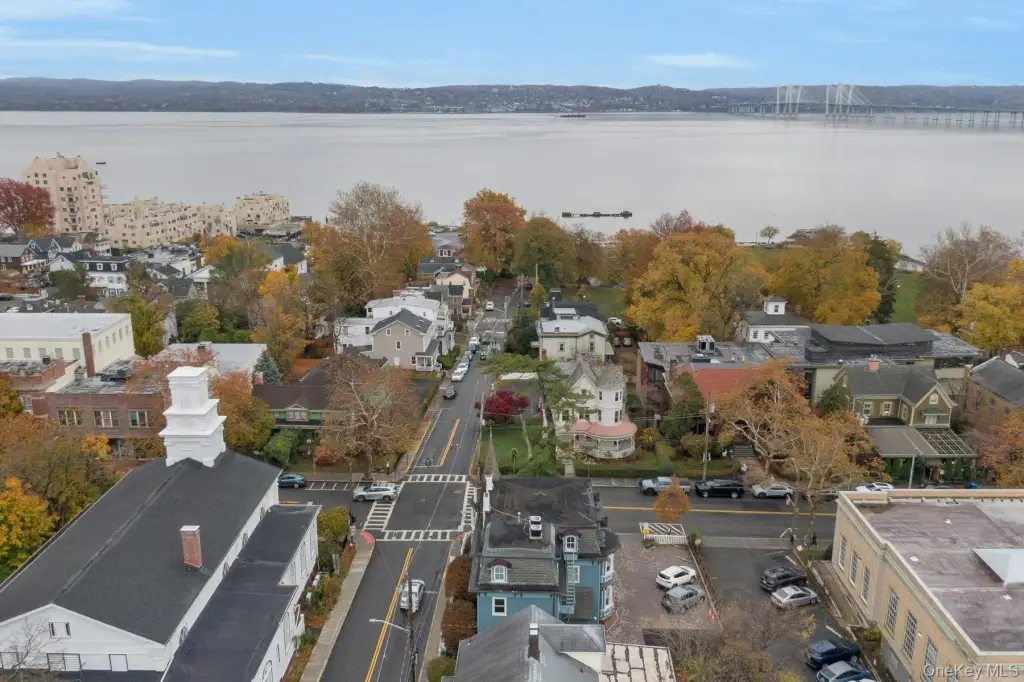
Corner of South Broadway & Depew. Next door to Nyack Post Office.
Standard status
Active
APN
39240306604600010030000000
Lot size
0.17 Acres
Taxes and HOA fees
Tax Year
2025
Tax Annual Amount
37050
Utilities
Utilities
Phone Available
Sewer type
Public Sewer
Heating system
Forced Air, Natural Gas
Cooling system
Central Air
Water source
Public
Building Details
Year built
1854
Floors in Building
3
Number of units
3
Flooring type
Carpet, Tile - Ceramic, Hardwood
Building materials
Clapboard, Wood Siding
Listing Agency:
Ellis Sotheby's Intl Realty · Sotheby's International Realty
(845) 353-4250
Listed By:
Nancy M Swaab
(845) 641-6583
Added: Nov 12, 2025
Changed: Oct 7
Last Checked: Oct 8 at 4:06AM
MLS# 933091
Copyright © 2026 OneKey MLS. All rights reserved. All information provided by the listing agent/broker is deemed reliable but is not guaranteed and should be independently verified.
Investment Insights
Based on property information with market context.
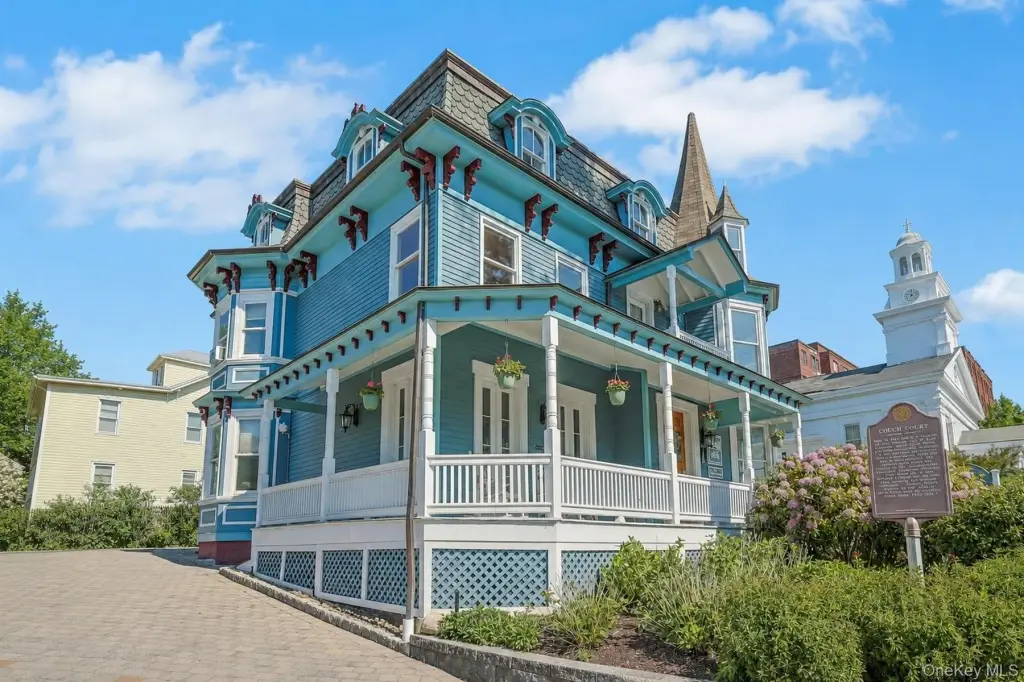
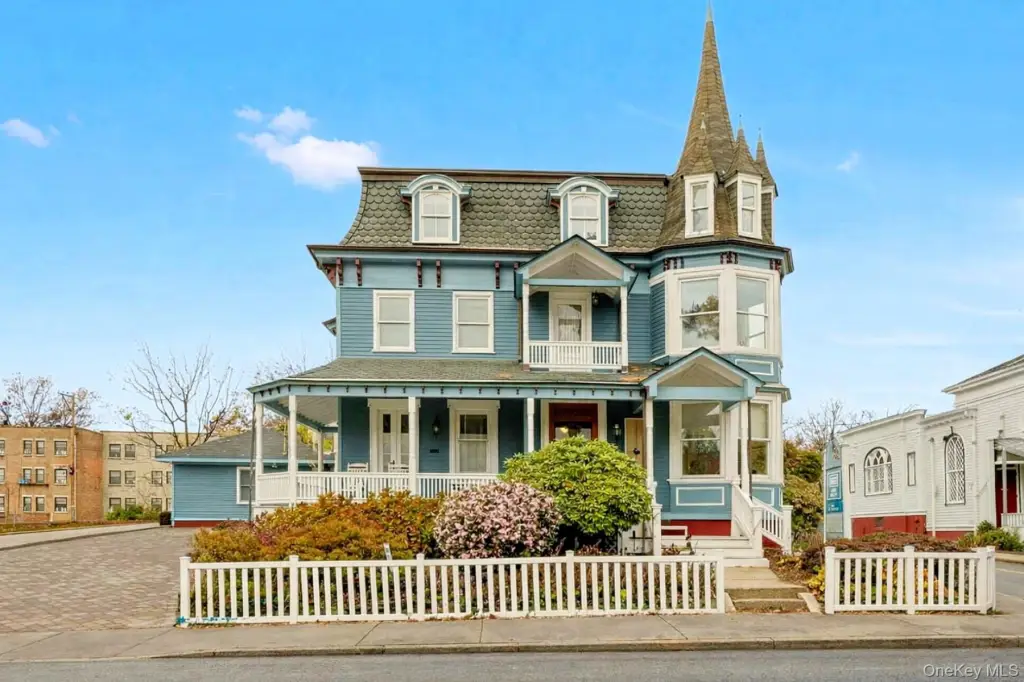
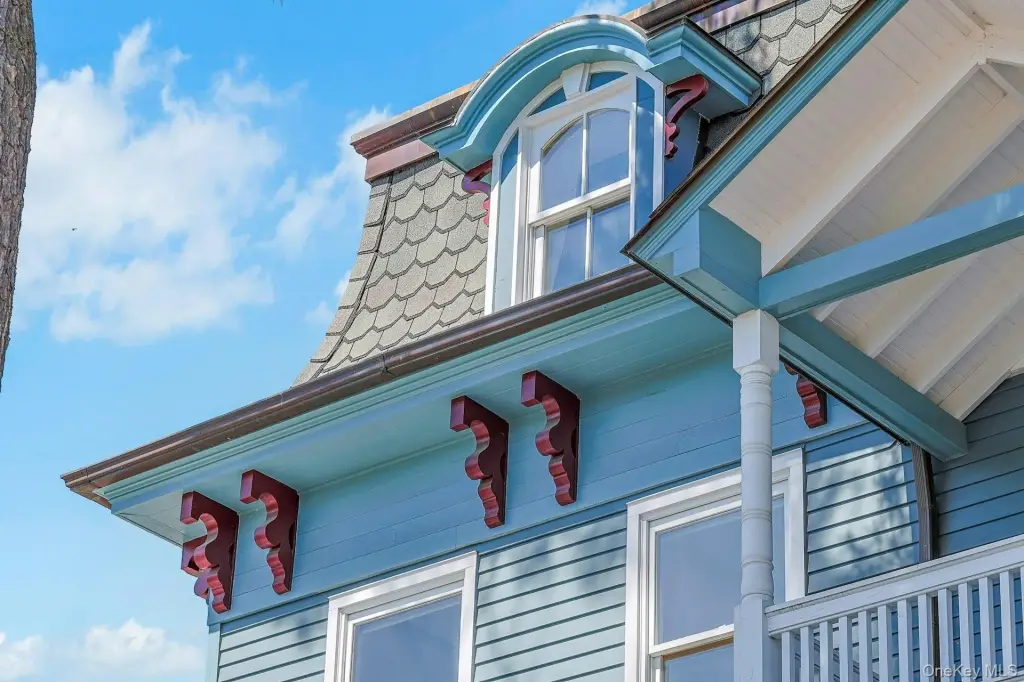
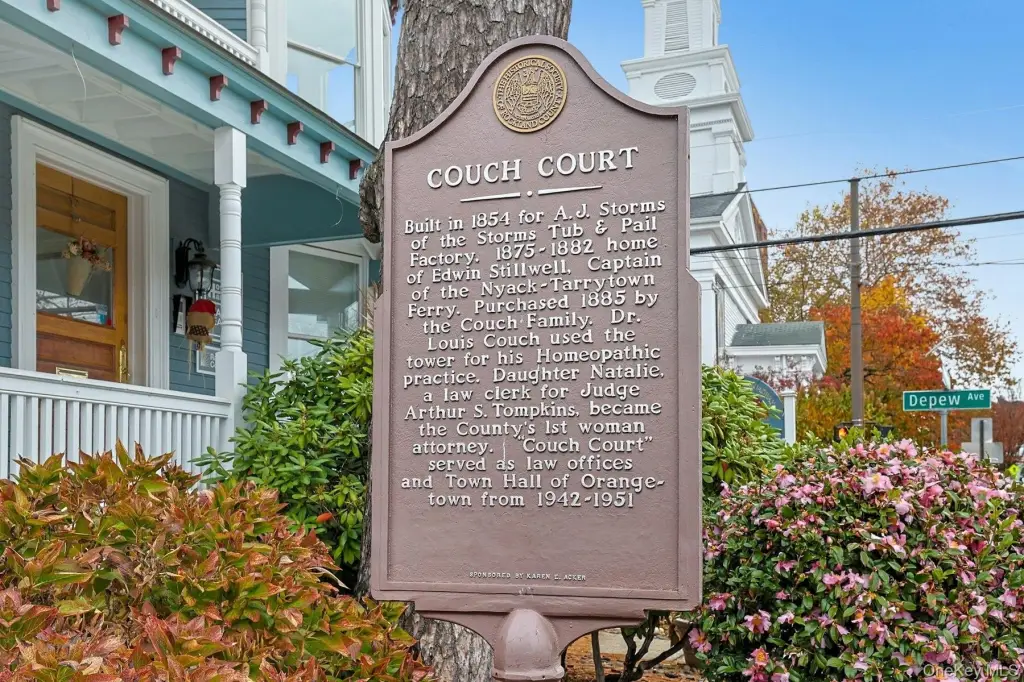
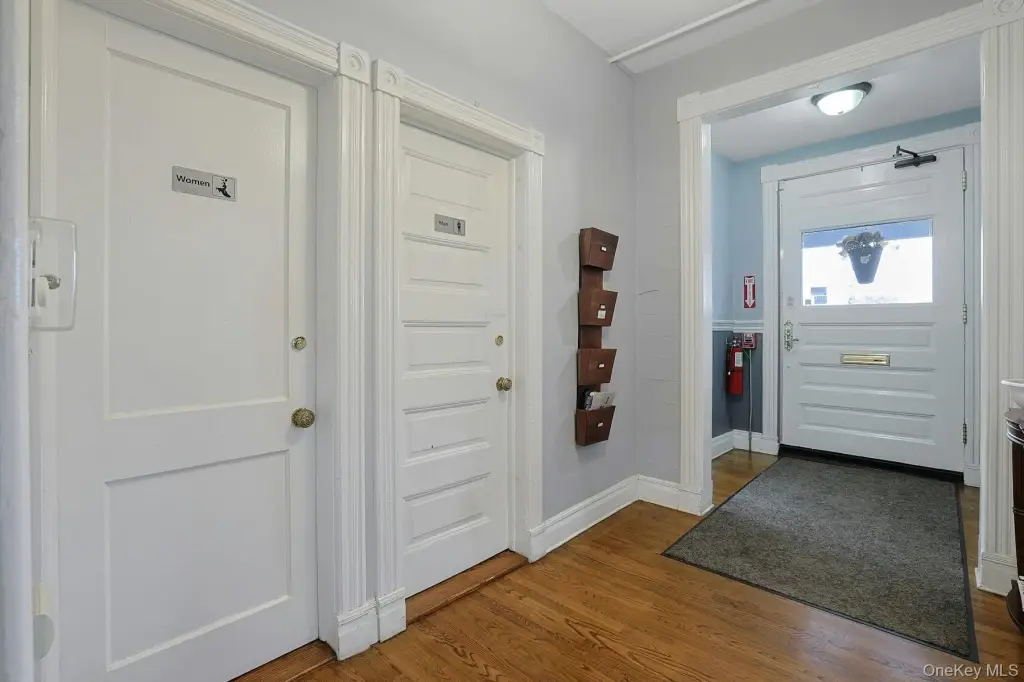
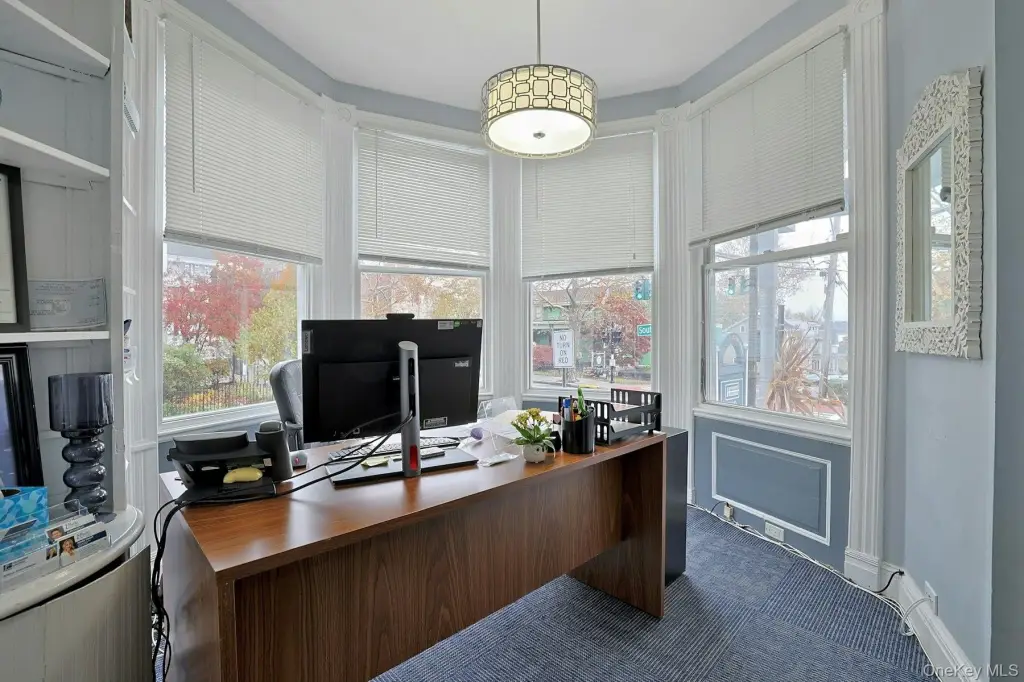
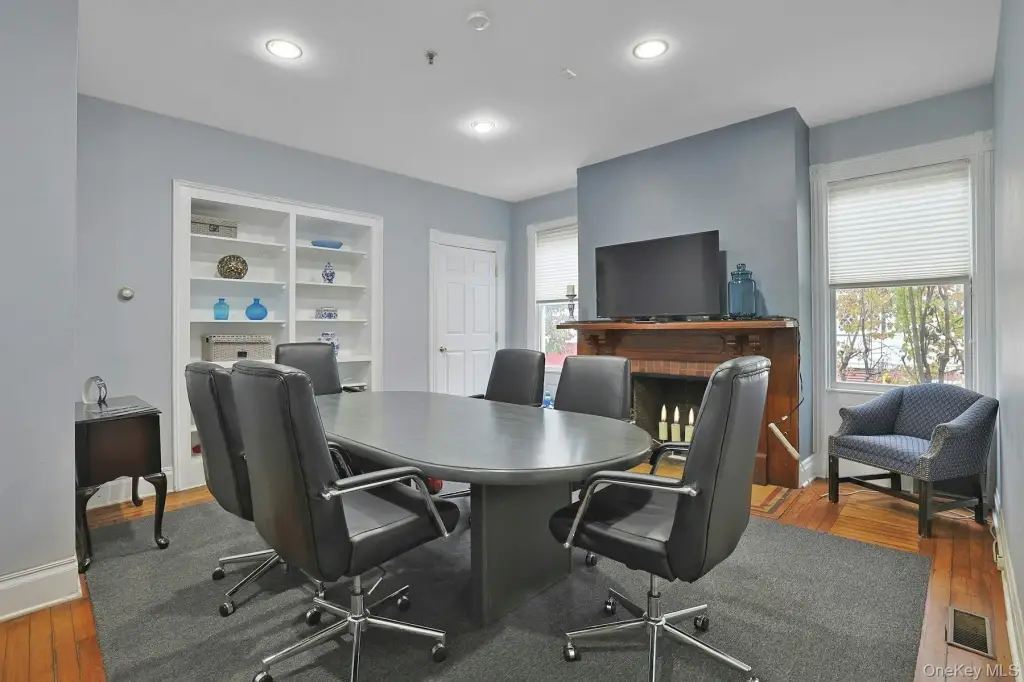
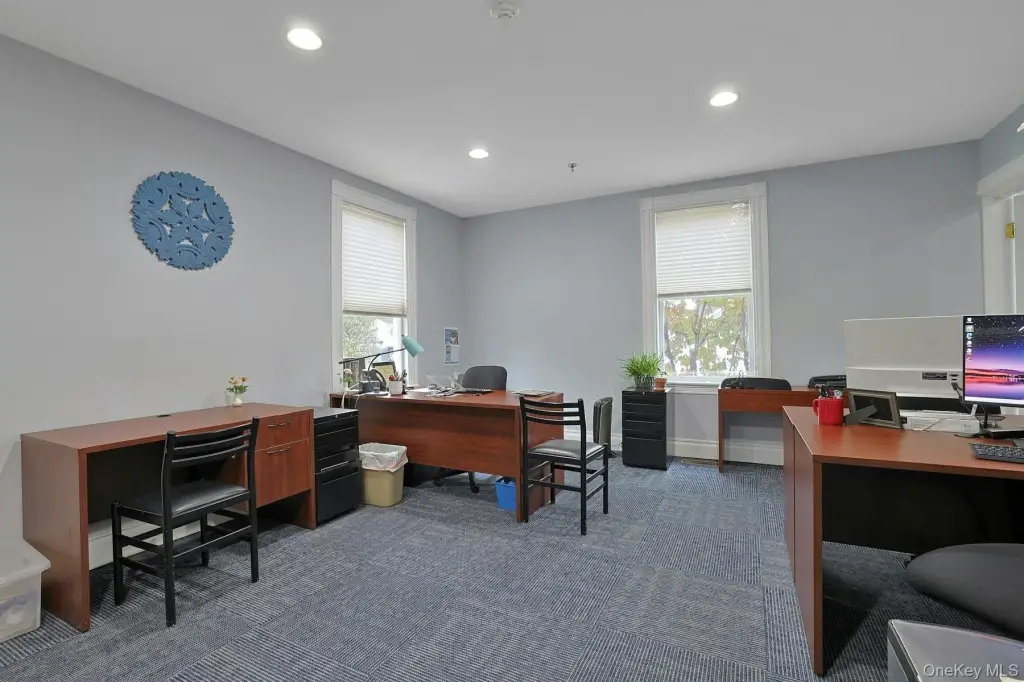
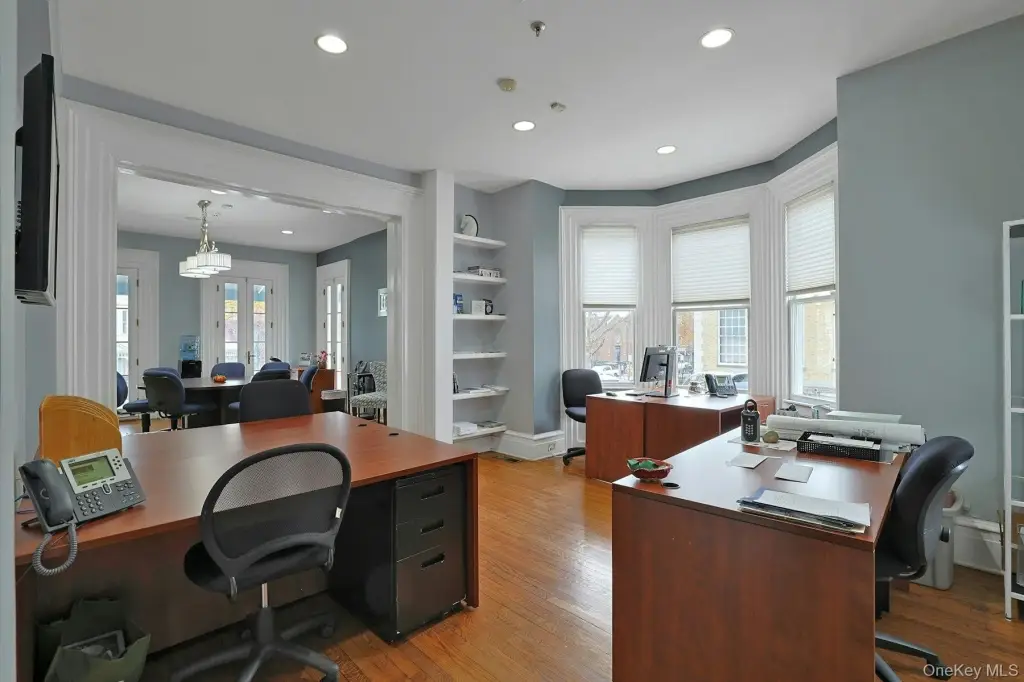
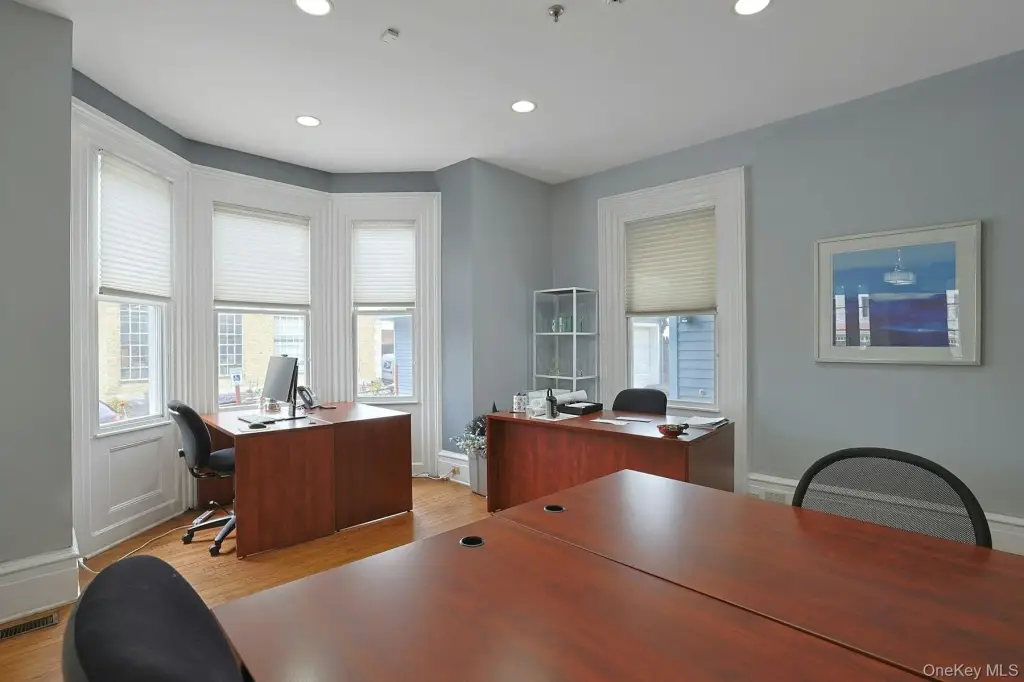
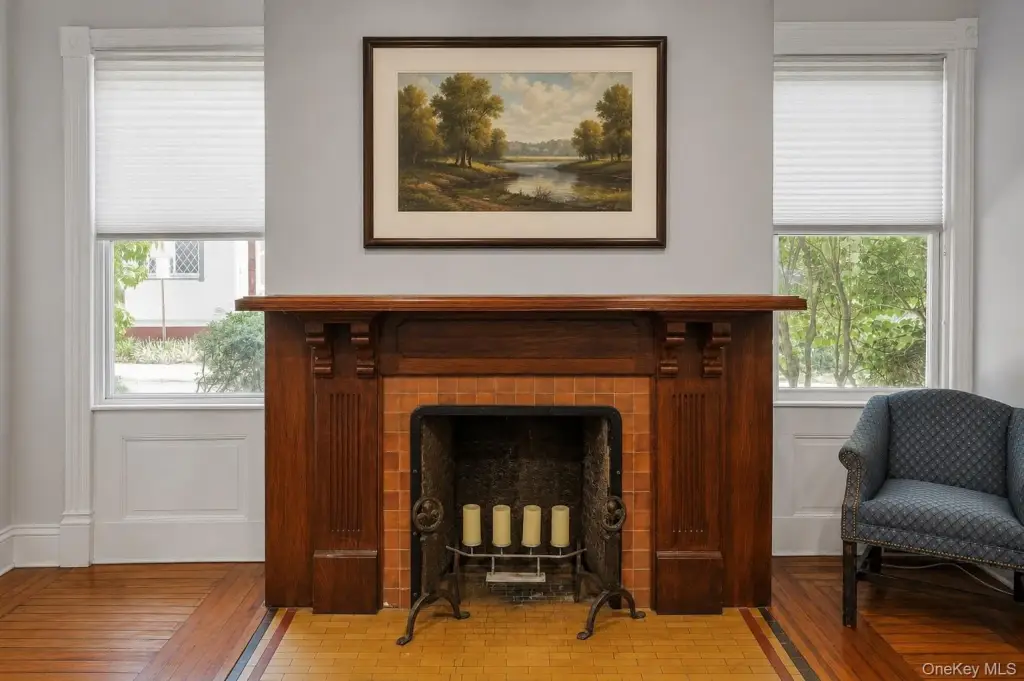
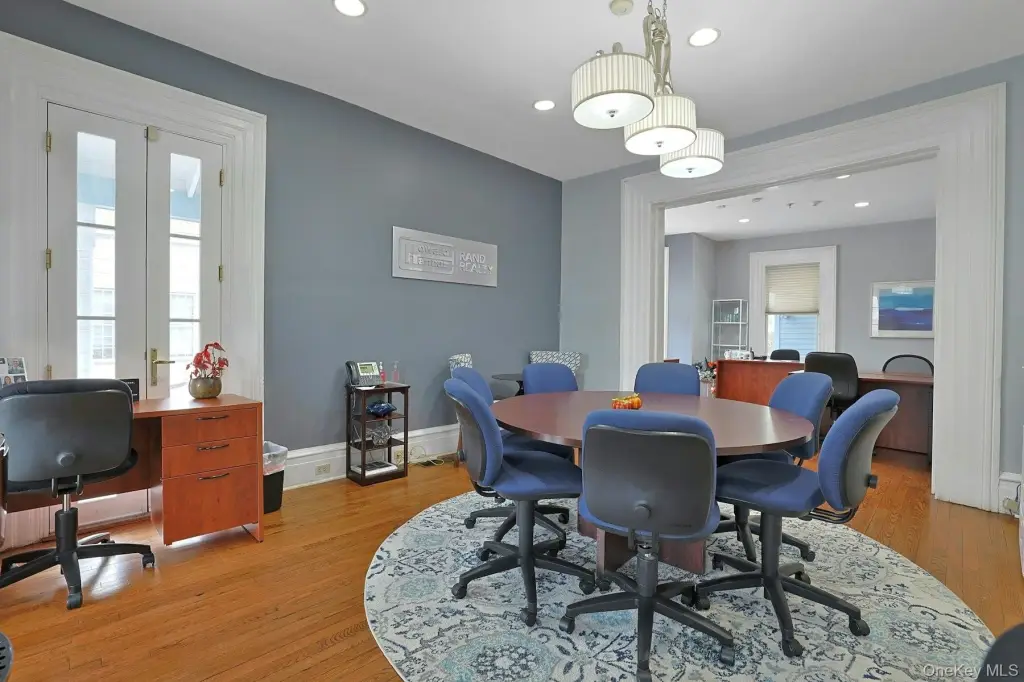
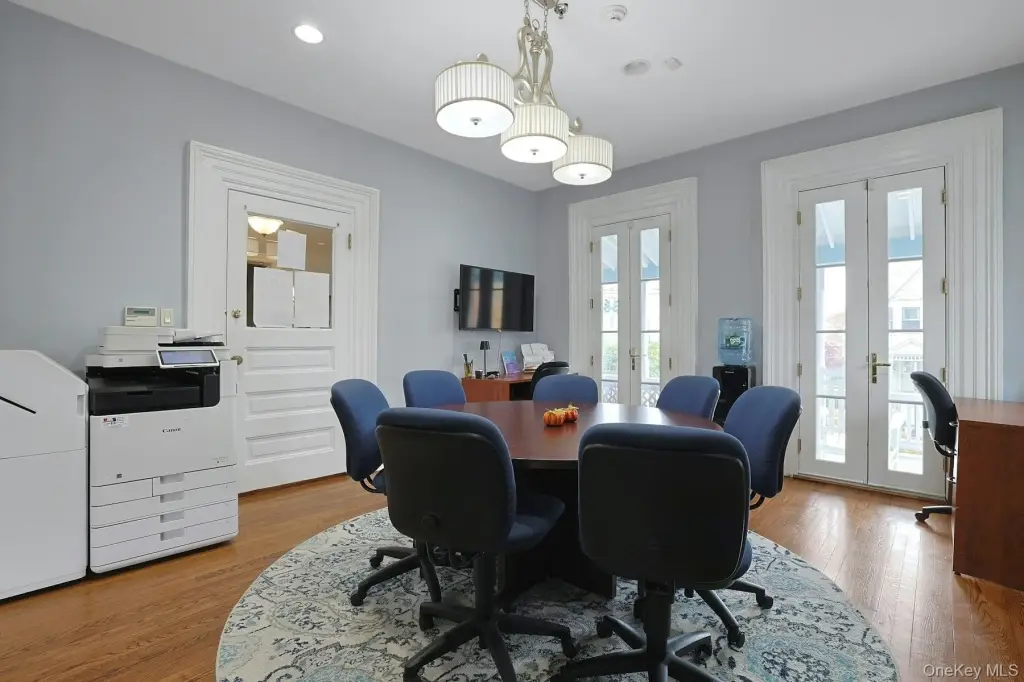
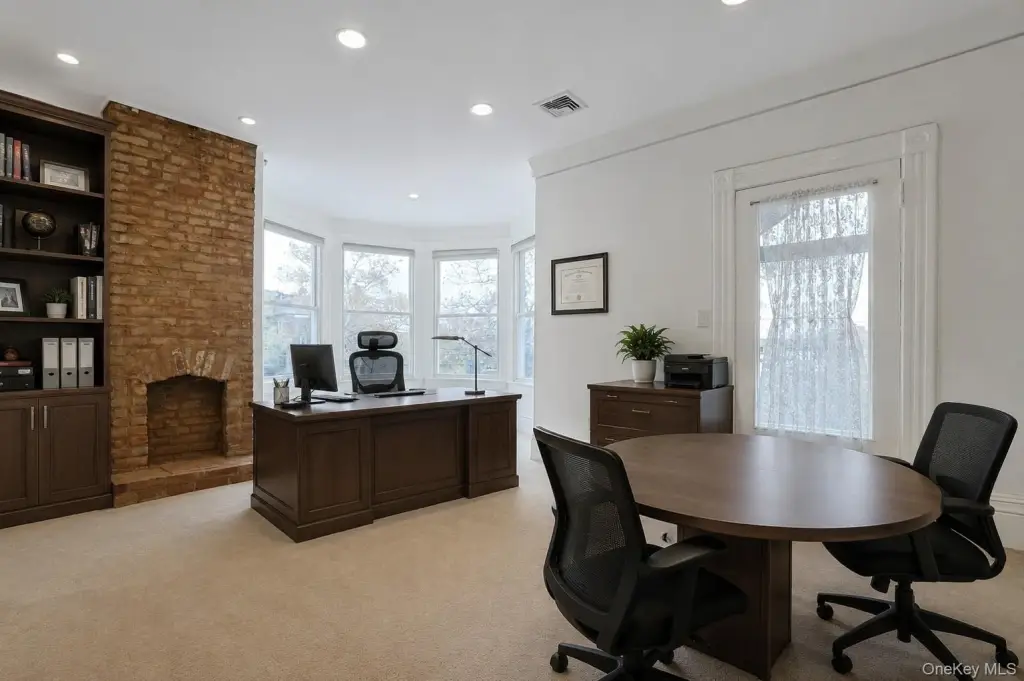
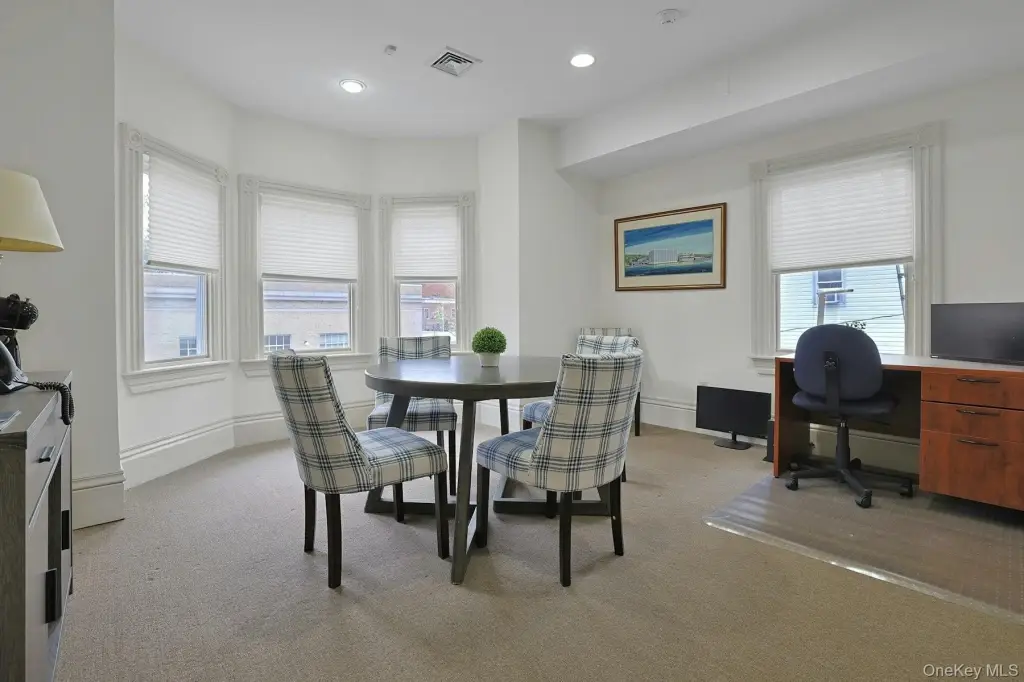
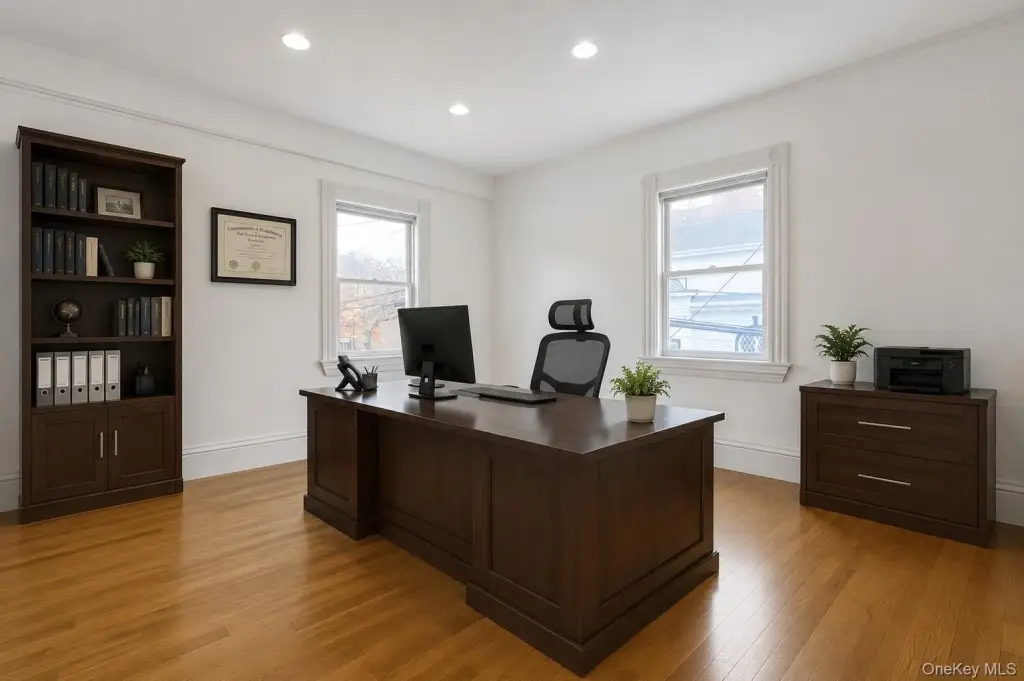
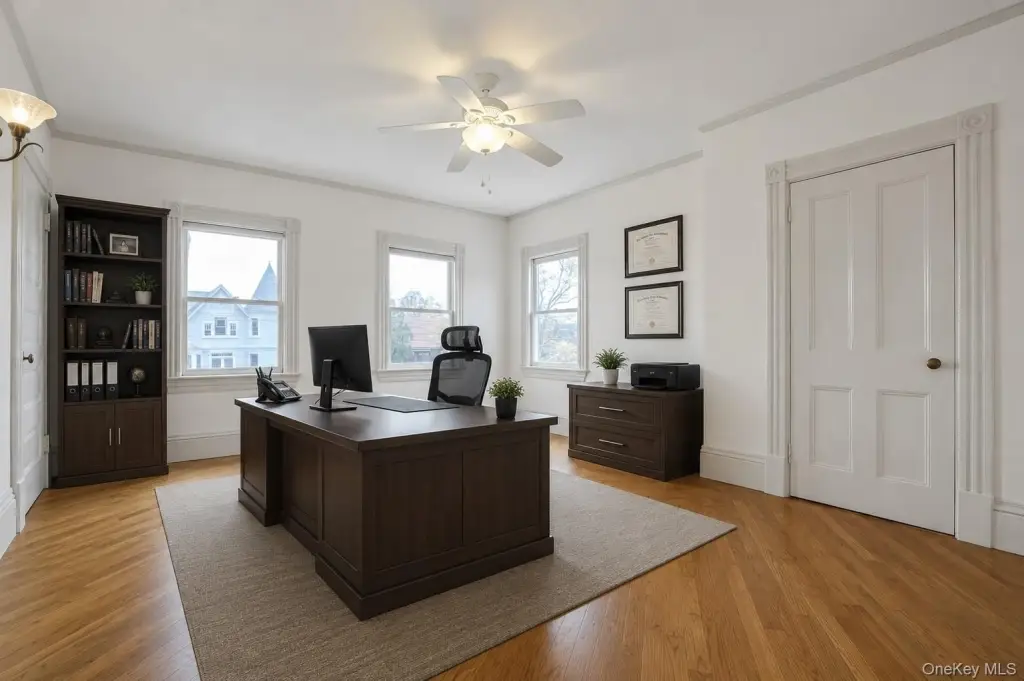
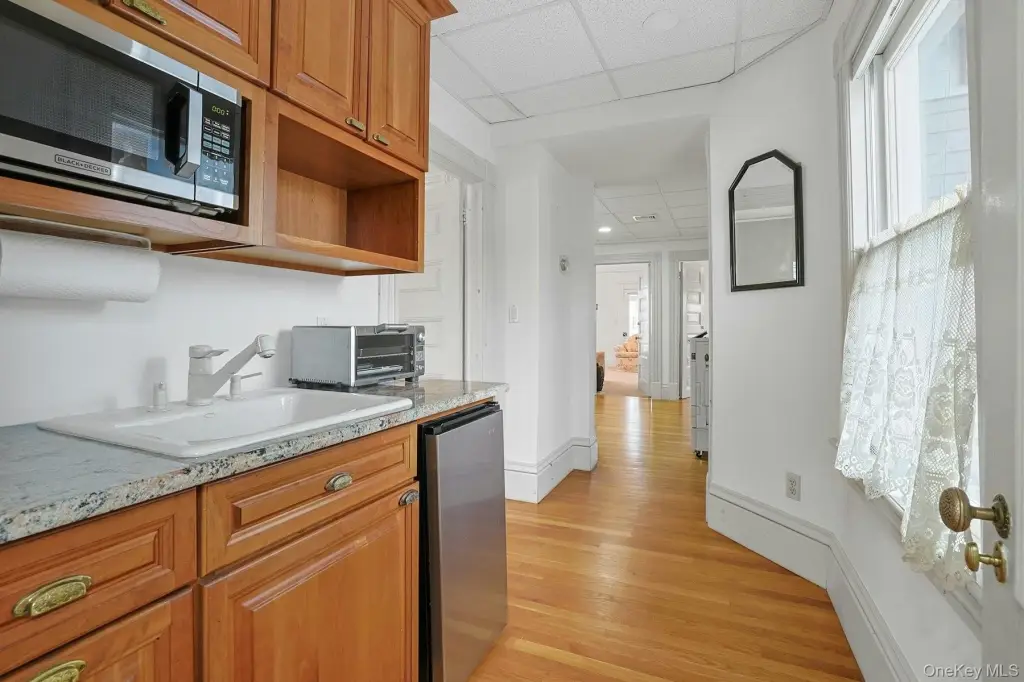
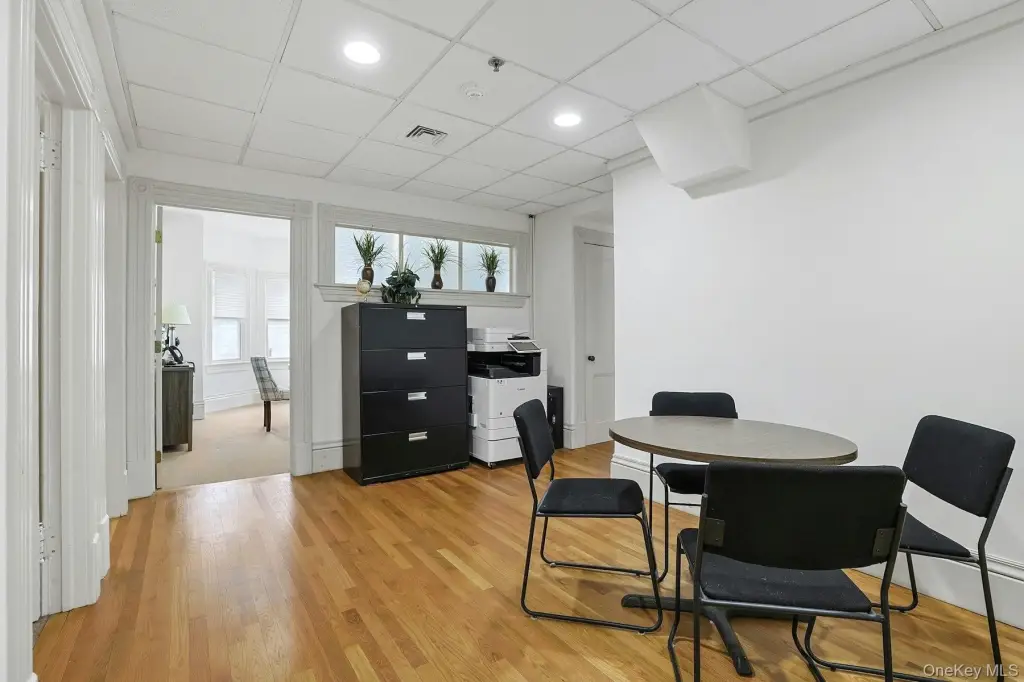
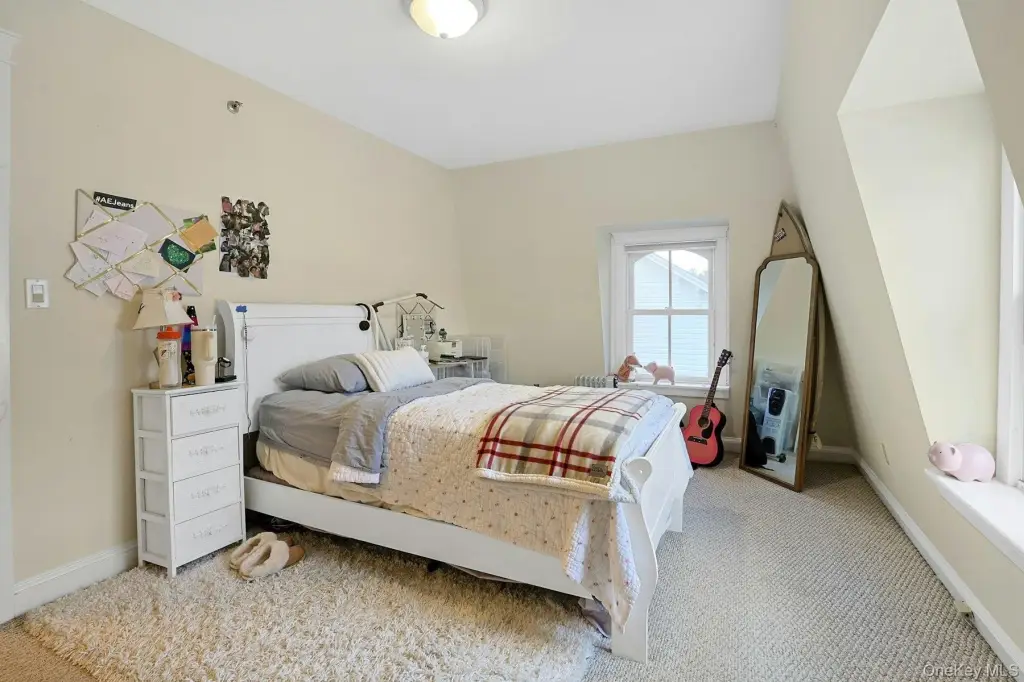
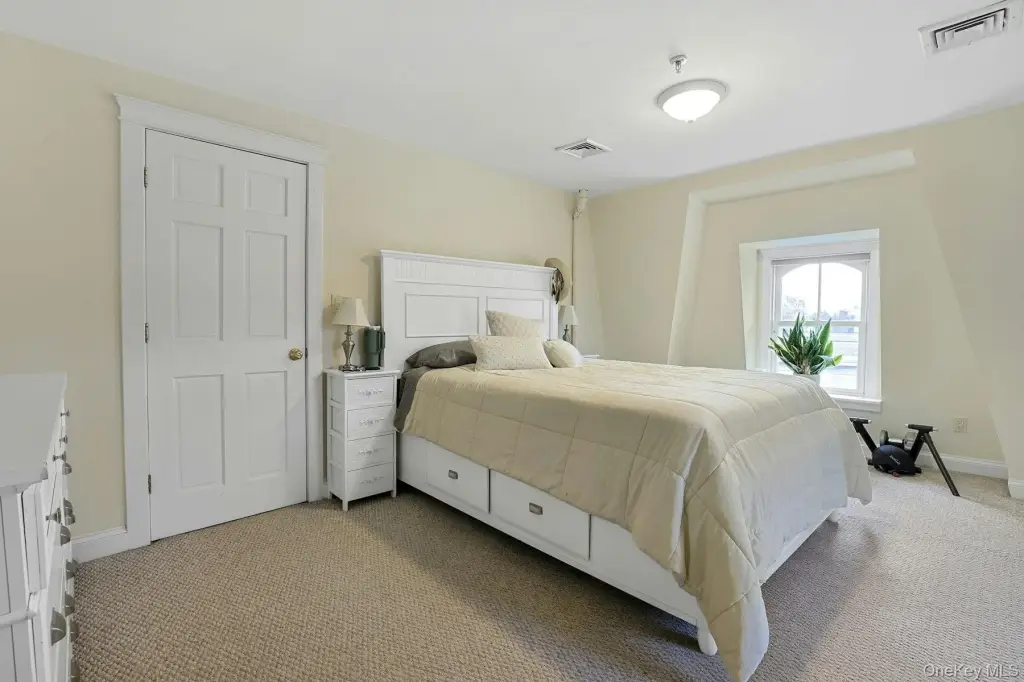
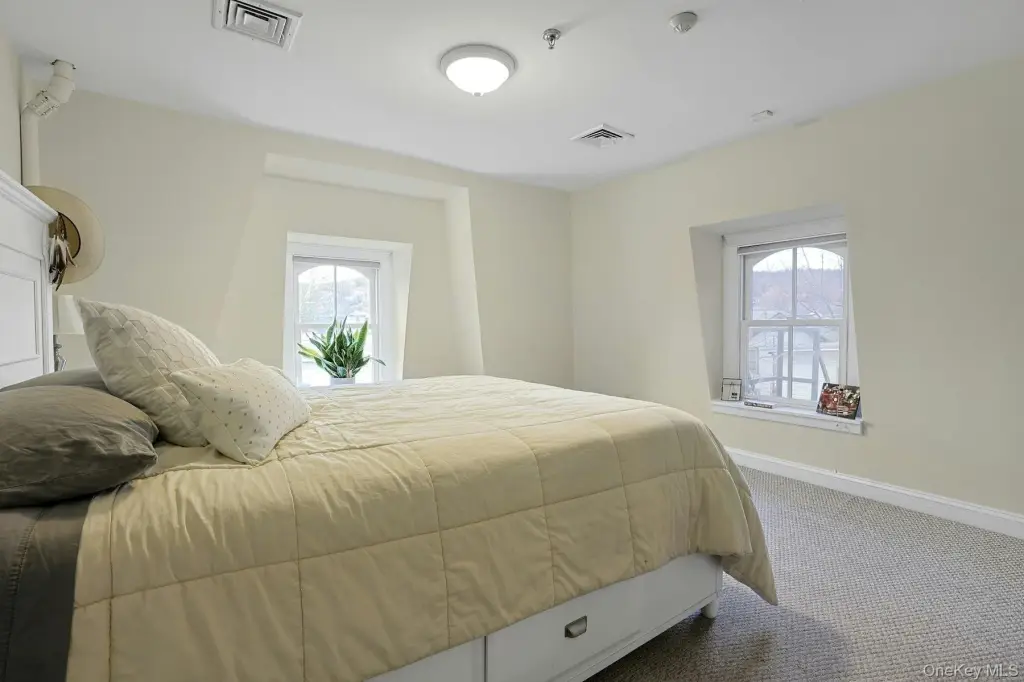
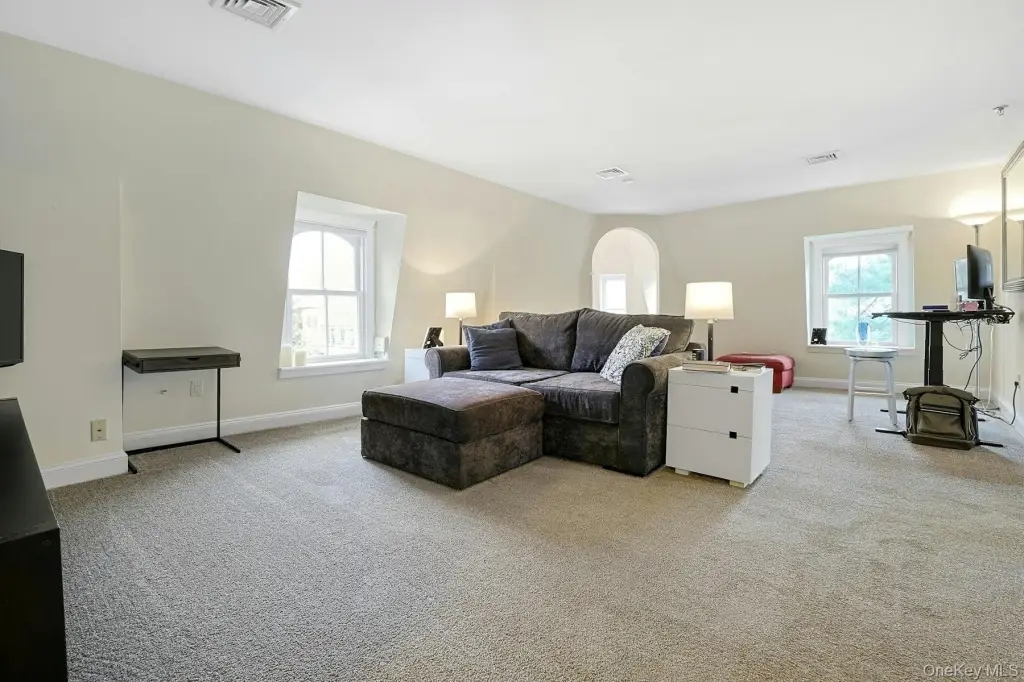
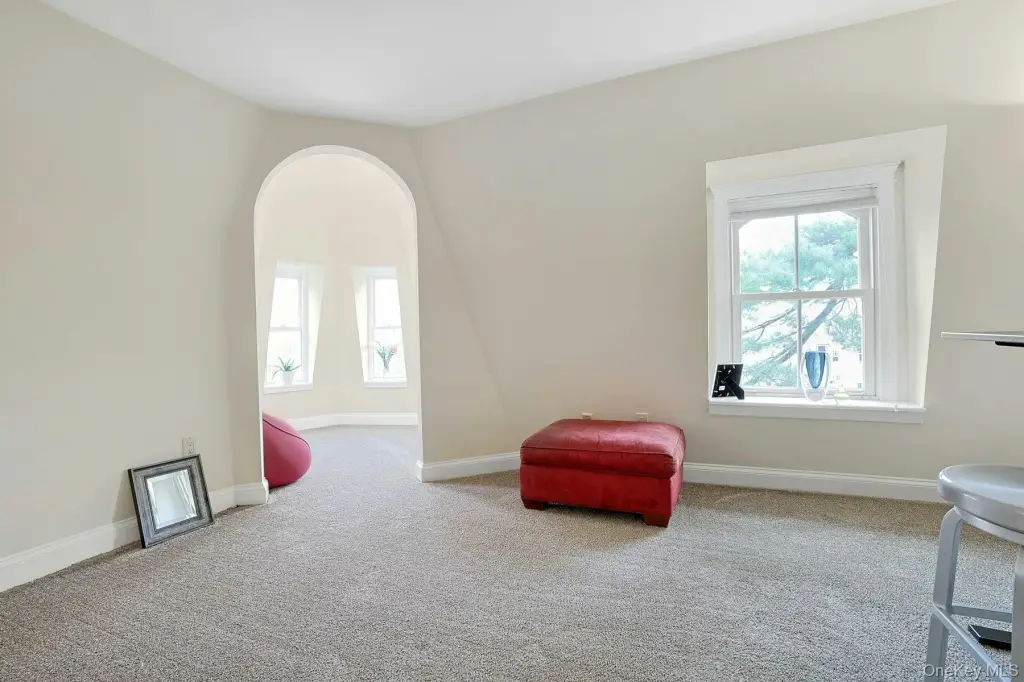
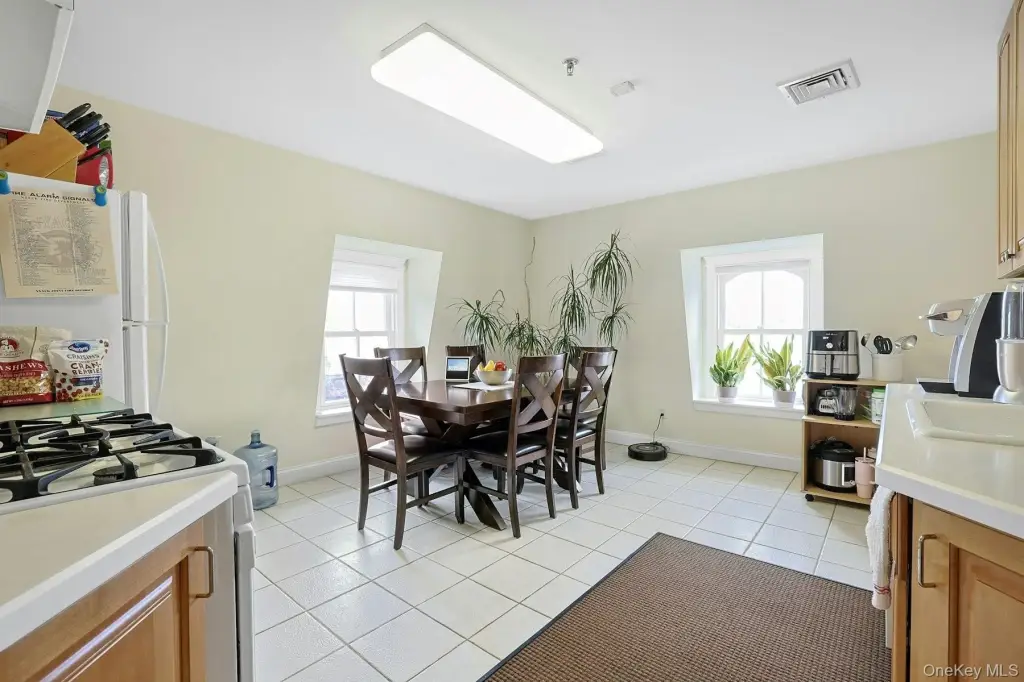
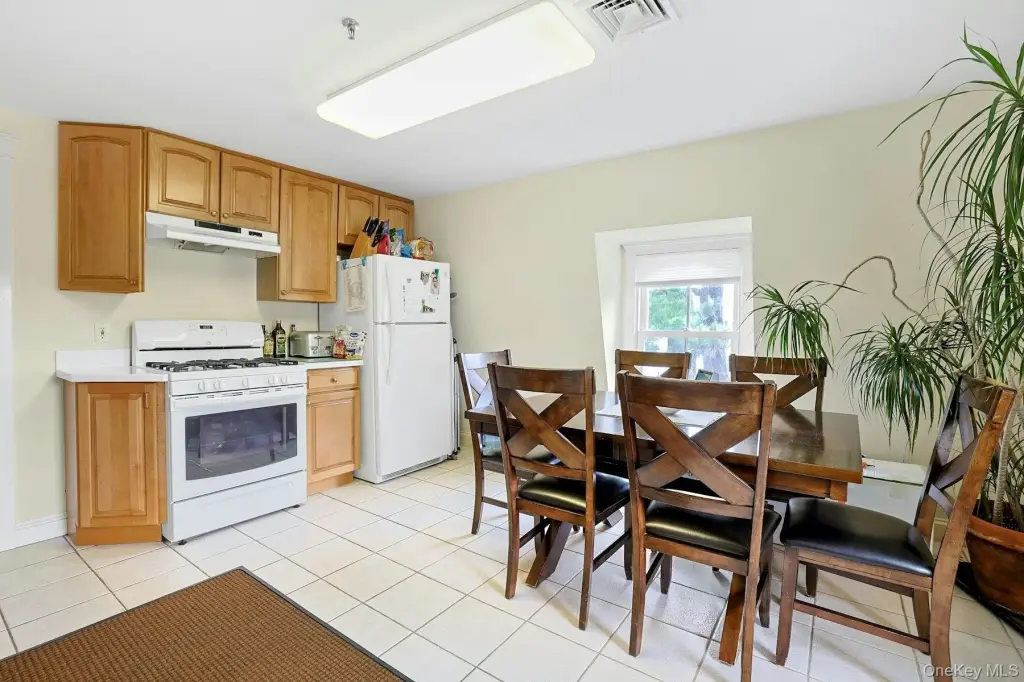
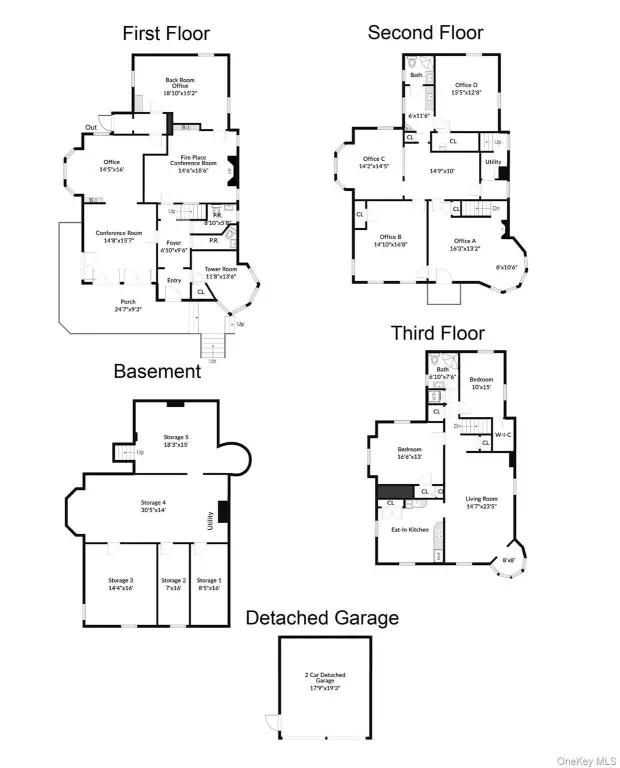
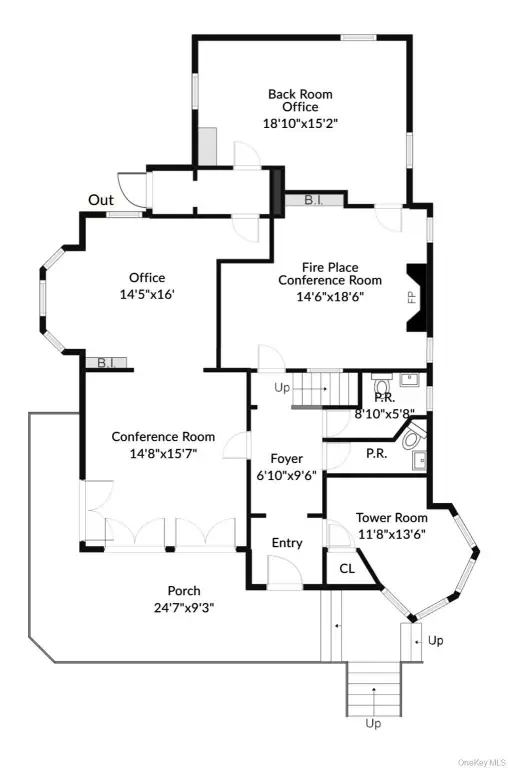
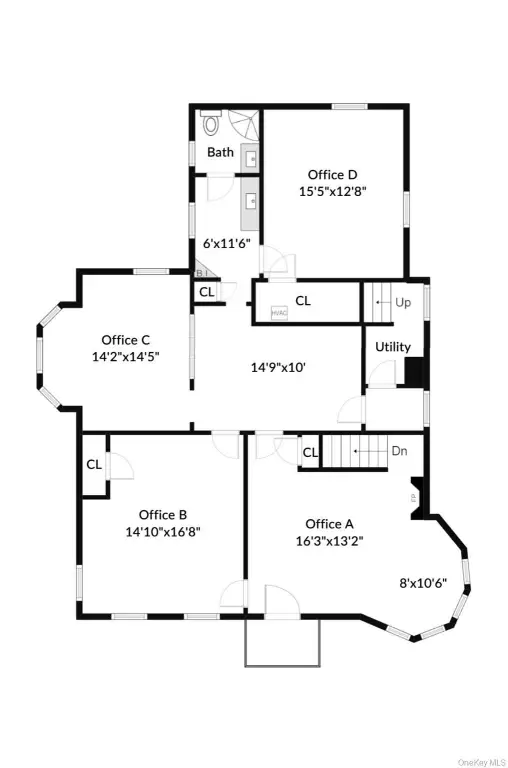
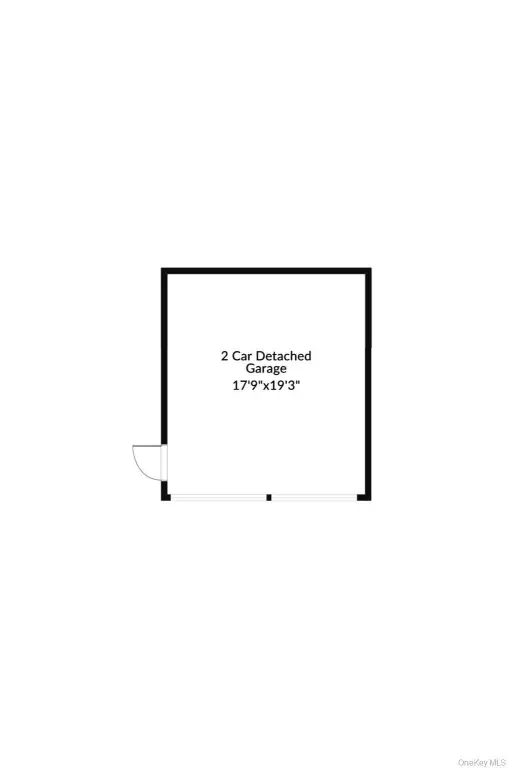
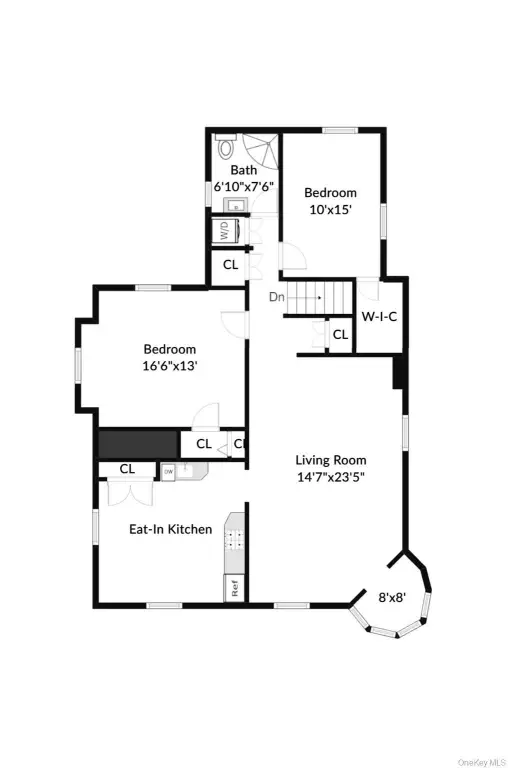
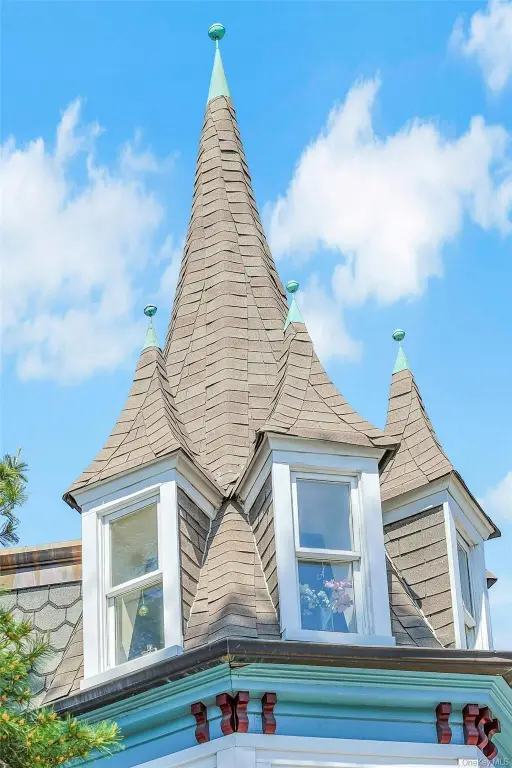
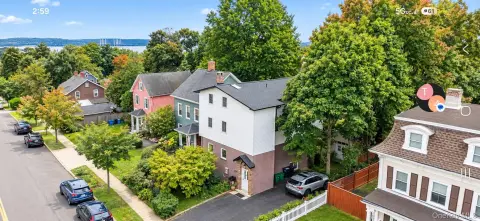
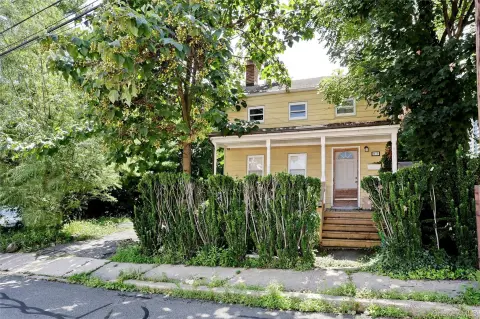
Couch Court is a restored 1854 Victorian mixed-use building at 46 South Broadway in Nyack. The approximately 5,000-square-foot property includes ground- and second-floor office suites with high ceilings and natural light, along with a top-floor two-bedroom apartment featuring river views and a turret room. A basement provides storage, while the property also includes a two-car garage, dedicated parking, separate utilities, modern systems, central air, and forced-air natural gas heat.
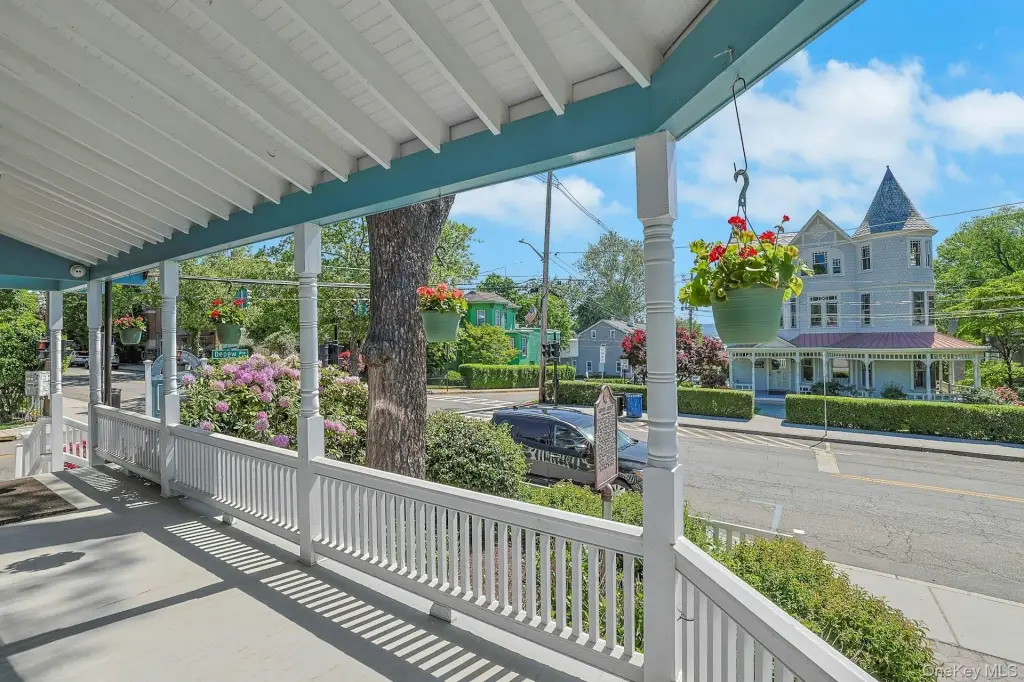
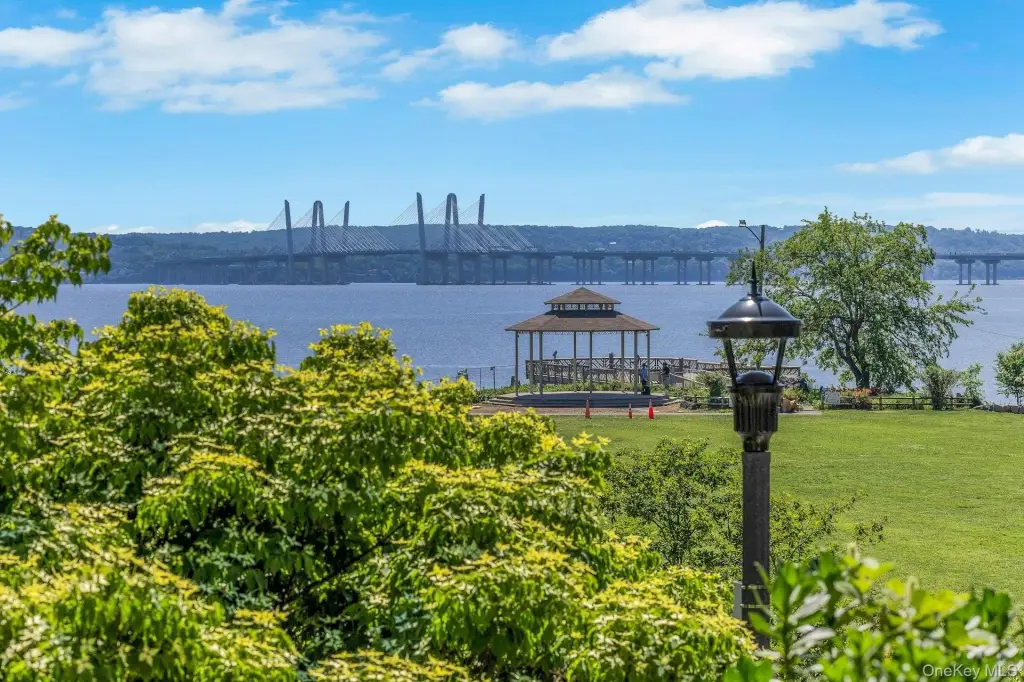
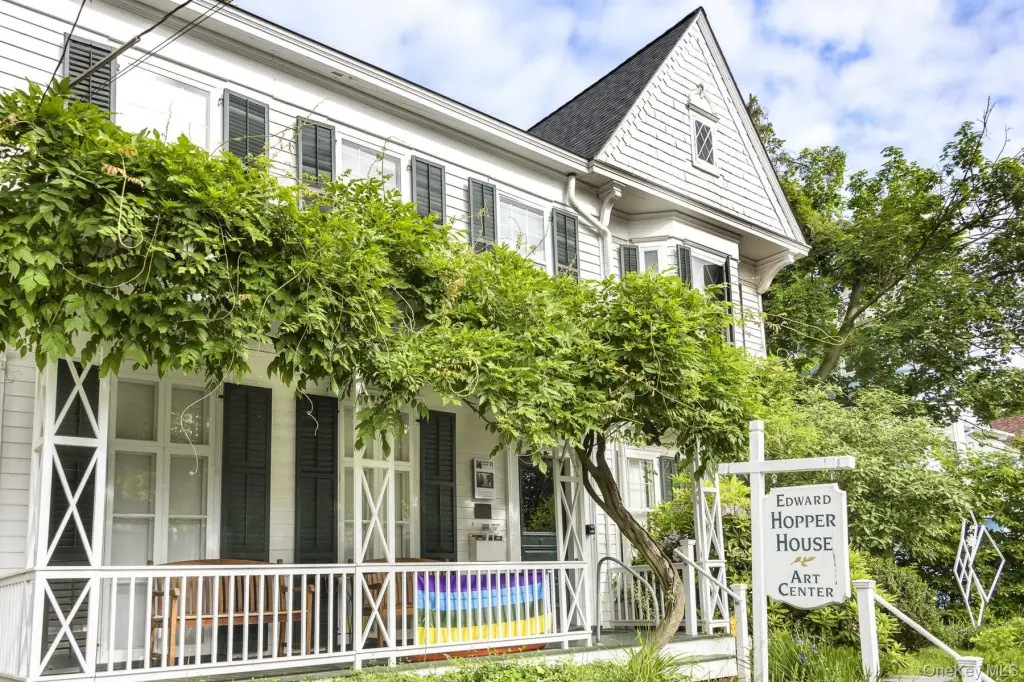
The property carries DMU-1 zoning and is currently used as a real estate office on the first floor. Its corner position places it next to the Post Office and across from the Nyack Library, with Memorial Park and the riverfront a block away. Shopping, restaurants, the Edward Hopper House, NYC bus routes, and access to the Mario Cuomo Bridge are also identified in the surrounding context.
Historic preservation recognition includes a 2001 Rockland County Historic Preservation Merit Award for Adaptive Use and formal recognition from the Town of Orangetown.
The property carries DMU-1 zoning and is currently used as a real estate office on the first floor. Its corner position places it next to the Post Office and across from the Nyack Library, with Memorial Park and the riverfront a block away. Shopping, restaurants, the Edward Hopper House, NYC bus routes, and access to the Mario Cuomo Bridge are also identified in the surrounding context.
Historic preservation recognition includes a 2001 Rockland County Historic Preservation Merit Award for Adaptive Use and formal recognition from the Town of Orangetown.
Key Highlights
- Approximately 5,000 sq ft mixed‑use Victorian building constructed in 1854
- DMU‑1 zoning with ground- and second‑floor office suites plus a top‑floor 2‑bedroom apartment
- Dedicated parking, a 2 car garage, driveway, and assigned parking features
Financial Insights
Estimated NOI and Cap Rate
NOI / Yr
$142,594
Cap Rate
7.71%
Suggested Prices Based on Cap Rates
Cap Rate 5%
$2,851,880
$2.9M
Cap Rate 7%
$2,037,057
$2.0M
Cap Rate 9%
$1,584,378
$1.6M
Market Conditions
NOI Build-Up for 5,000 SF
Gross rent
$225.0K $45.00/SF
− Vacancy
−$34.9K −$6.98/SF
EGI
$190.1K $38.03/SF
− OpEx
−$47.5K −$9.51/SF
NOI
$142.6K $28.52/SF
Area
Rockland County, NY
Vacancy
15.50%
Lease Rate
$45.00 /SF/Yr
Expense Ratio
25.00%
Simulate Cap Rate and NOI
Suggested Prices Based on Cap Rates
Cap Rate 5%
$2,851,880
Cap Rate 7%
$2,037,057
Cap Rate 9%
$1,584,378
Alternative Uses
Best Use
Office B
$2.04M
$1.78M – $2.38M
NOI $142,594 @ 7.0% cap · market cap 7.71%
Second Best
Mixed Use
$584.6K
$511.5K – $682.0K
NOI $40,922 @ 7.0% cap · market cap 2.21%
Theoretical Best
Specialty Retail
$3.31M
$2.89M – $3.86M
NOI $231,413 @ 7.0% cap · market cap 12.51%
Zoning and permitted uses should be independently verified with authorities.
Property Analytics
Unlock full access to Insights
Subscribe to Realmo Intelligence
Open Analytics
Current Use
Lease Details
Yes
Utilities to site
Location Intelligence
Trade Area within ½ mile
2,025
Businesses Nearby
Explore this area
Business Placement
Demographics for 10960, NY
14,680
Population
6,680
Households
2.2
Avg Household Size
44
Median Age
63%
College-Educated
95%
High-School Grad
4.7 sq mi
ZIP Area
3,123
Density / Sq Mi
$126,404
Median Household Income
$69,067
Median Earnings
$2,148
Median Rent
$662,600
Median Home Value
Check the figures for this property
Cap Rate, Value Estimation, Potential NOI and more
View Realmo Analytics
Market
Vacancy Rate% for Office in Northeast region

Questions? Ask Rey
Realmo’s AI knows this listing — price, zoning, demand, history. Ask anything.







Frequently Asked Questions
What type of property is this?
Mixed-use property - Restored Victorian building with office suites, an apartment, dedicated parking, and flexible commercial space.
Where is this mixed-use property located?
The property is located at 46 South Broadway Nyack, NY.
What is the asking price?
The asking price for this property is $1,850,000.
What are key features of this property?
This property features: Approximately 5,000 sq ft mixed‑use Victorian building constructed in 1854; DMU‑1 zoning with ground- and second‑floor office suites plus a top‑floor 2‑bedroom apartment; Dedicated parking, a 2 car garage, driveway, and assigned parking features