Renovated Bar and Grill
For Sale
$1,600,000
4545 N Brighton Avenue, Kansas City, MO 64117
Commercial Sale, Kansas City, MO
Property SizeContact for details
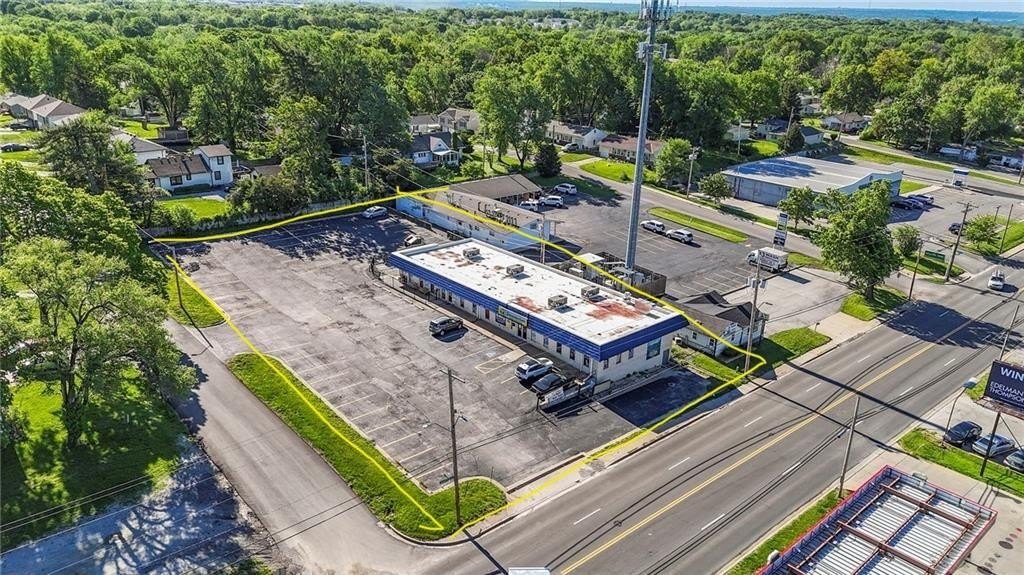
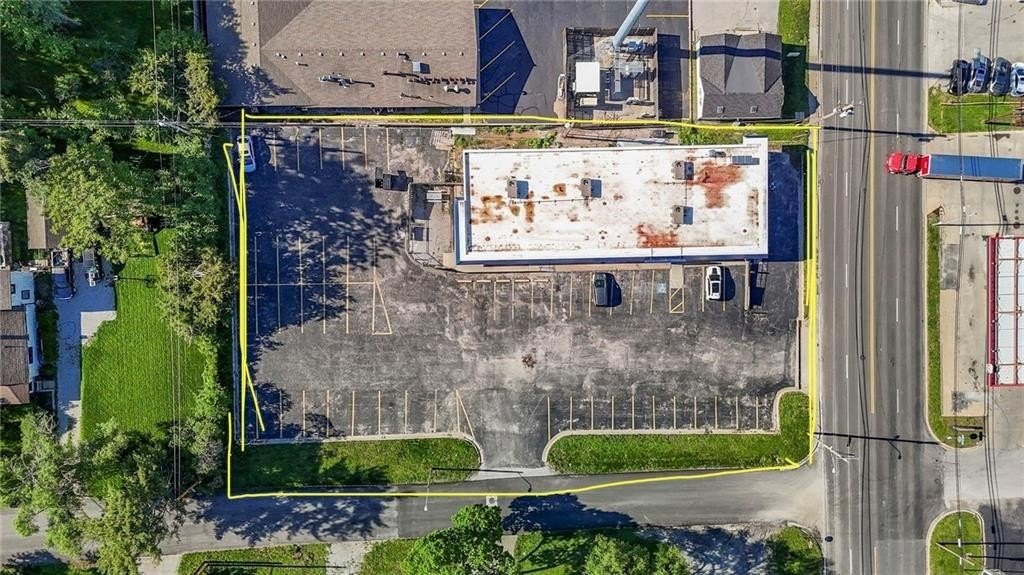
Lot Size0.75 Acres
Days on Market685
Property Features for 4545 N Brighton Avenue
General Information
Property type
Commercial Sale
Property subtype
Retail
Zoning
B2-2
Parking
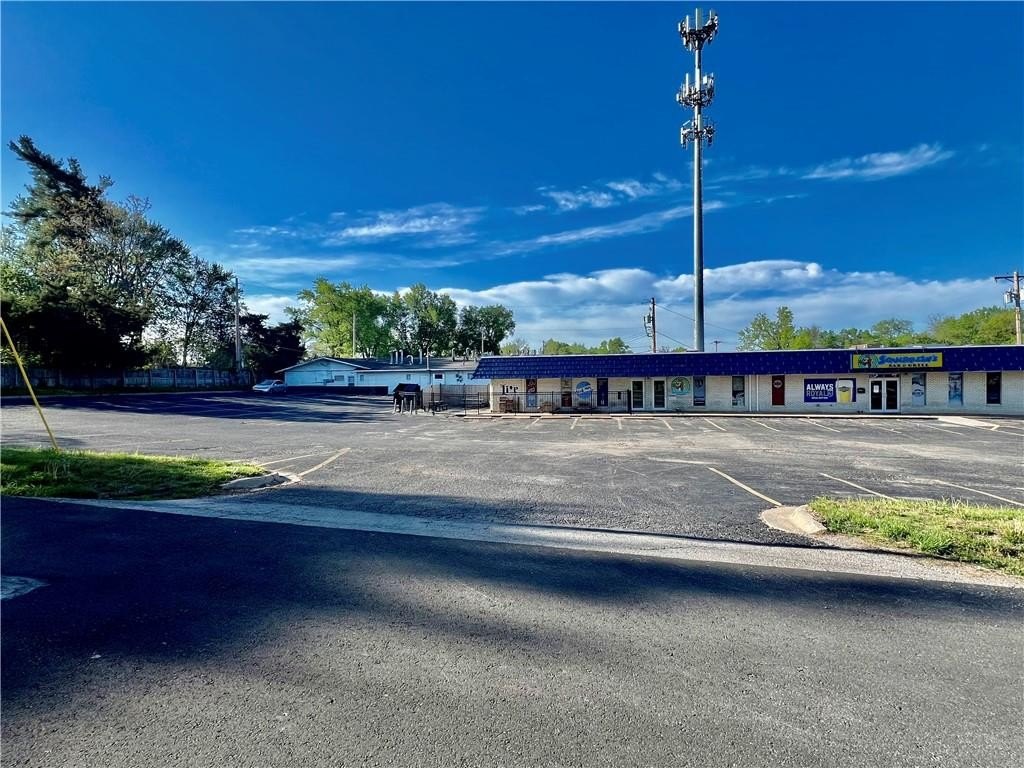
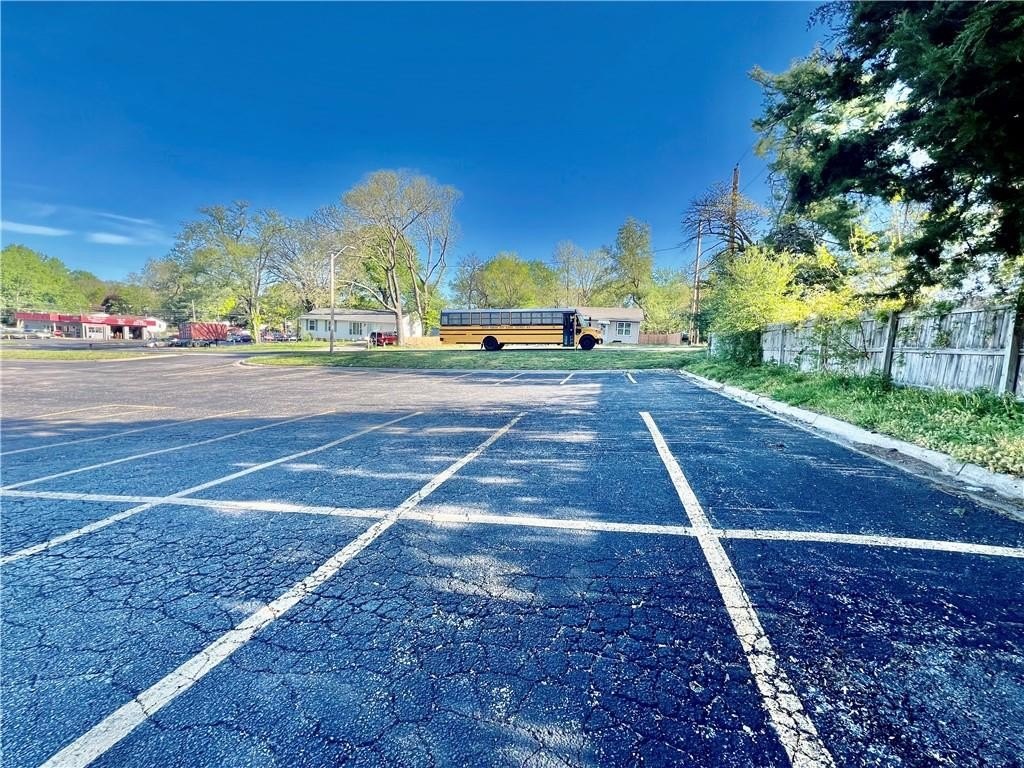
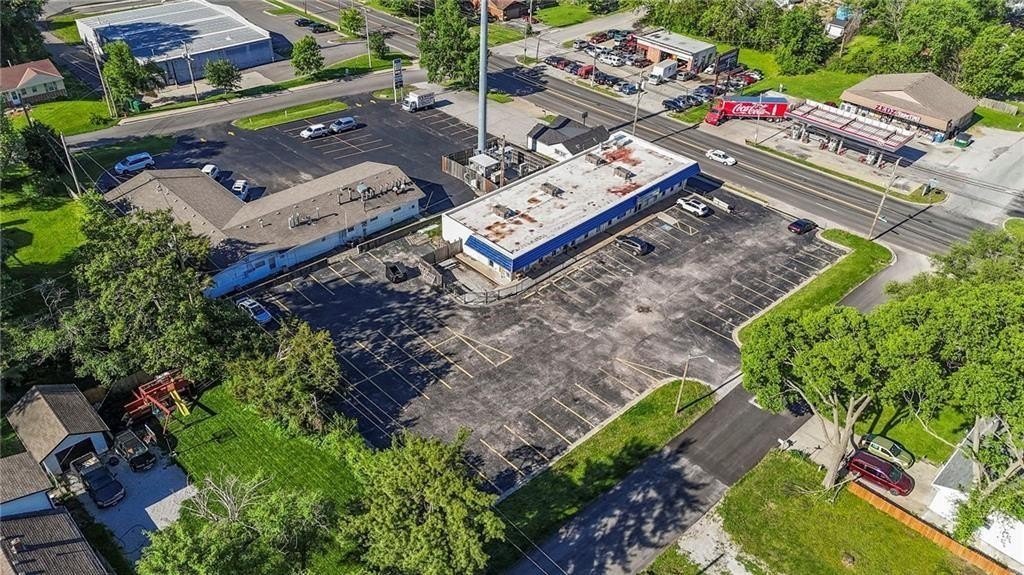
55
Parking features
Parking Lot
Exterior features
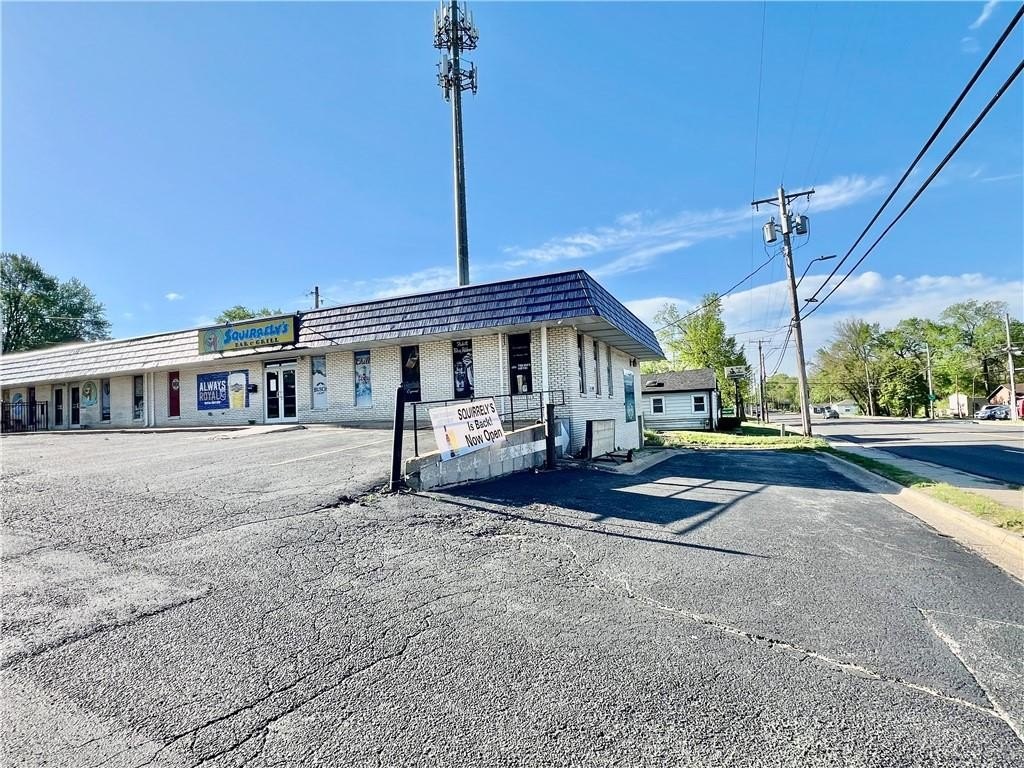
Building Sign
Subdivision
Sprinkle Heights
Directions
35 Hwy to South onto N Brighton ***building on the left.
Standard status
Active
APN
18-108-00-05-007.00
Lot size
0.75 Acres
Taxes and HOA fees
Tax Description
Sprinkle Heights BLKS 9 and 10 LTS 8-12
Tax Annual Amount
4012
Legal Description
Sprinkle Heights BLKS 9 and 10 LTS 8-12
Utilities
Utilities
Water Available
Amenities
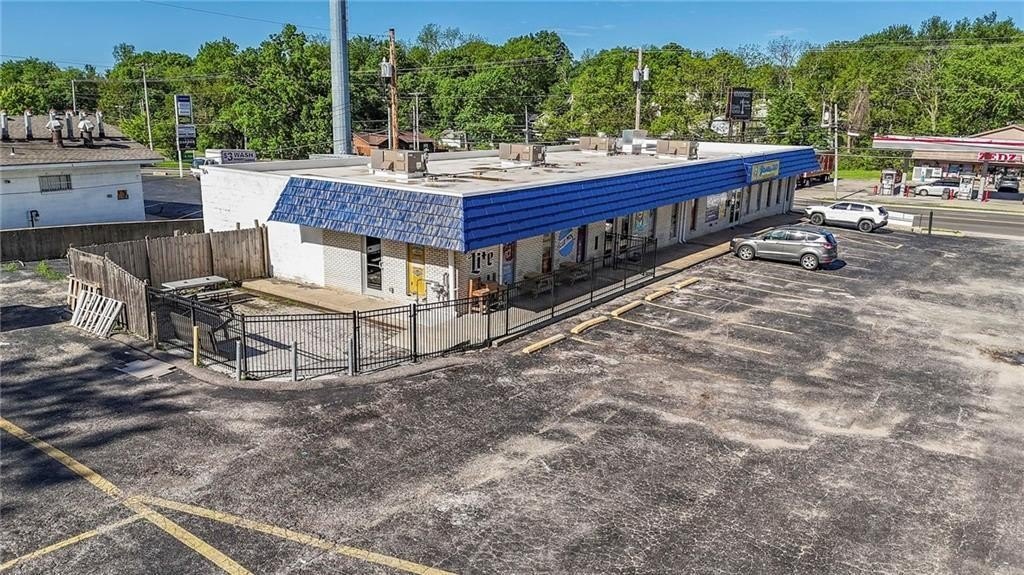
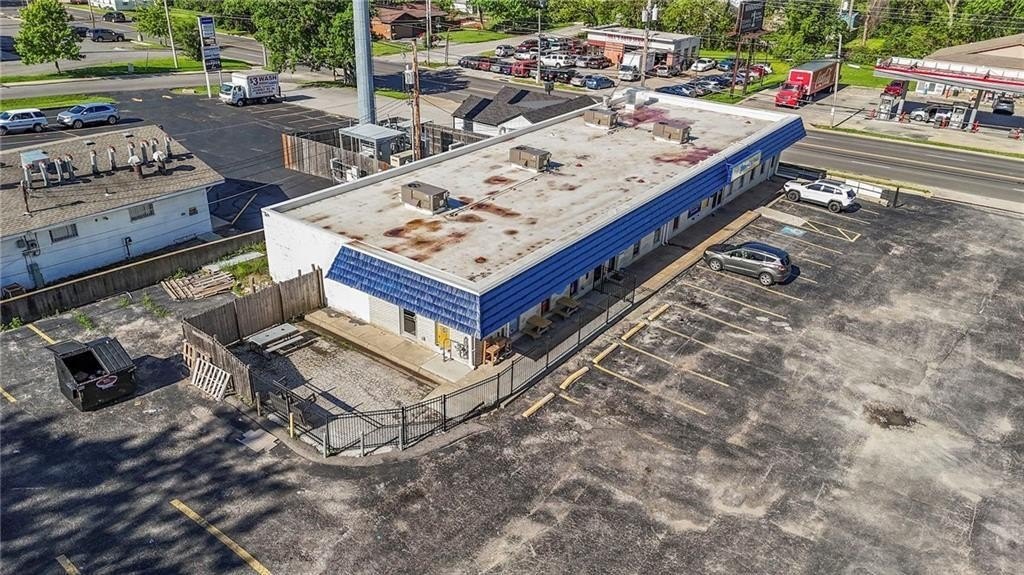
patio seating area
Building Details
Year built
1972
Floors in Building
1
Listing Agency:
Keller Williams KC North · Keller Williams Realty
(816) 452-4200
Listed By:
Fidelity RE Group · License #2009034726
(816) 777-3230
Added: Nov 9, 2024
Changed: Sep 17
Last Checked: Sep 25 at 5:06PM
MLS# 2519303
Copyright © 2026 Heartland Multiple Listing Service. All rights reserved. All information provided by the listing agent/broker is deemed reliable but is not guaranteed and should be independently verified.
Investment Insights
Based on property information with market context.
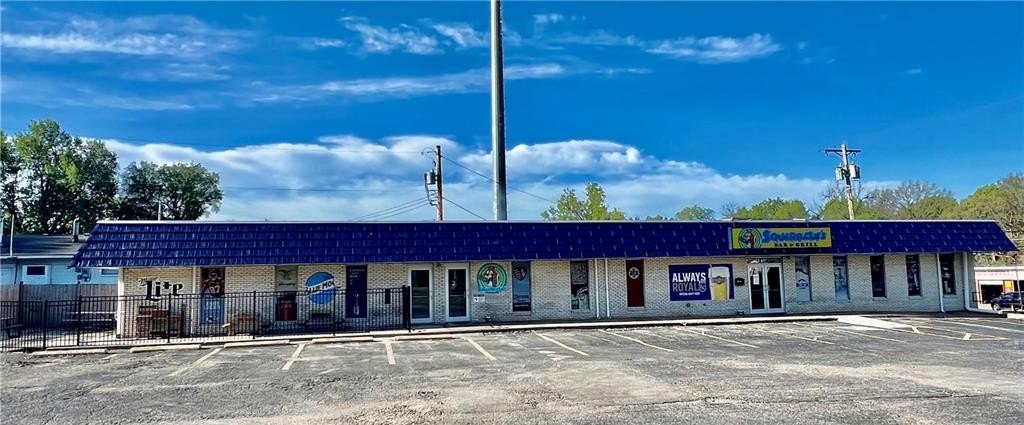
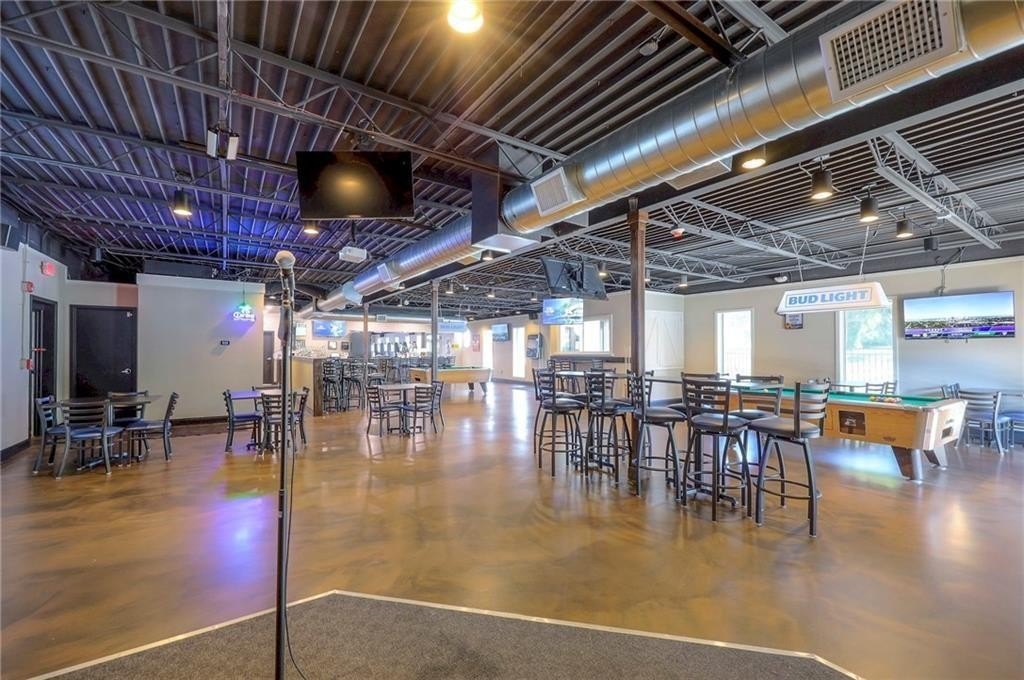
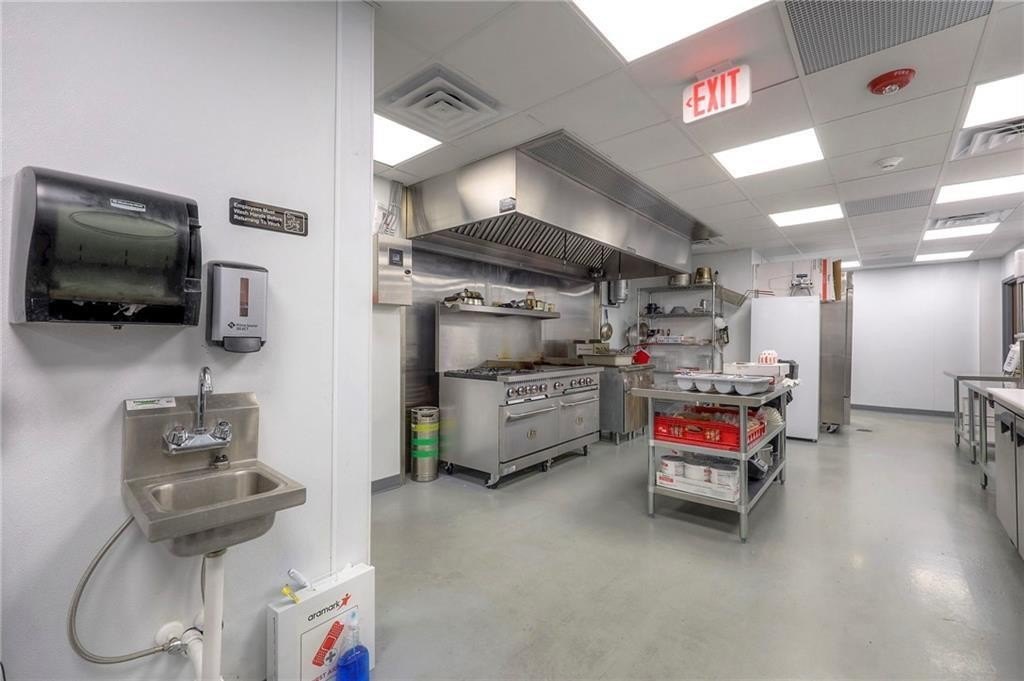
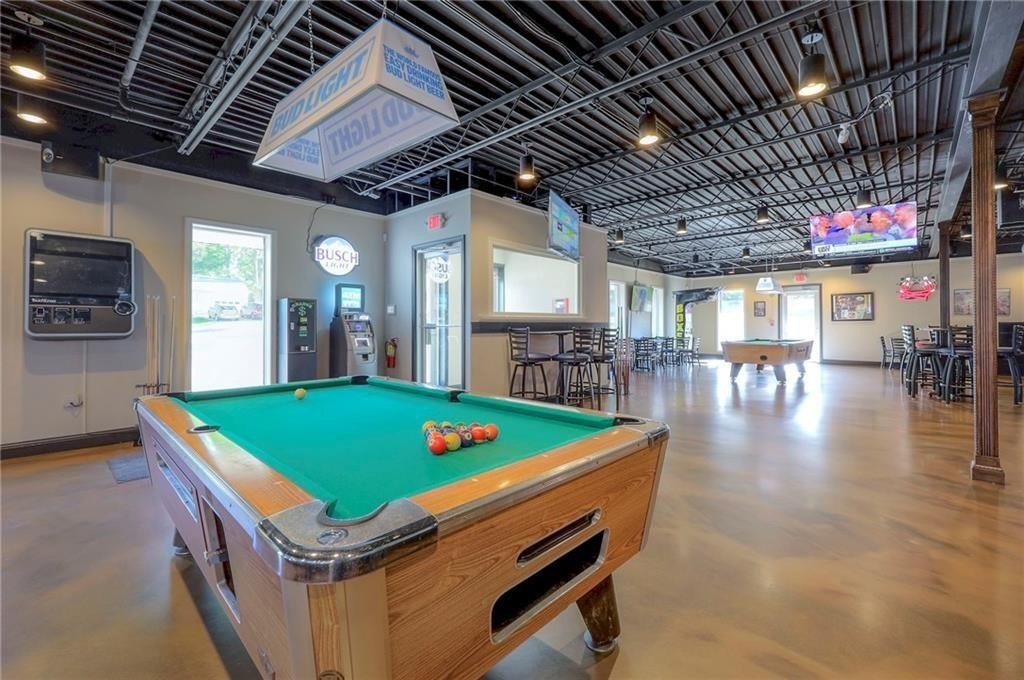
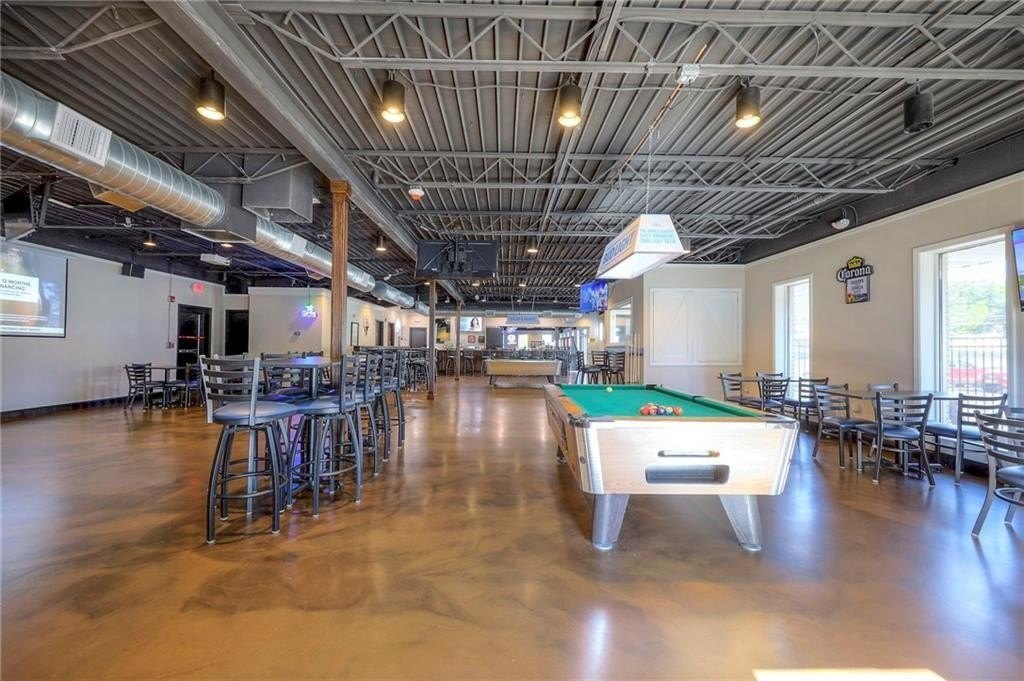
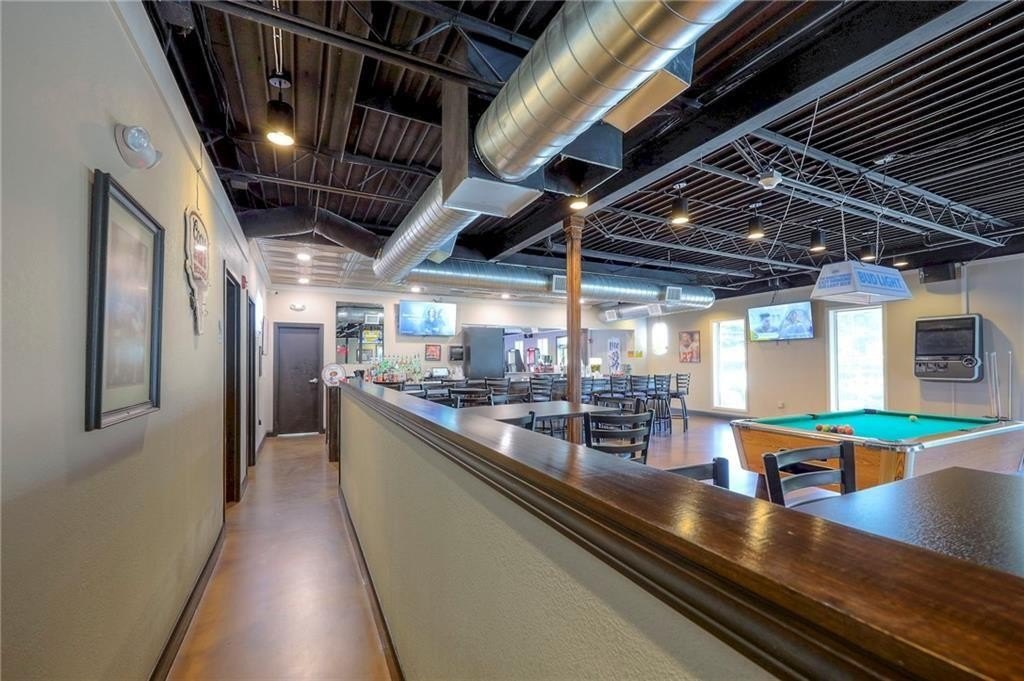
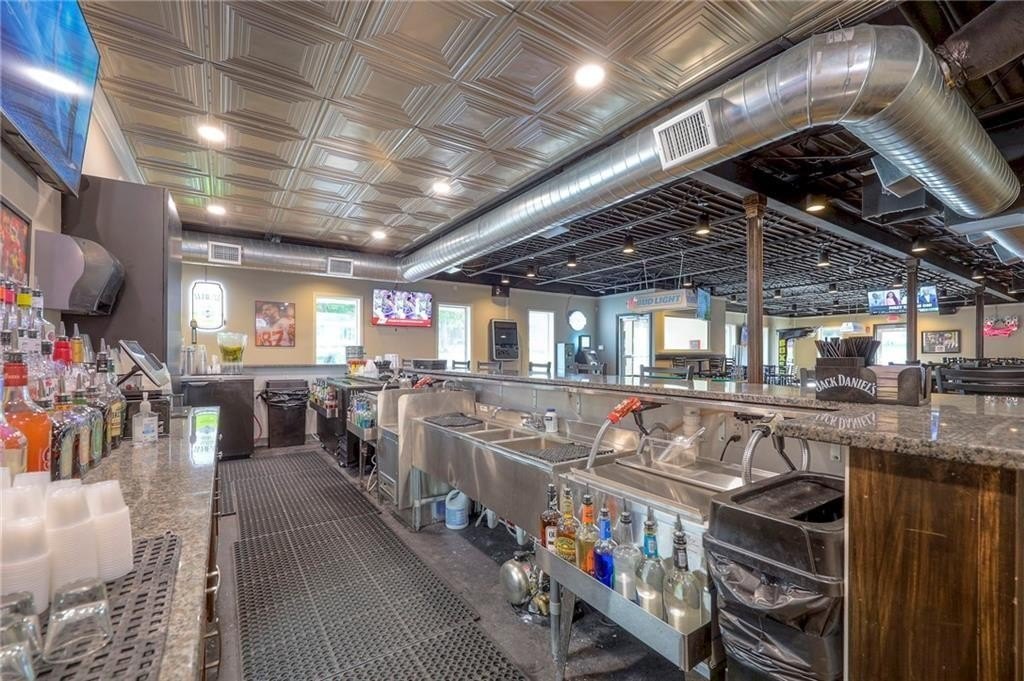
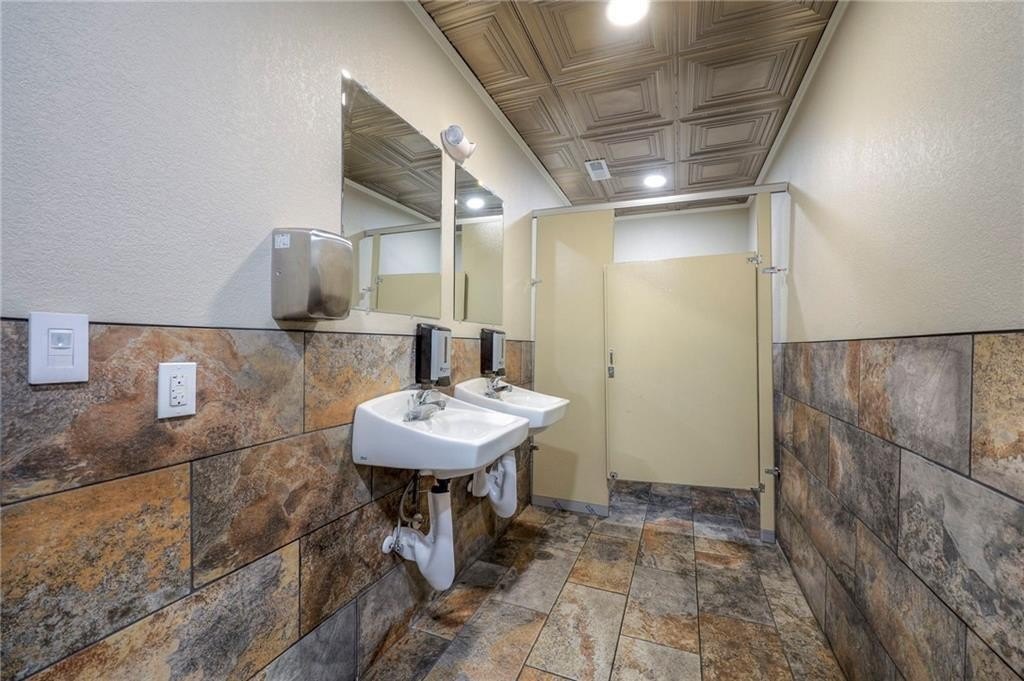
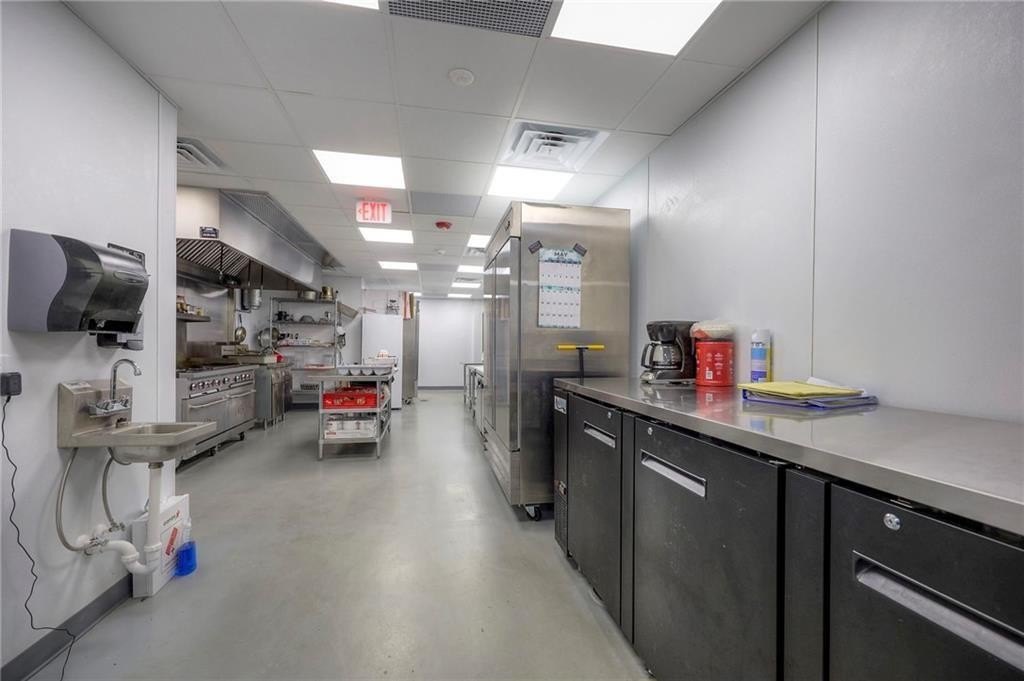
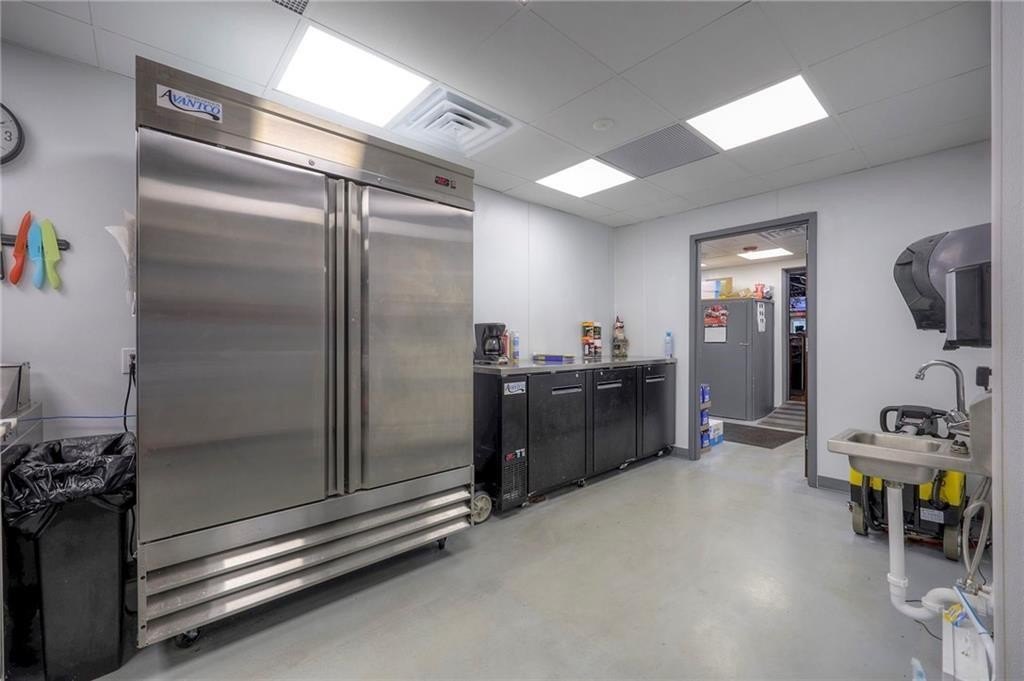
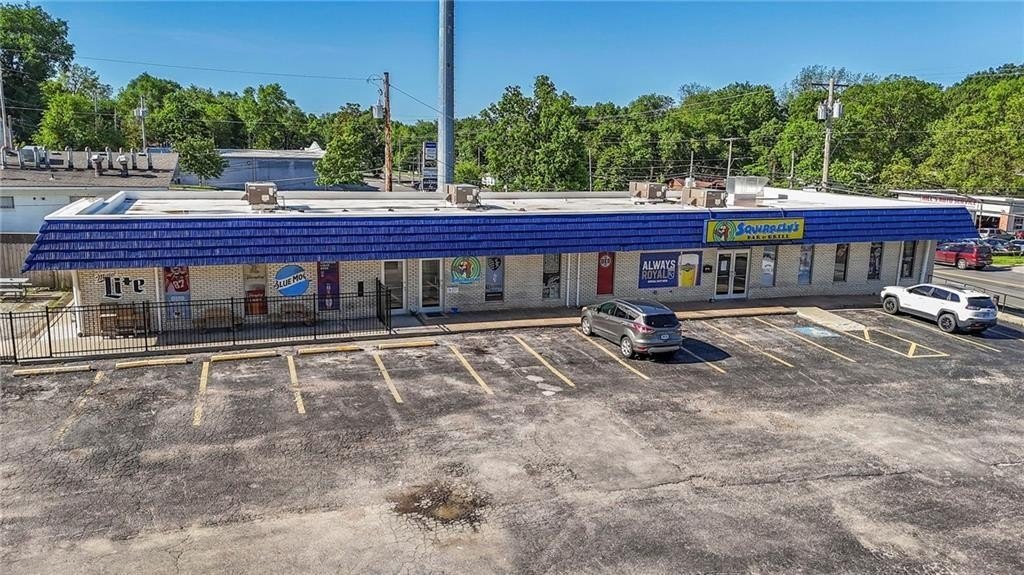
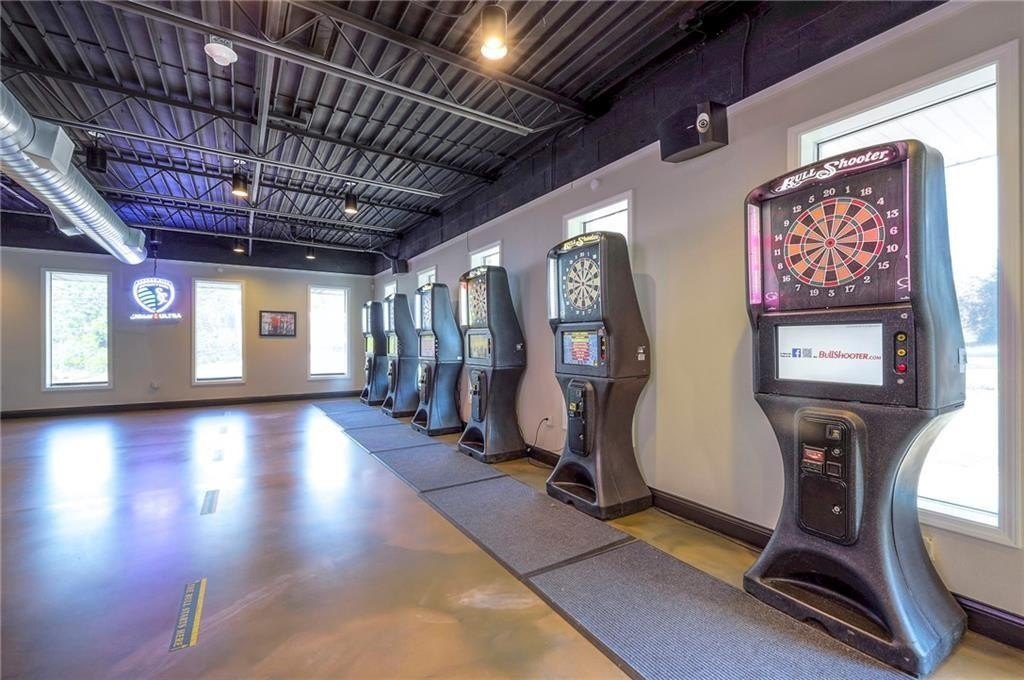
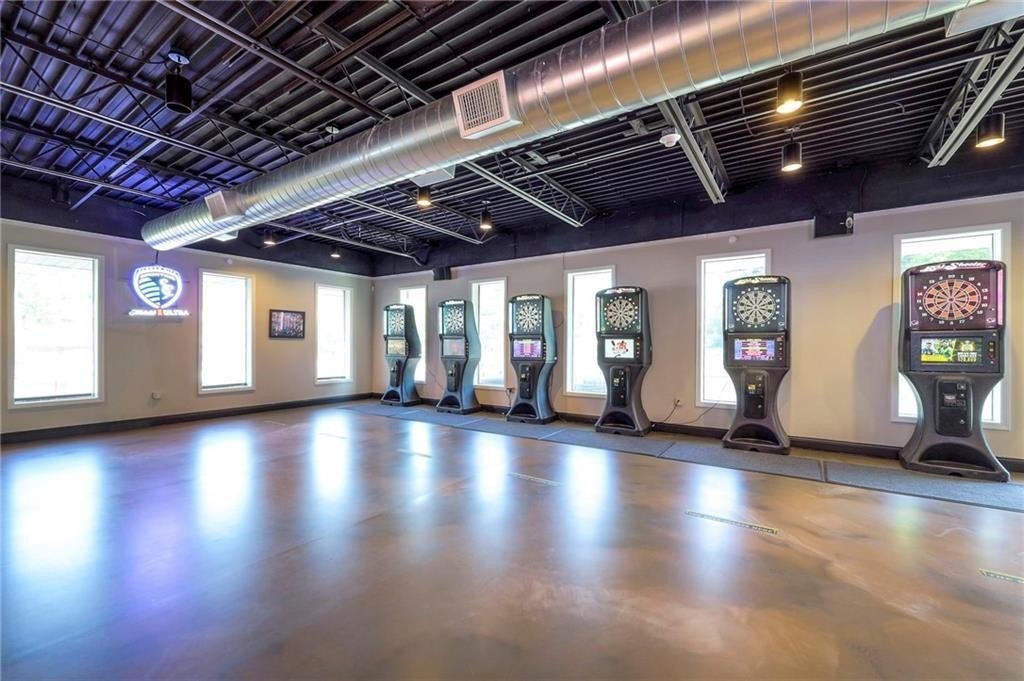
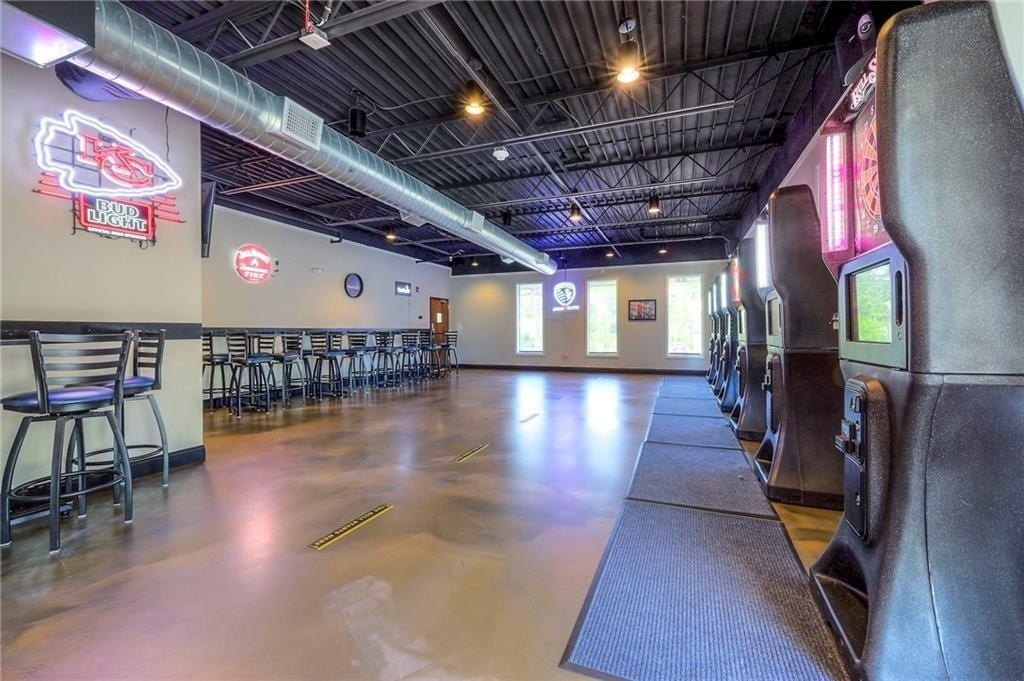
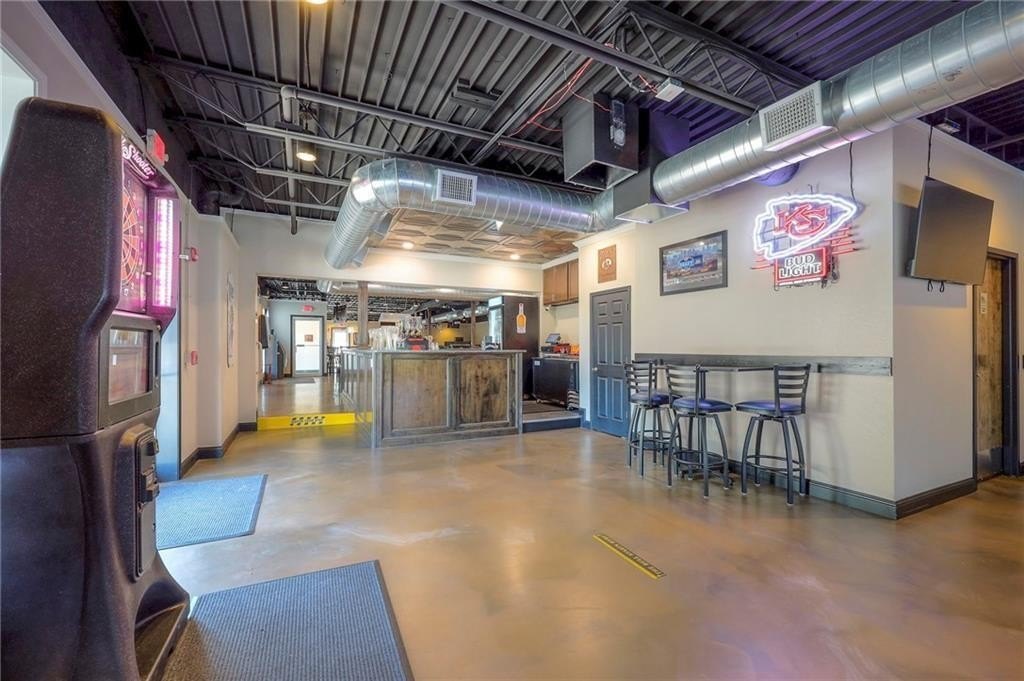
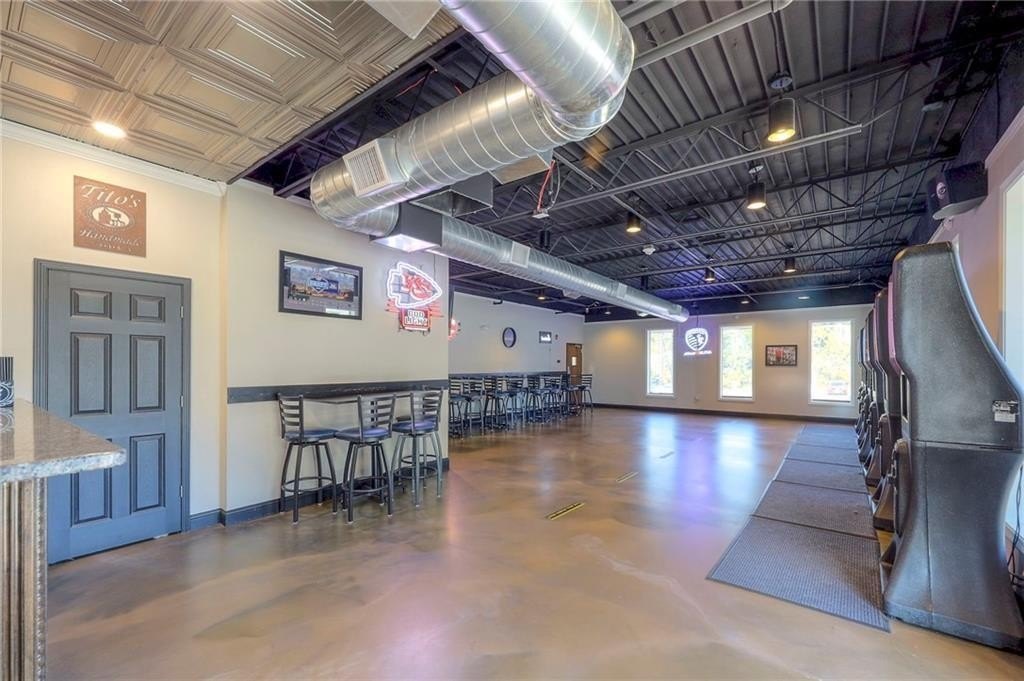
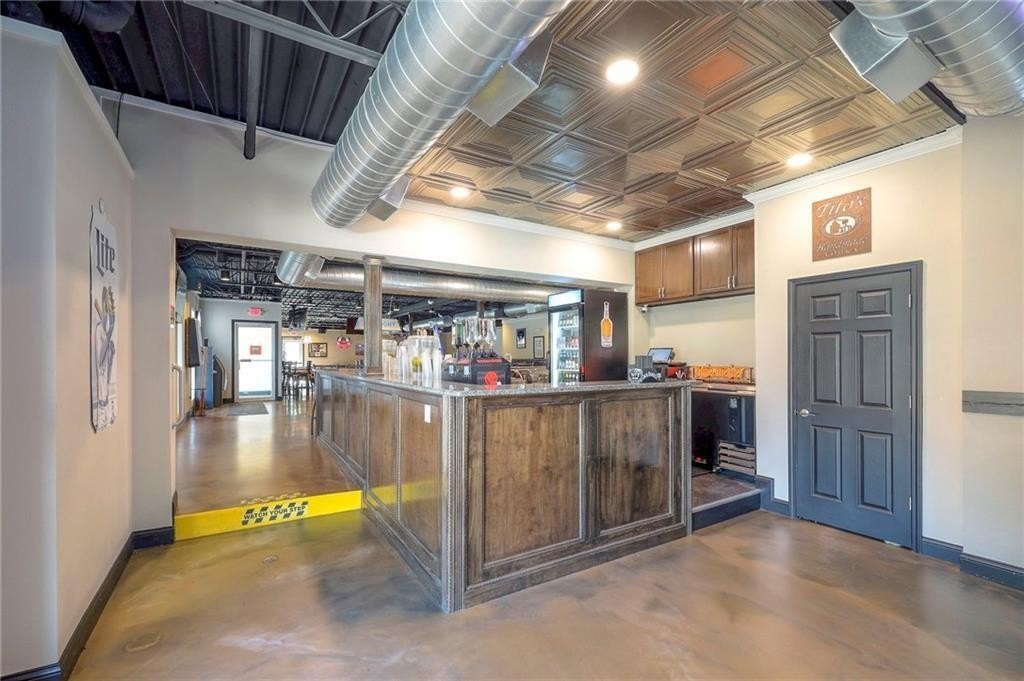
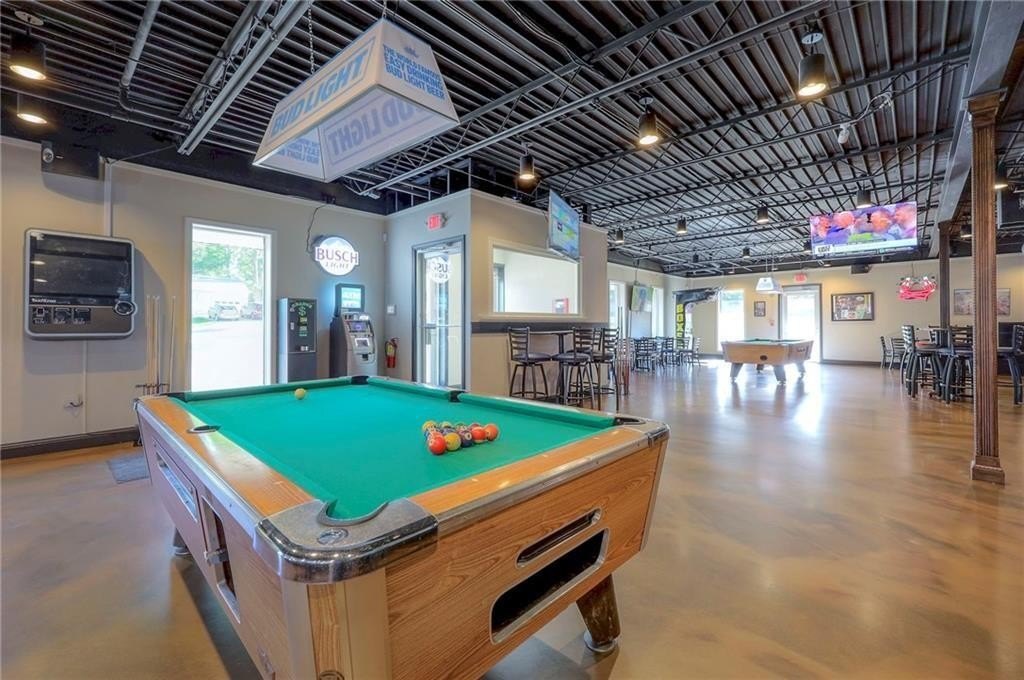
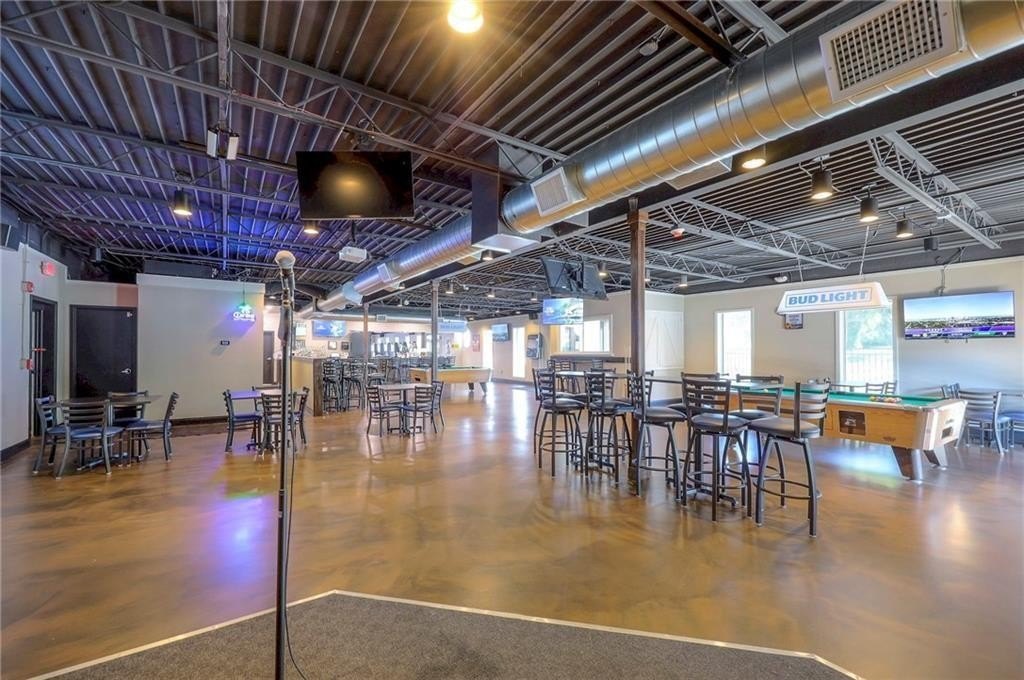
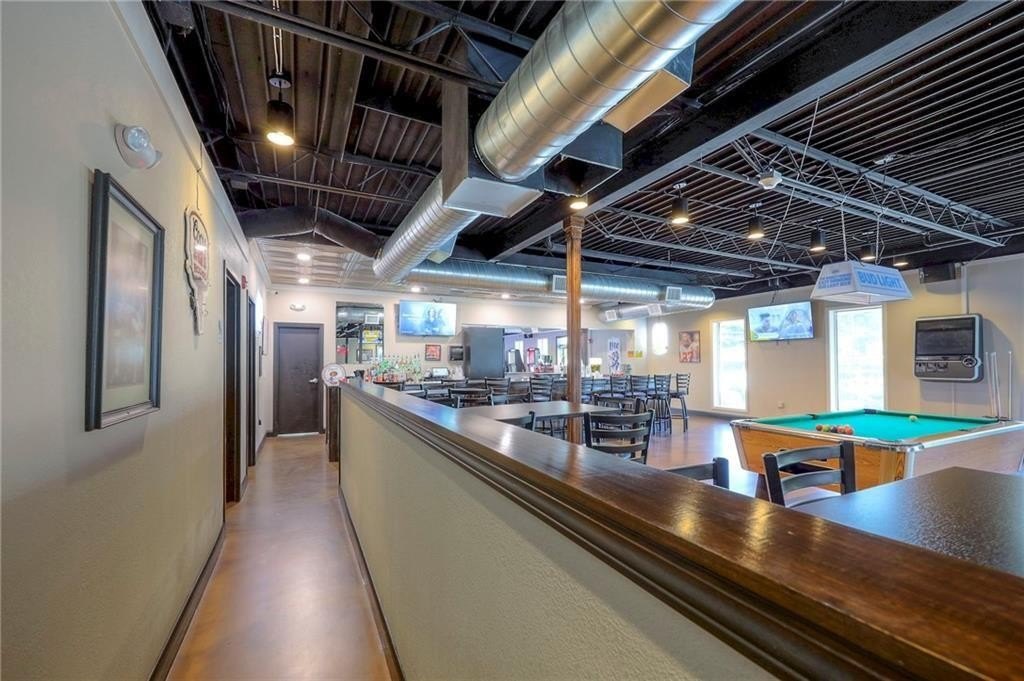
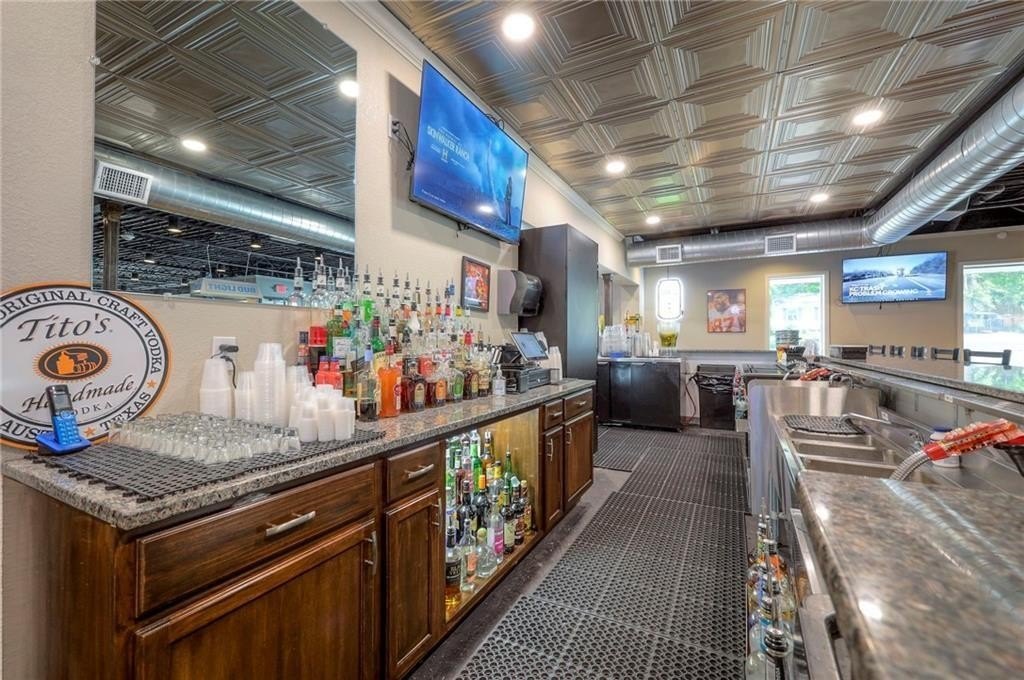
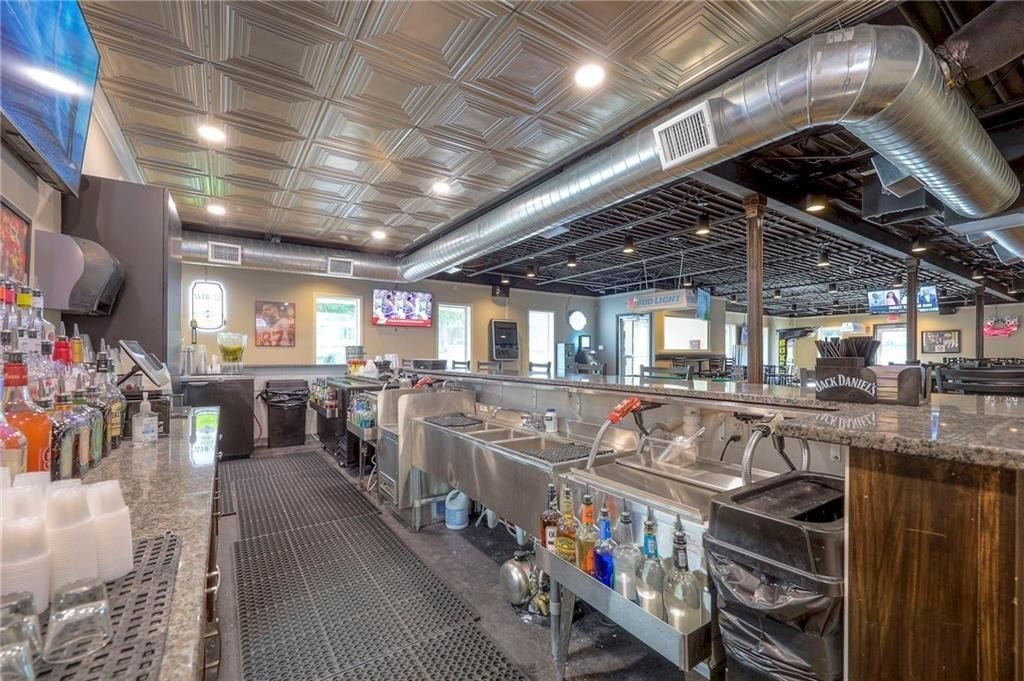
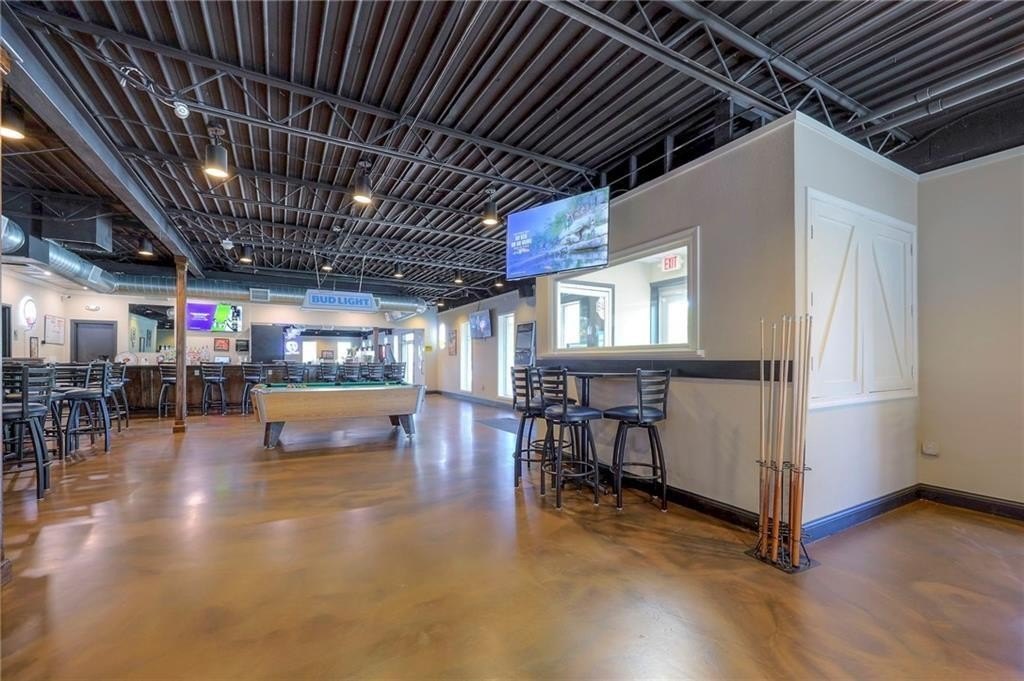
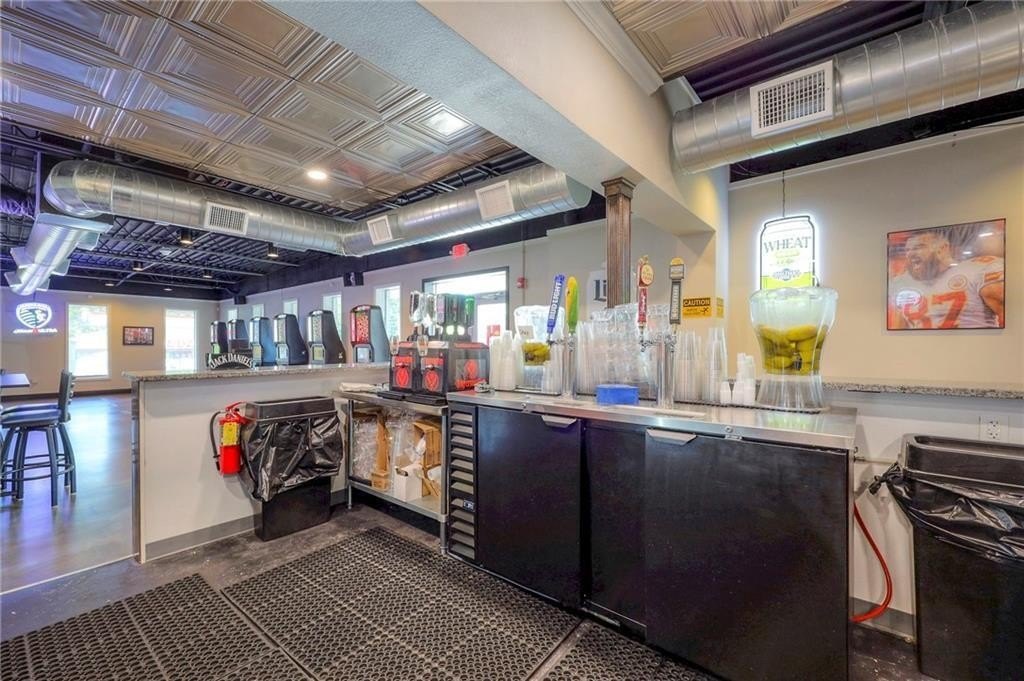
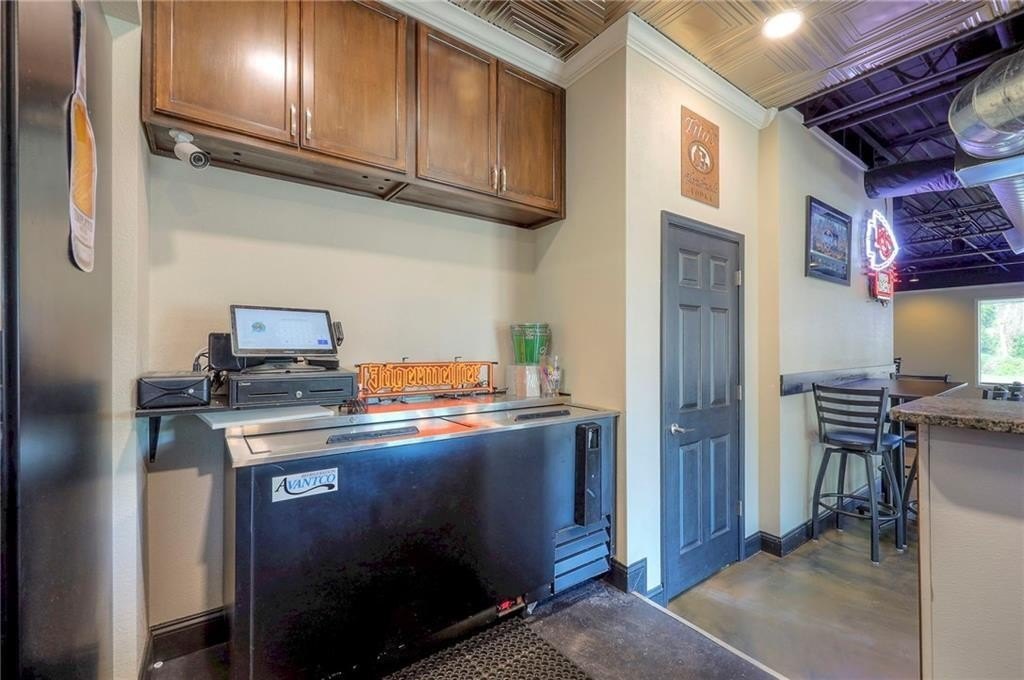
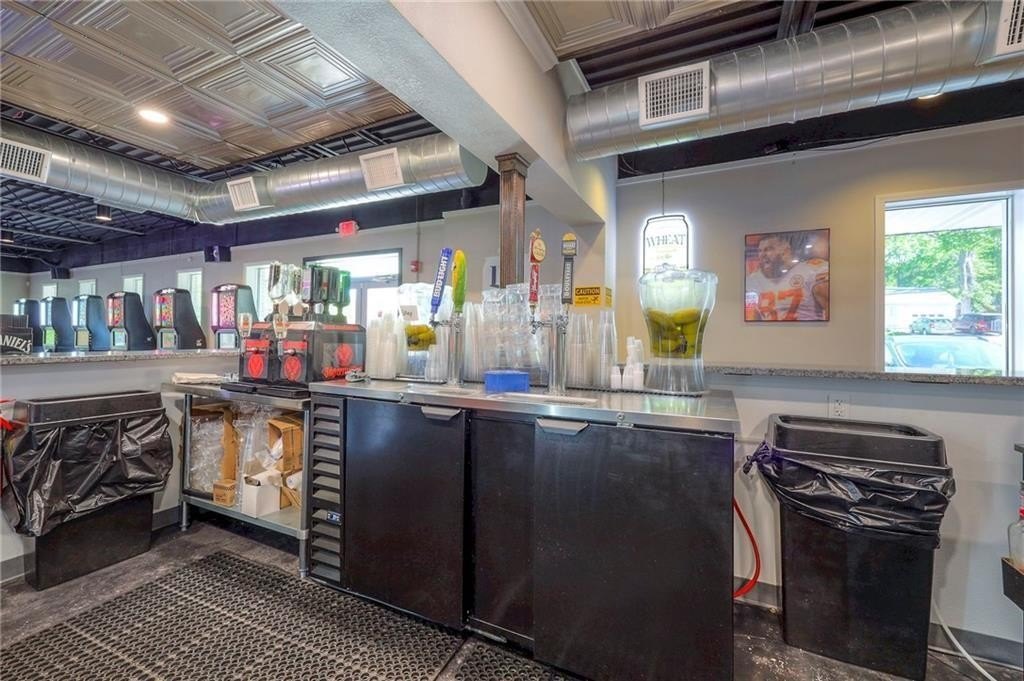
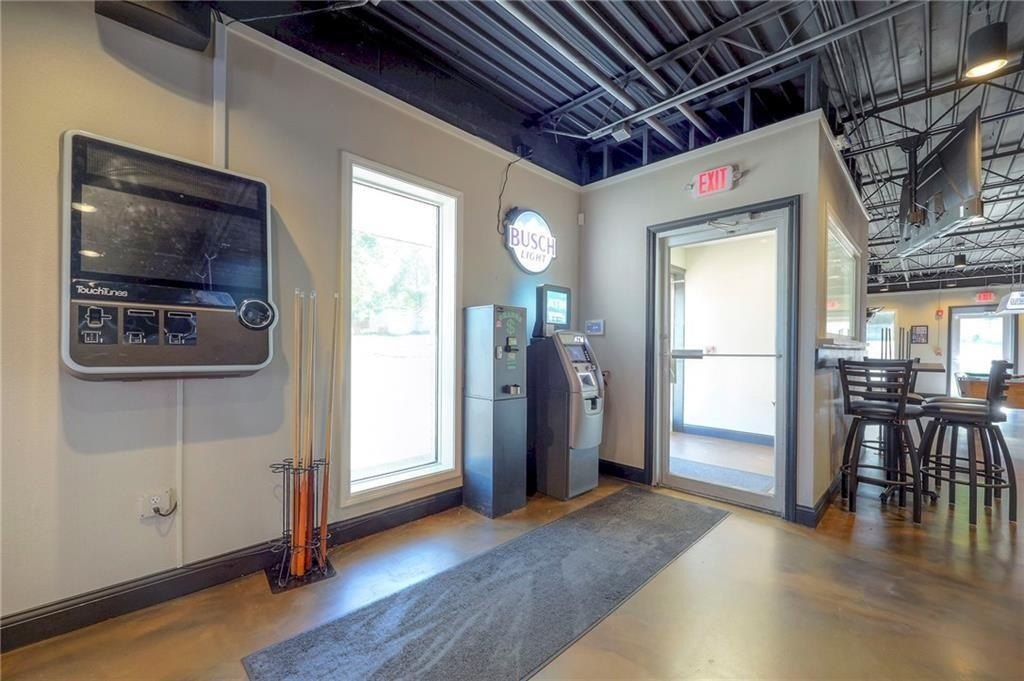
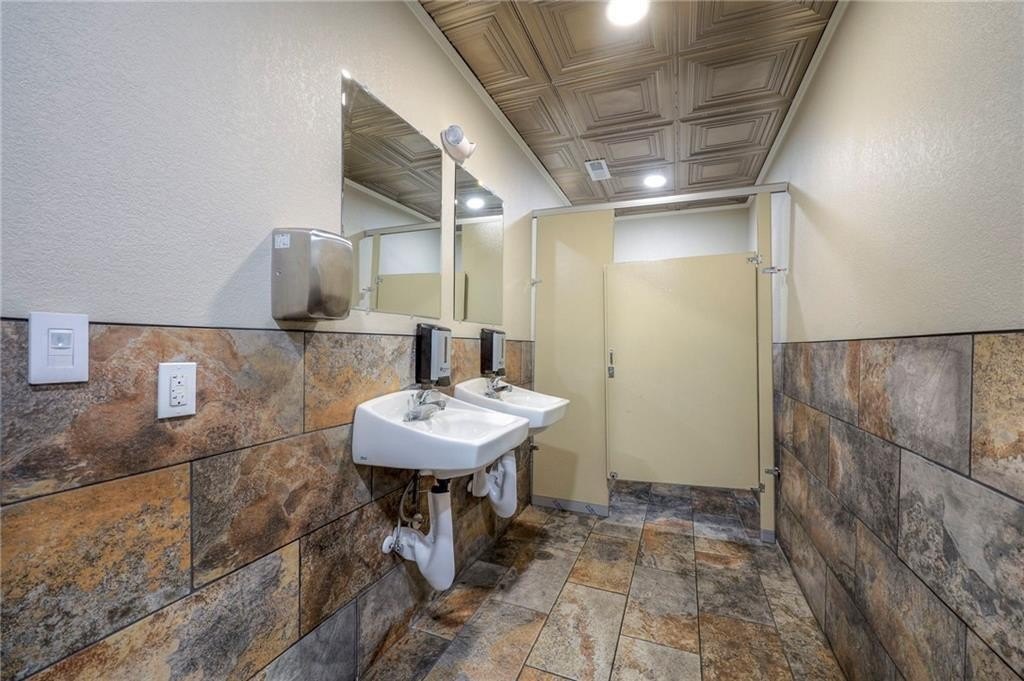
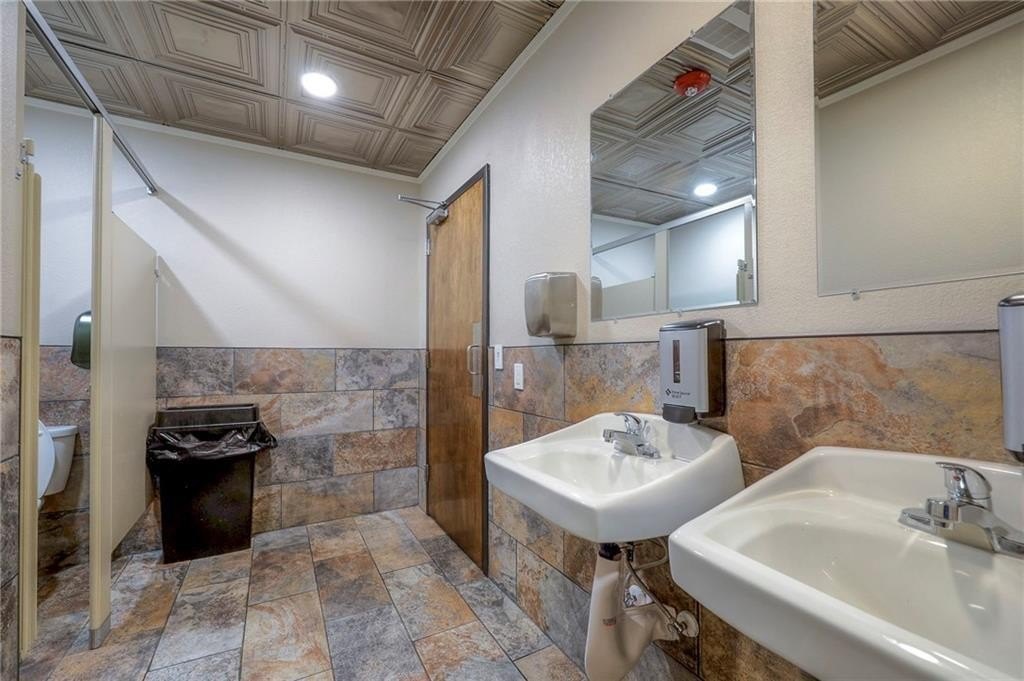
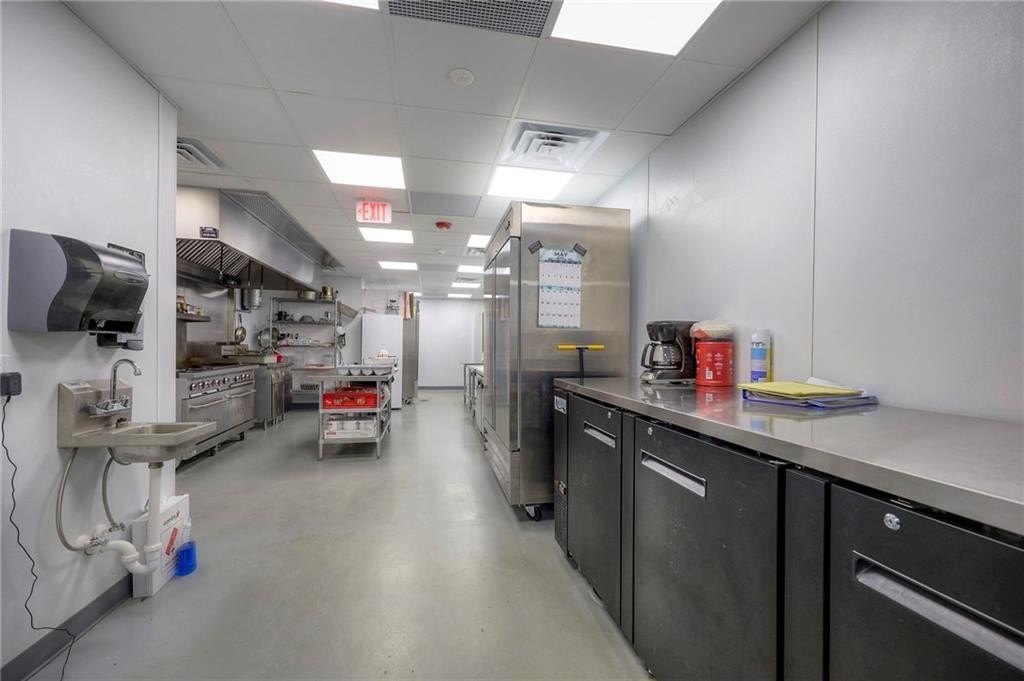
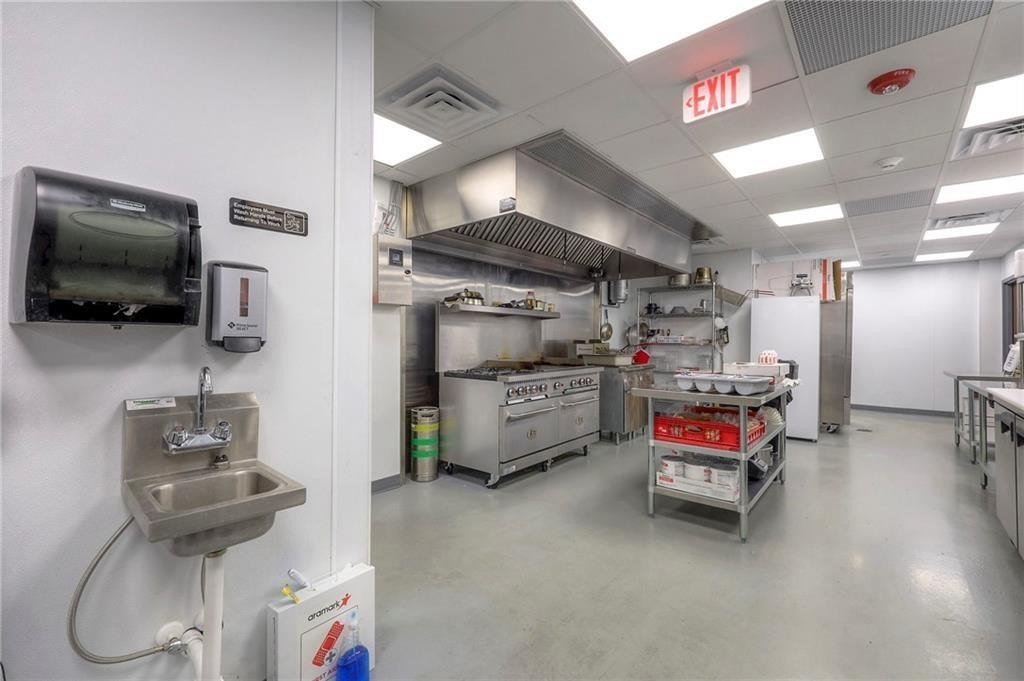
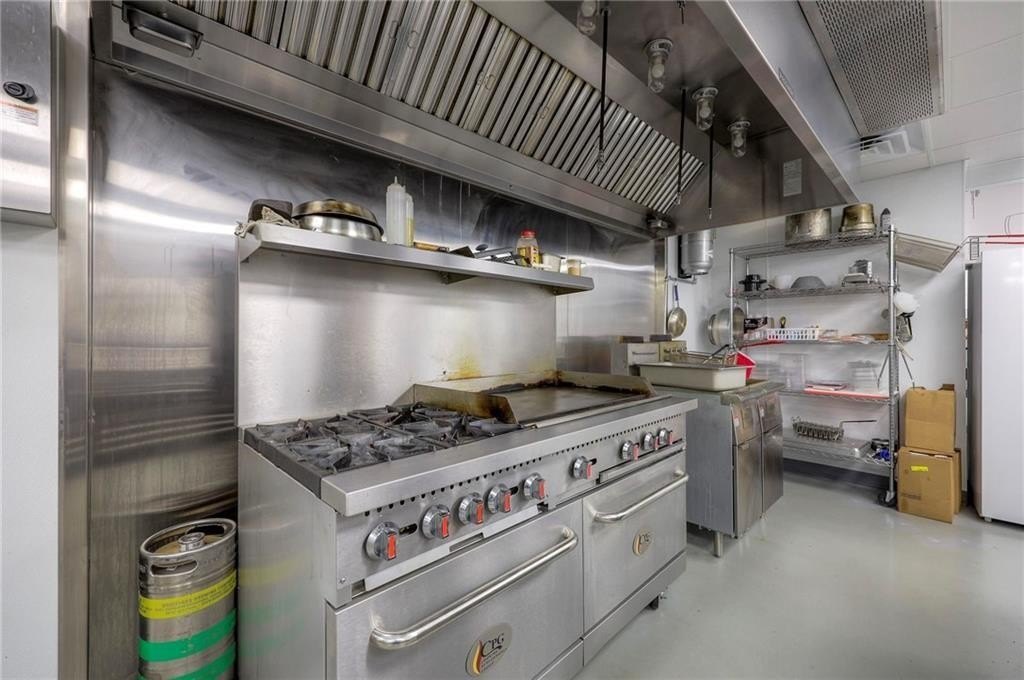
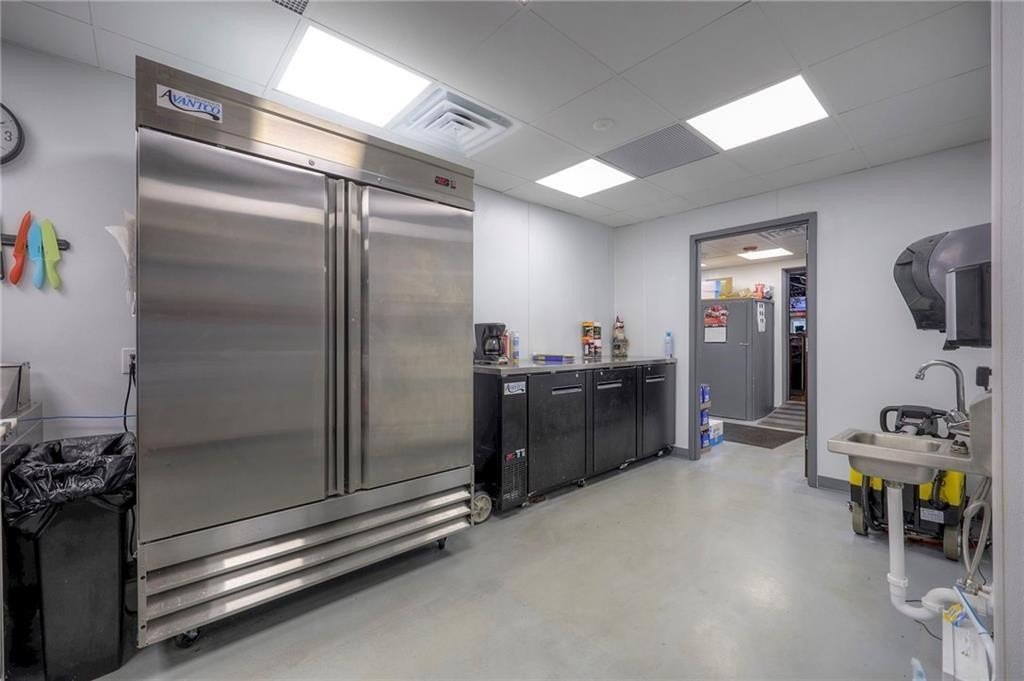
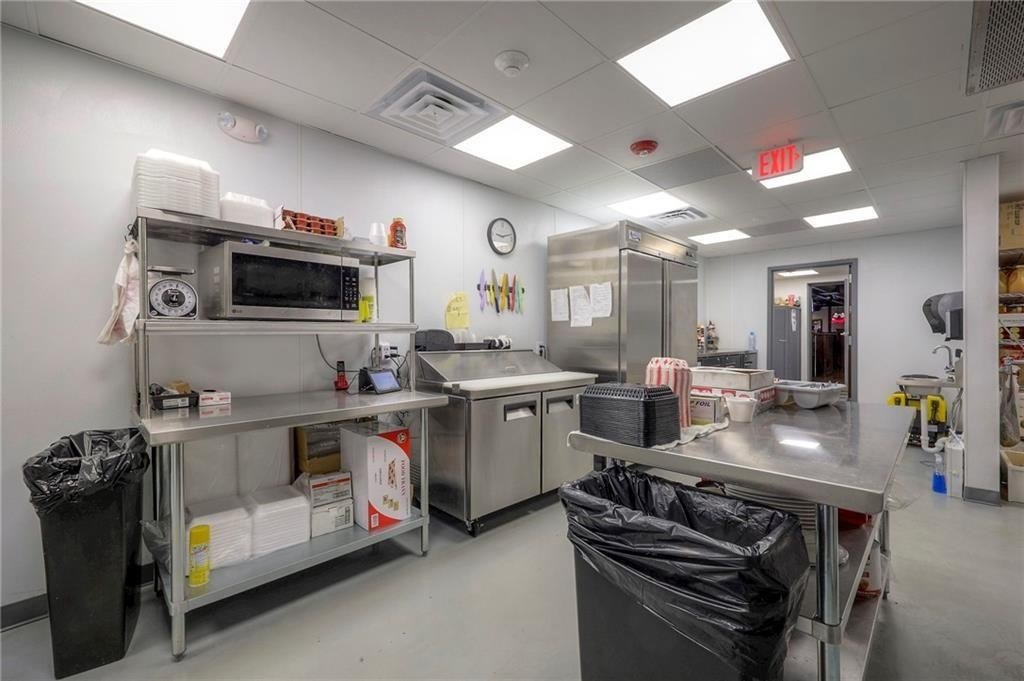
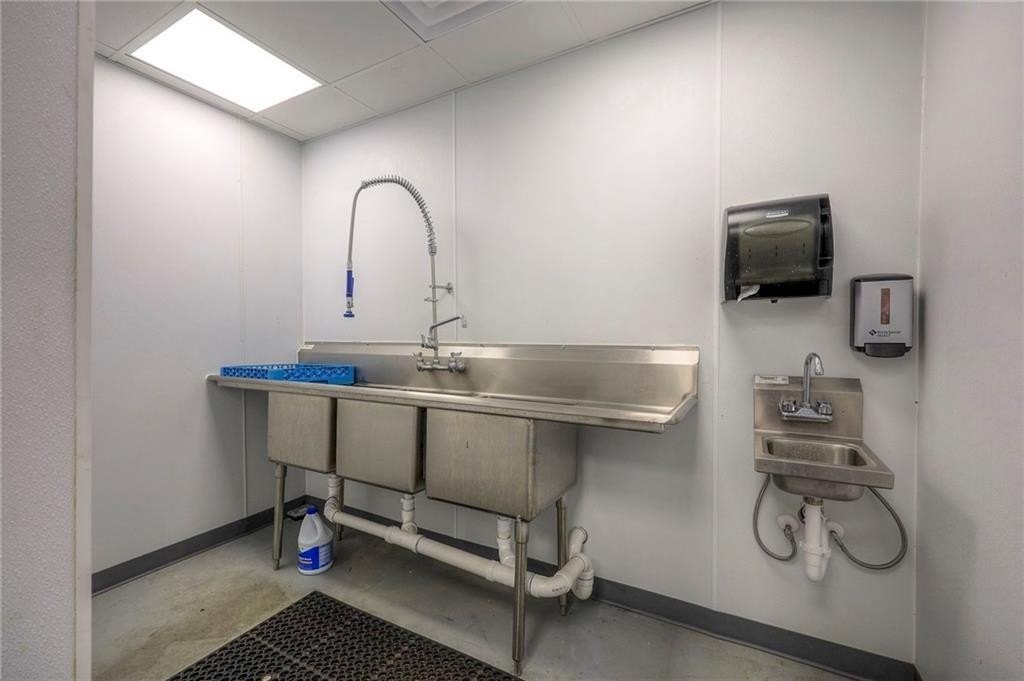
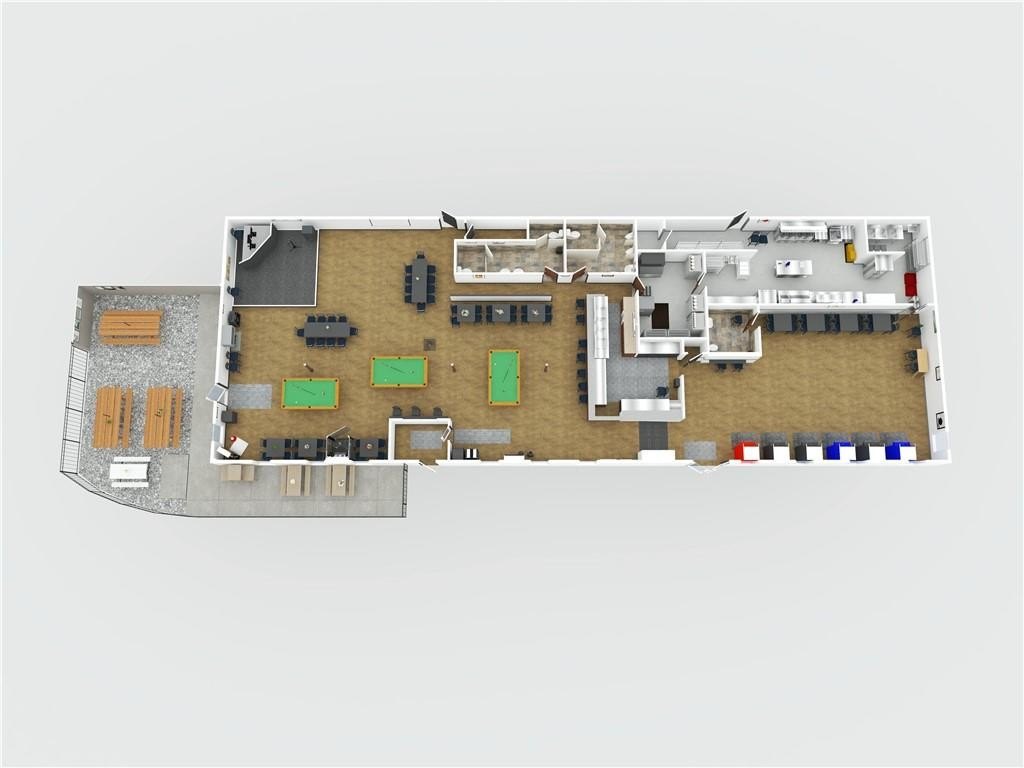
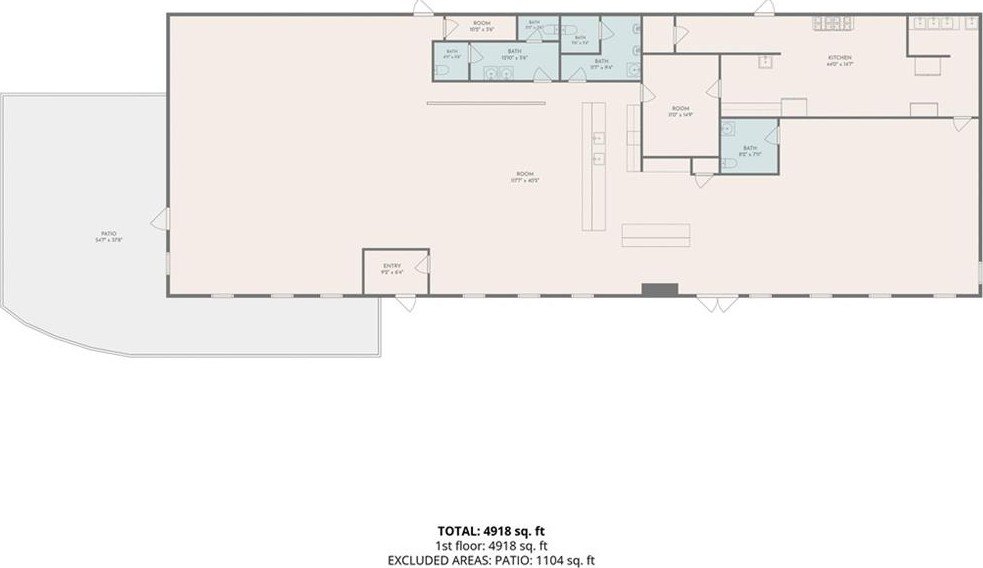
This Kansas City bar and grill property has a recently completed interior renovation designed to meet current city code. The main level contains nearly 5,000 square feet of finished space, while the basement offers nearly 5,000 square feet of unfinished area with walkout capacity. A patio seating area, building signage, and a paved parking lot with 55 spaces are included. Water is available at the property, which is zoned B2-2 and was built in 1972.
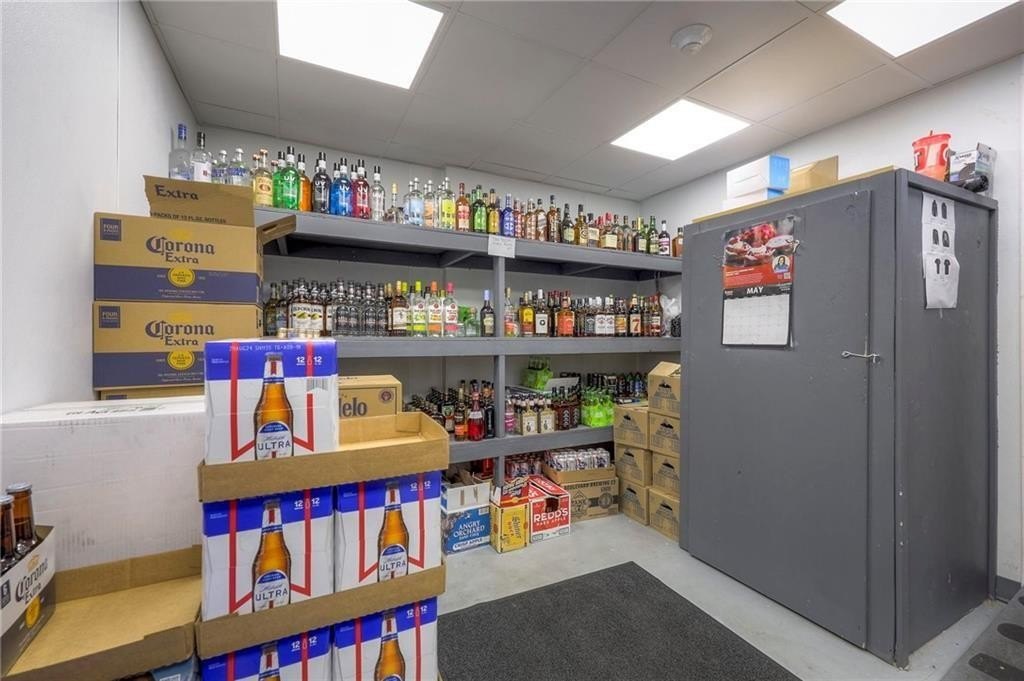
The existing sports bar-grill operation is expected to remain open through the sale. A 3am operating license may be transferable, subject to applicable requirements. Most contents are owned, excluding the gaming systems and ATM. The property could potentially accommodate a cigar lounge or be divided into multiple retail units, as it previously operated in a multi-unit configuration.
The existing sports bar-grill operation is expected to remain open through the sale. A 3am operating license may be transferable, subject to applicable requirements. Most contents are owned, excluding the gaming systems and ATM. The property could potentially accommodate a cigar lounge or be divided into multiple retail units, as it previously operated in a multi-unit configuration.
Key Highlights
- Nearly 5,000 square feet of finished main‑level space
- Nearly 5,000 square feet of unfinished basement area with walkout capacity
- 55 paved parking spaces with patio seating area
Property Analytics
Unlock full access to Insights
Subscribe to Realmo Intelligence
Open Analytics
Current Use
Lease Details
Single-tenant
Tenancy
Turnkey business
Opportunity
Location Intelligence
Trade Area within ½ mile
98
Businesses Nearby
16k
Monthly Visits Nearby
Under-served
Demand for This Use
Explore this area
Business Placement
Foot Traffic Nearby
Shops & Services 100%
Dollar Tree
Shops & Services
9,317 visits/mo
0.1 miles
Phillips 66
Shops & Services
6,521 visits/mo
0.1 miles
Demographics for 64117, MO
15,155
Population
7,091
Households
2.1
Avg Household Size
35
Median Age
21%
College-Educated
89%
High-School Grad
6.0 sq mi
ZIP Area
2,526
Density / Sq Mi
$59,219
Median Household Income
$41,738
Median Earnings
$1,034
Median Rent
$173,500
Median Home Value
Check the figures for this property
Cap Rate, Value Estimation, Potential NOI and more
View Realmo Analytics
Market
Vacancy Rate% for Retail in Kansas City, MO

Questions? Ask Rey
Realmo’s AI knows this listing — price, zoning, demand, history. Ask anything.




Similar Off Market Nearby
- Tequila’s Restaurant Bar and Grill — 5010 NE Parvin Rd, Kansas City, MO 64117
- The Thirsty Gnome — 5044 NE Parvin Rd, Kansas City, MO 64117
- Squirrelys Bar and Grill — Winwood Shopping Center, 4545 N Brighton Ave, Kansas City, MO 64117
Frequently Asked Questions
What type of property is this?
Bar & Pub - Recently renovated commercial space includes patio seating, paved parking, and a finished main level with additional basement capacity.
Where is this bar & pub located?
The property is located at 4545 N Brighton Avenue Kansas City, MO.
What is the asking price?
The asking price for this property is $1,600,000.
What are key features of this property?
This property features: Nearly 5,000 square feet of finished main‑level space; Nearly 5,000 square feet of unfinished basement area with walkout capacity; 55 paved parking spaces with patio seating area


