Renovated Mixed-Use Building with
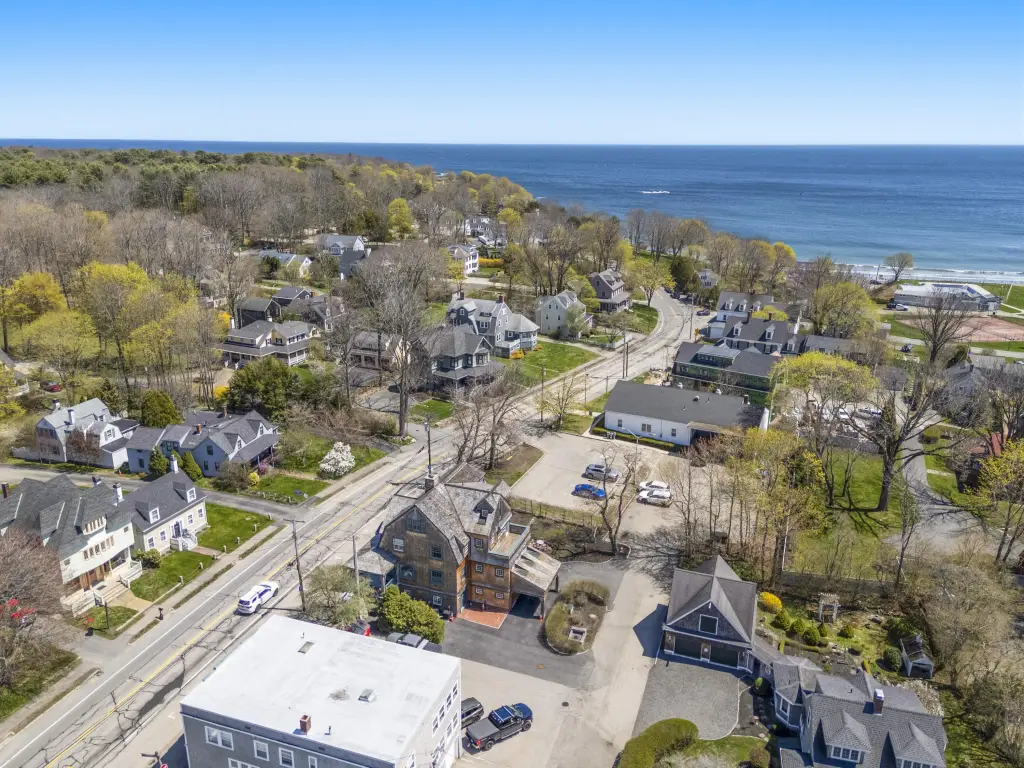

For Sale
$2,990,000
439 York Street, York, ME 03909
Multi-Family, York, ME
Property Size5,501 SF
Lot Size0.17 Acres
Price / SF$543.54
Days on Market86
Property Features for 439 York Street
General Information
Property type
Residential Multi Family
Property subtype
Other
Zoning
BUS-1
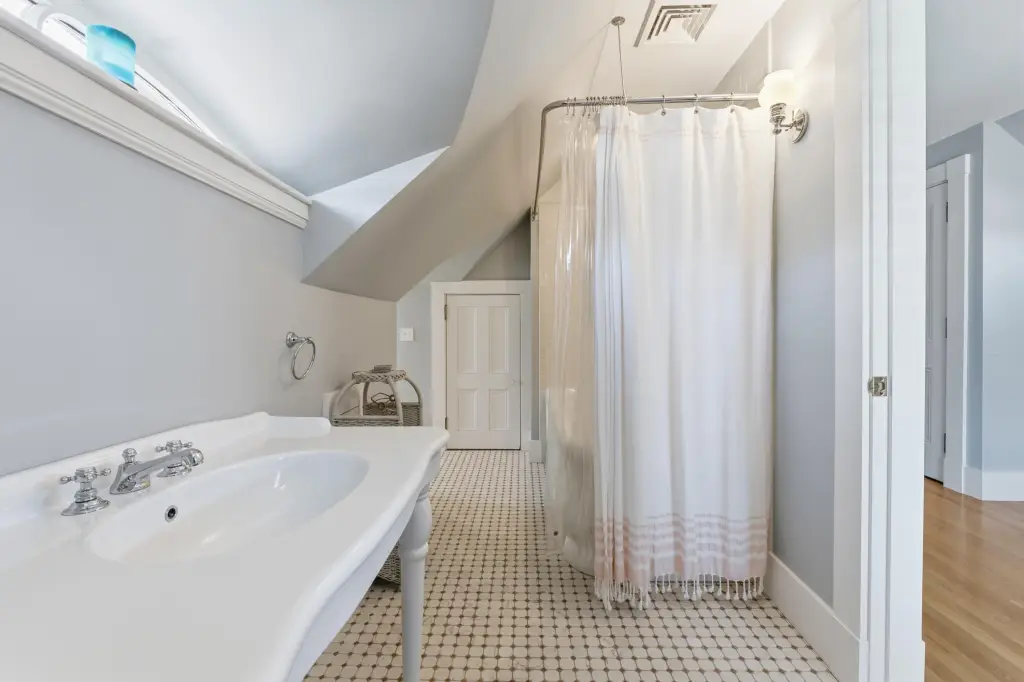
Bathrooms
4
Full bathrooms
4
Rooms
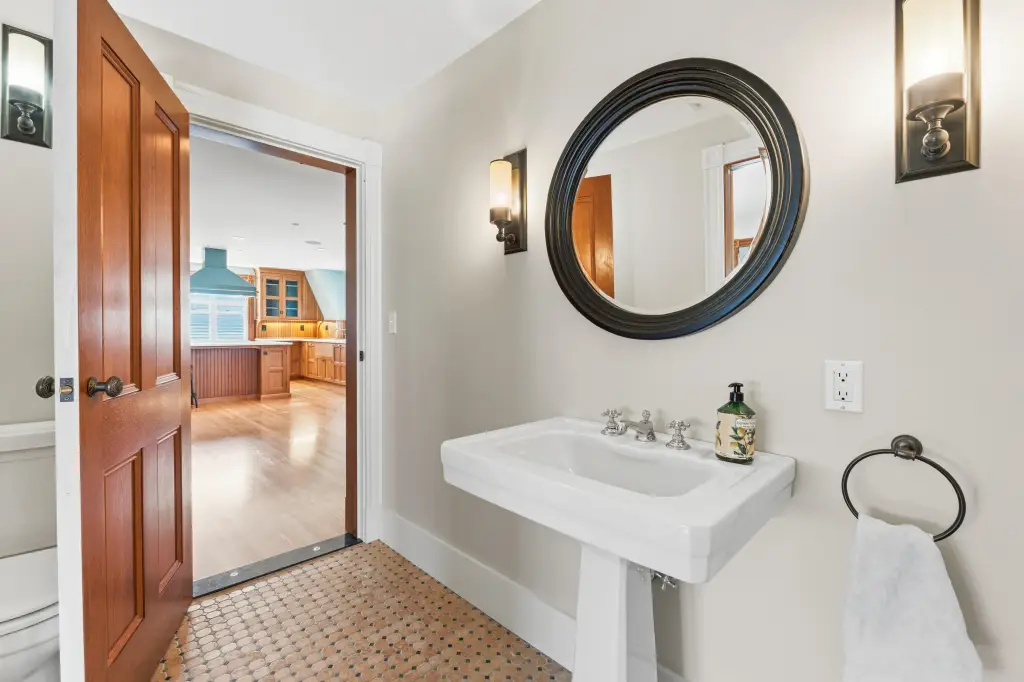
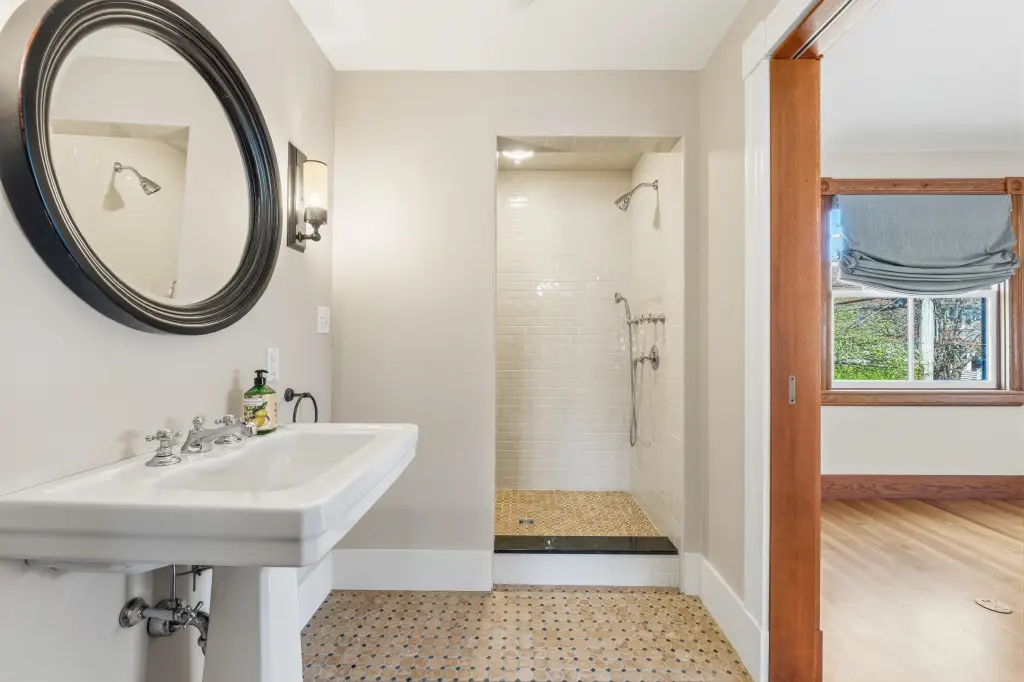
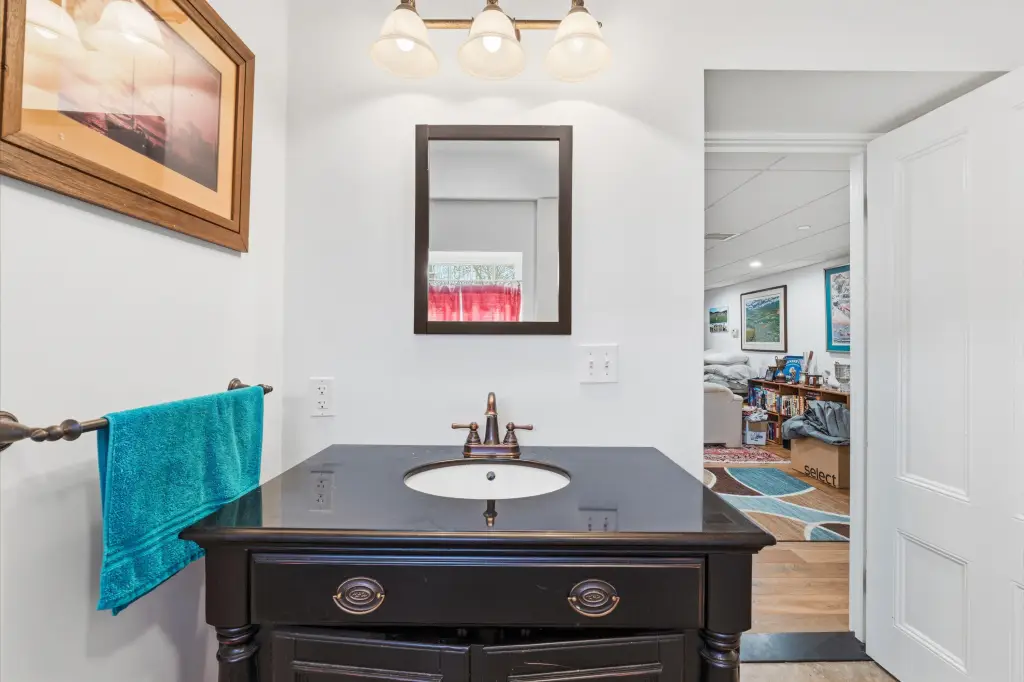
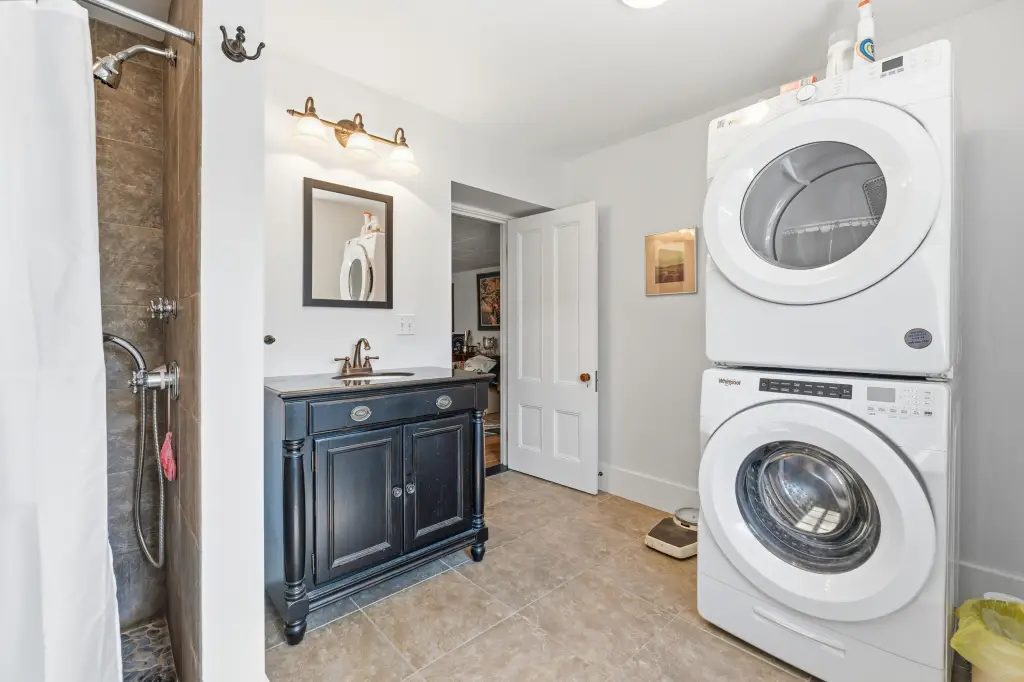
Basement, Bathroom 2, Bathroom 3, Bathroom 4, Bathroom 1
Parking features
Other, Carport, Off Street
Patio and Porch features
Deck, Porch, Patio
Interior features
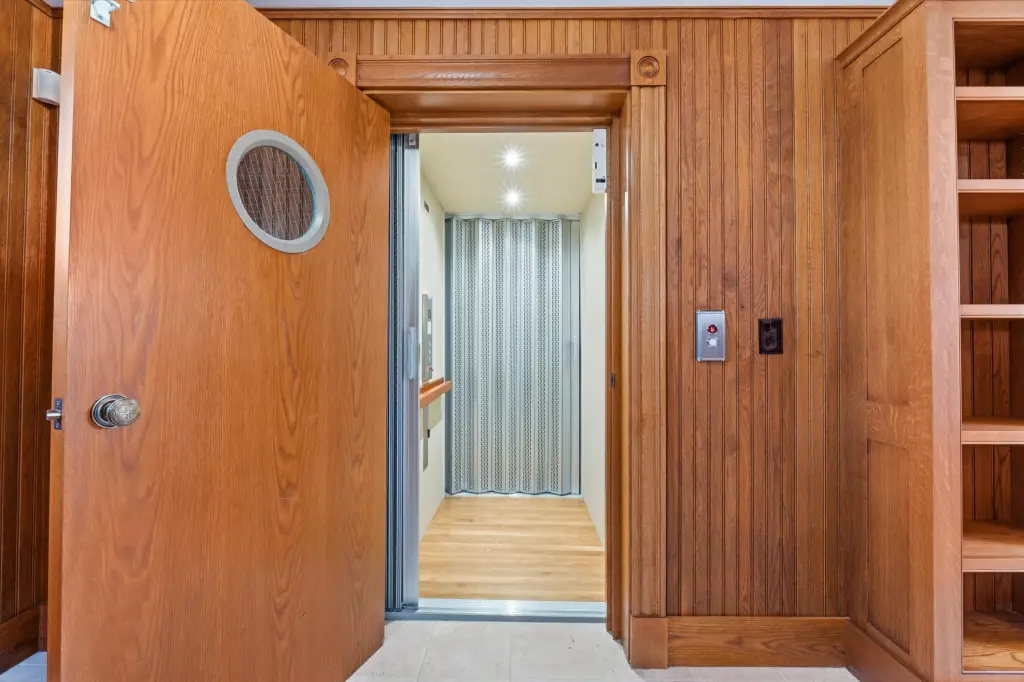
Elevator Passenger
Basement
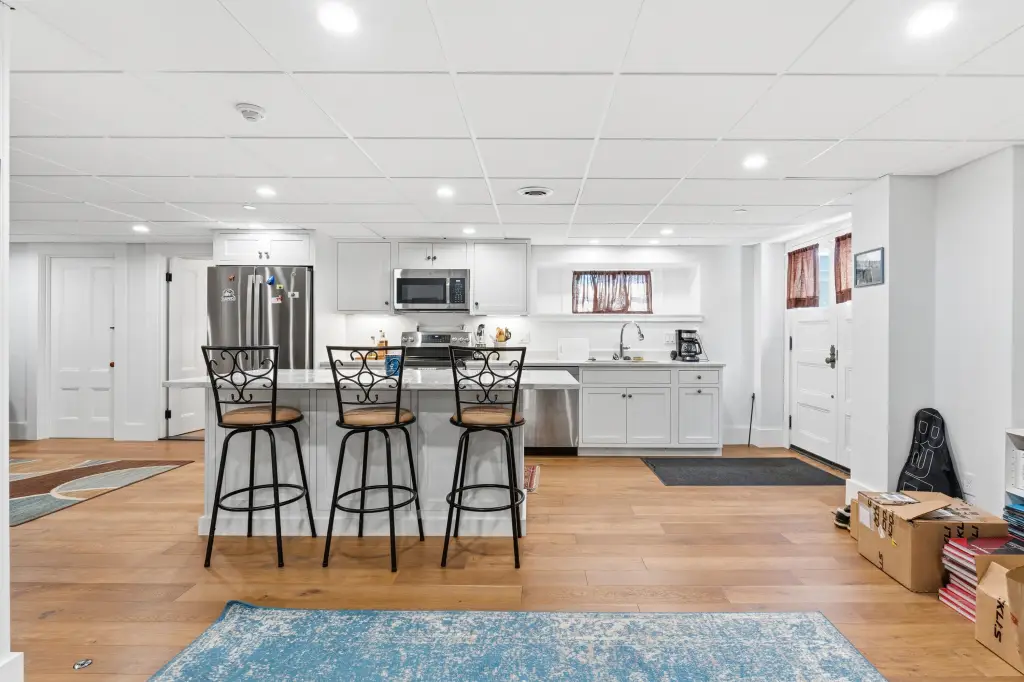
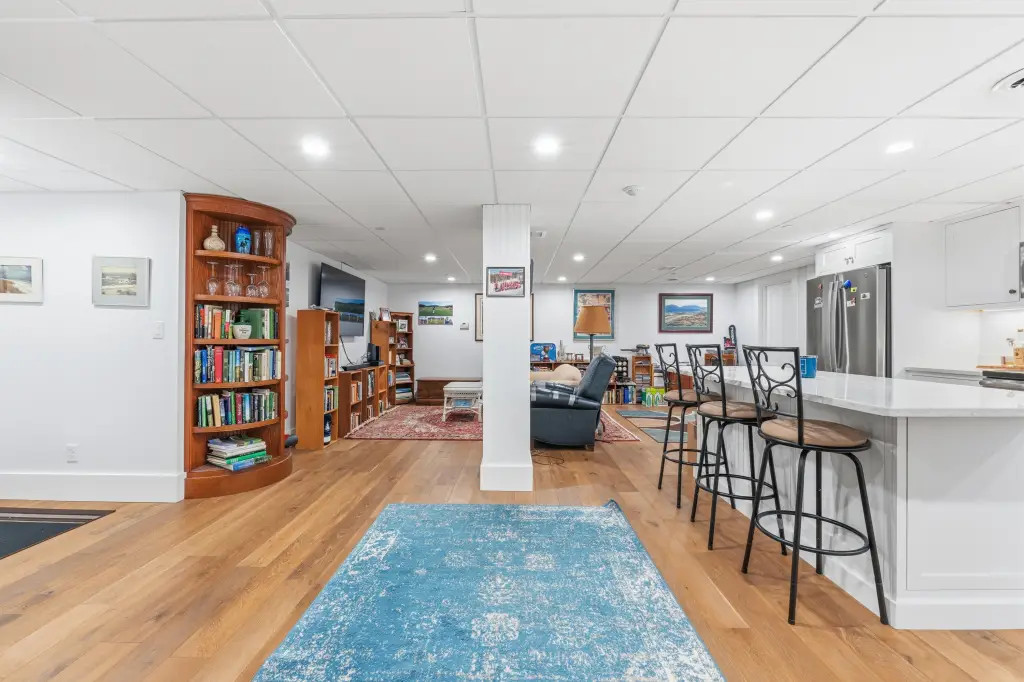
Walk-Out Access, Full, Finished
Accessibility
Accessible Elevator Installed
Lot features
Sidewalks, Near Shopping, Office Park
Standard status
Active
Size
5,501 SF
Lot size
0.17 Acres
Taxes and HOA fees
Tax Year
2025
Tax Annual Amount
11623
Utilities
Sewer type
Public Sewer
Heating system
Forced Air, Propane (Heating)
Cooling system
Central Air
Water source
Public
Amenities
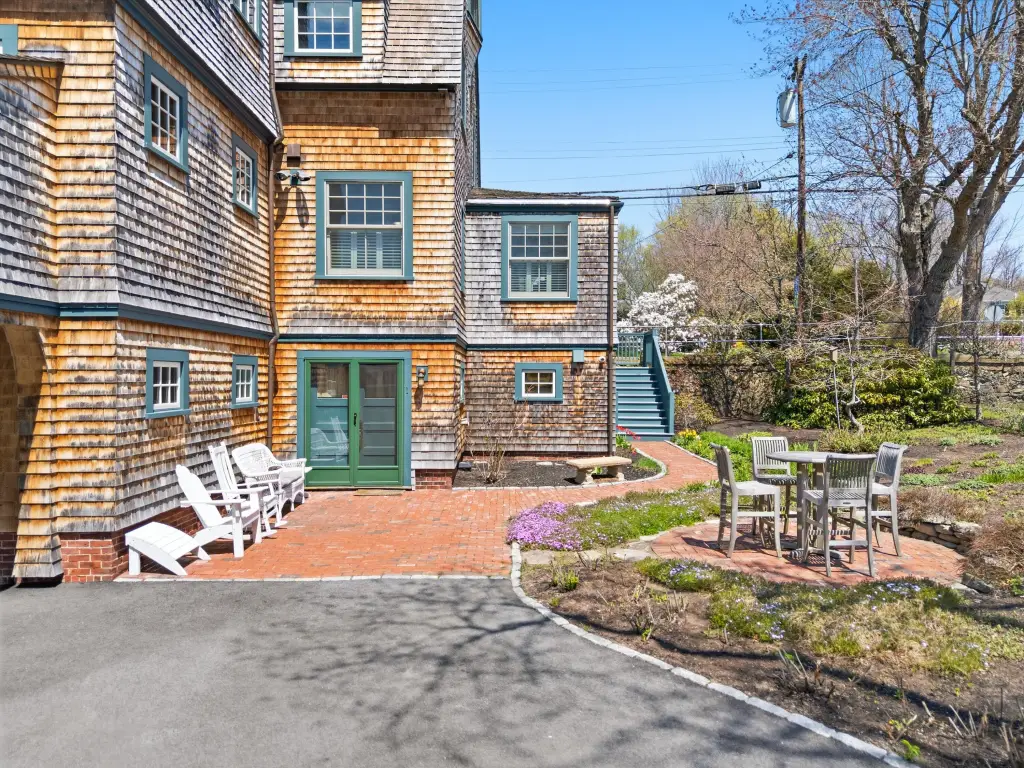
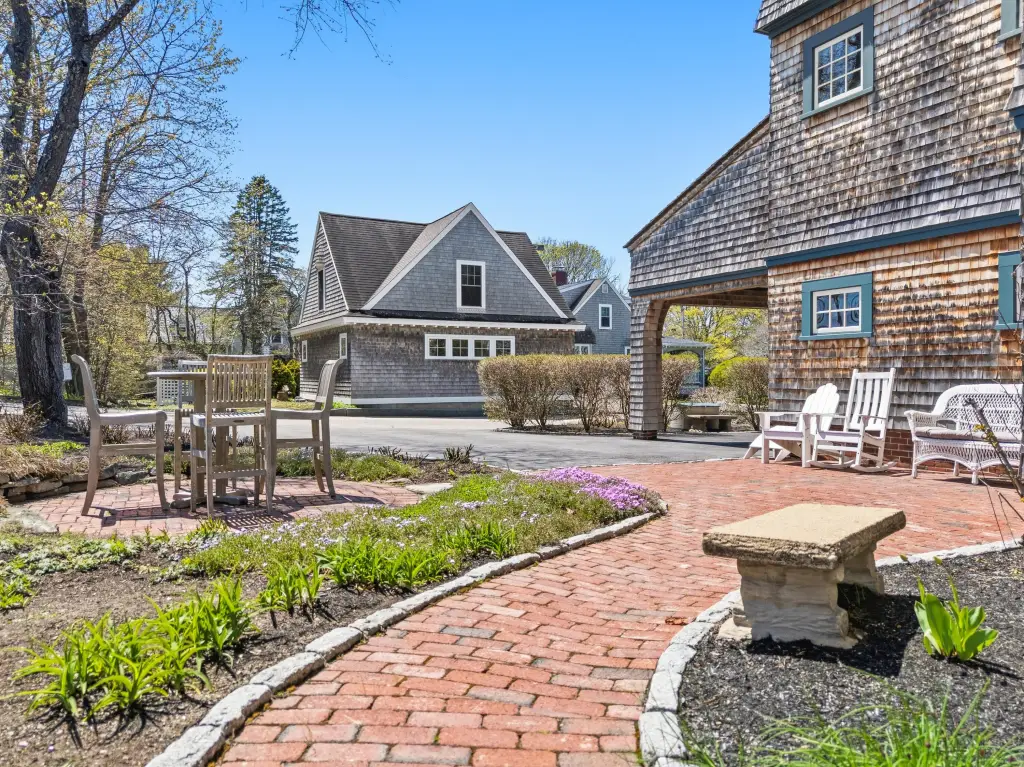
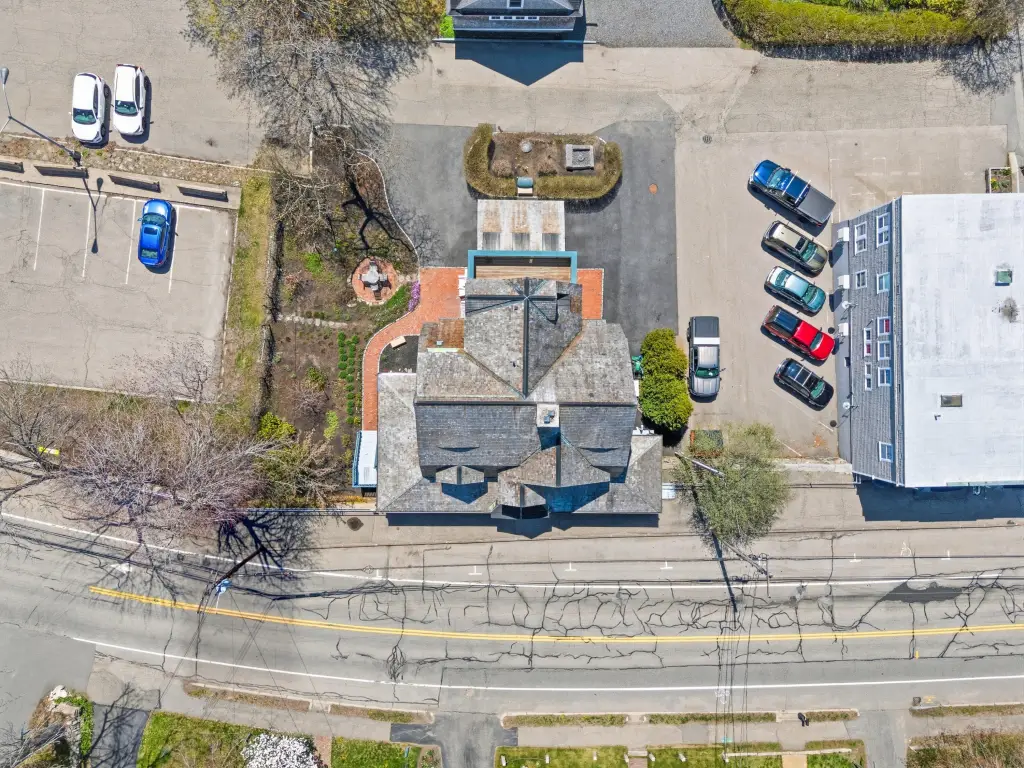
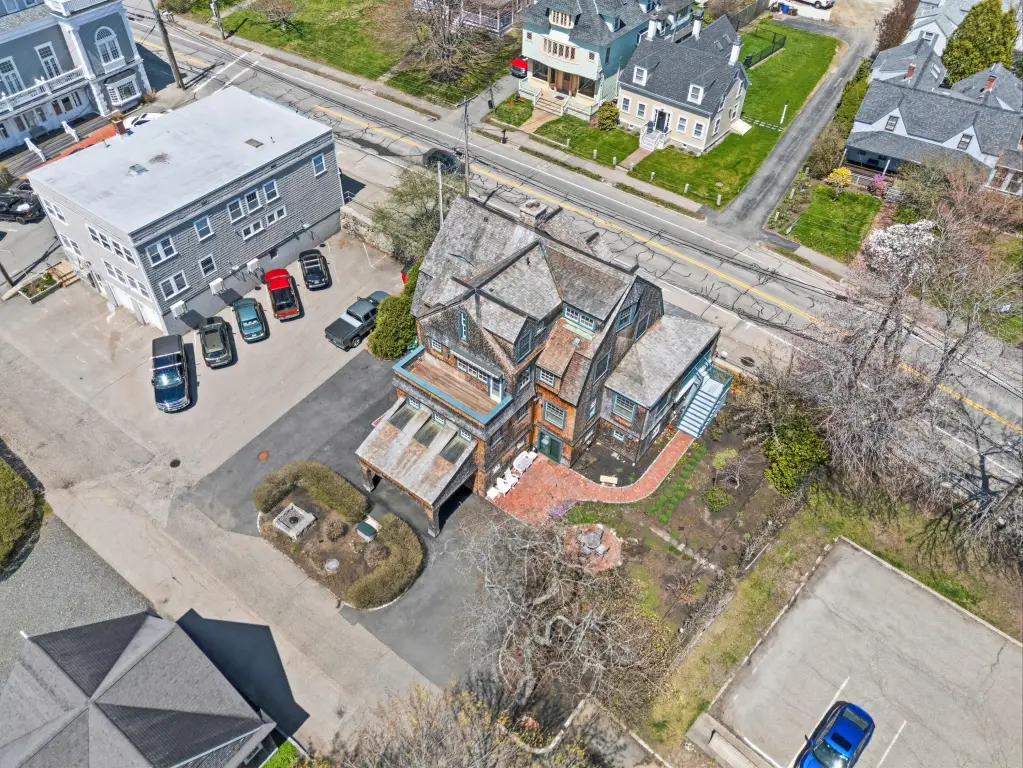
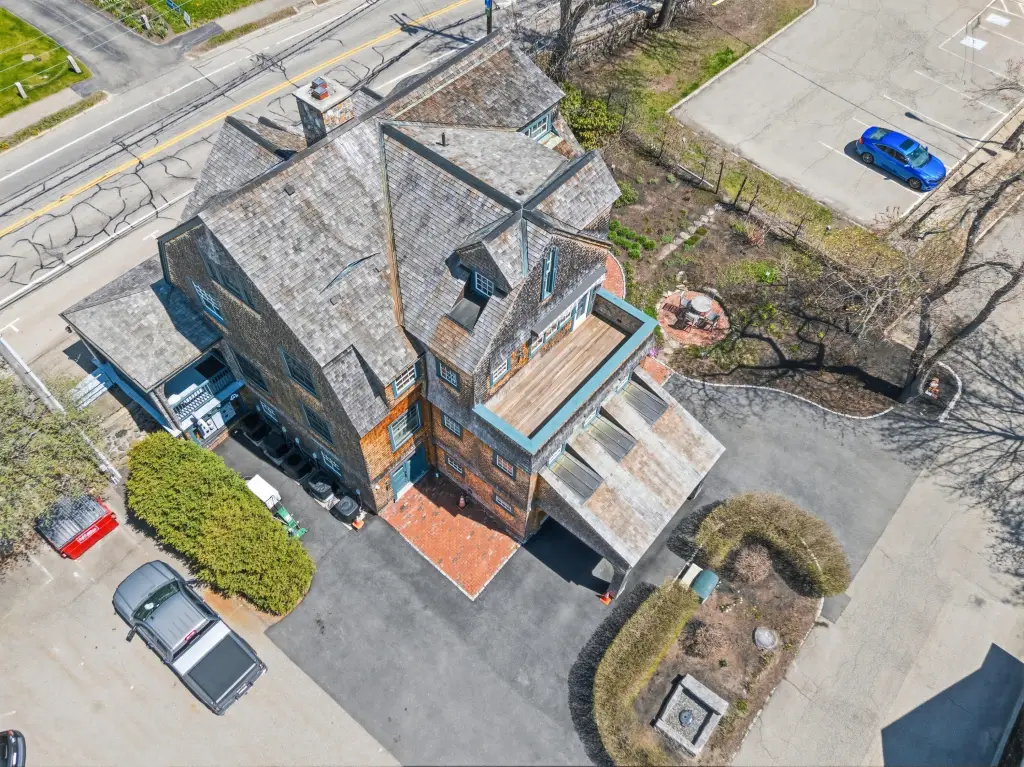
pocket gardens
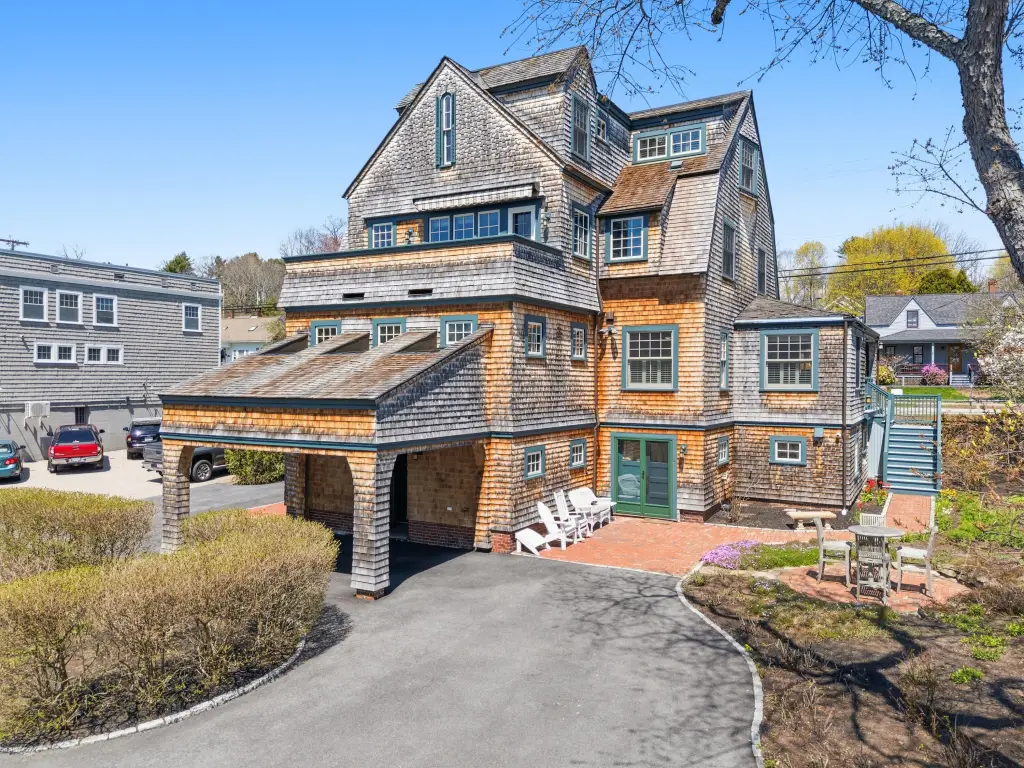
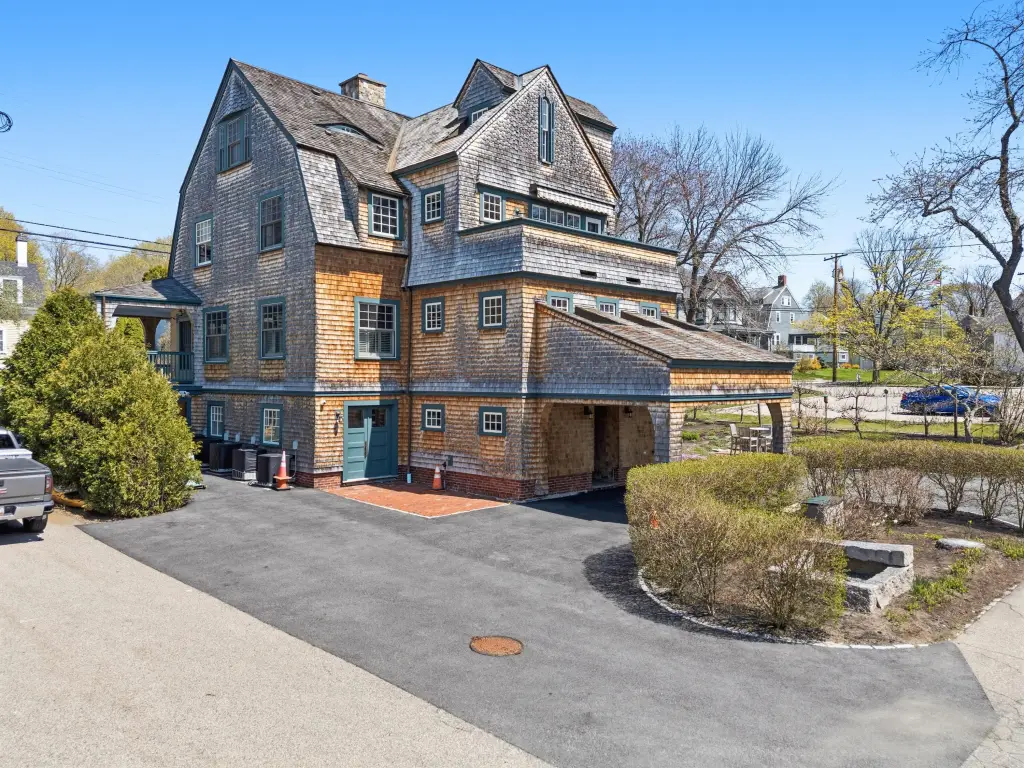
porte-cochere
Building Details
Year built
1900
Floors in Building
3
Number of units
4
Flooring type
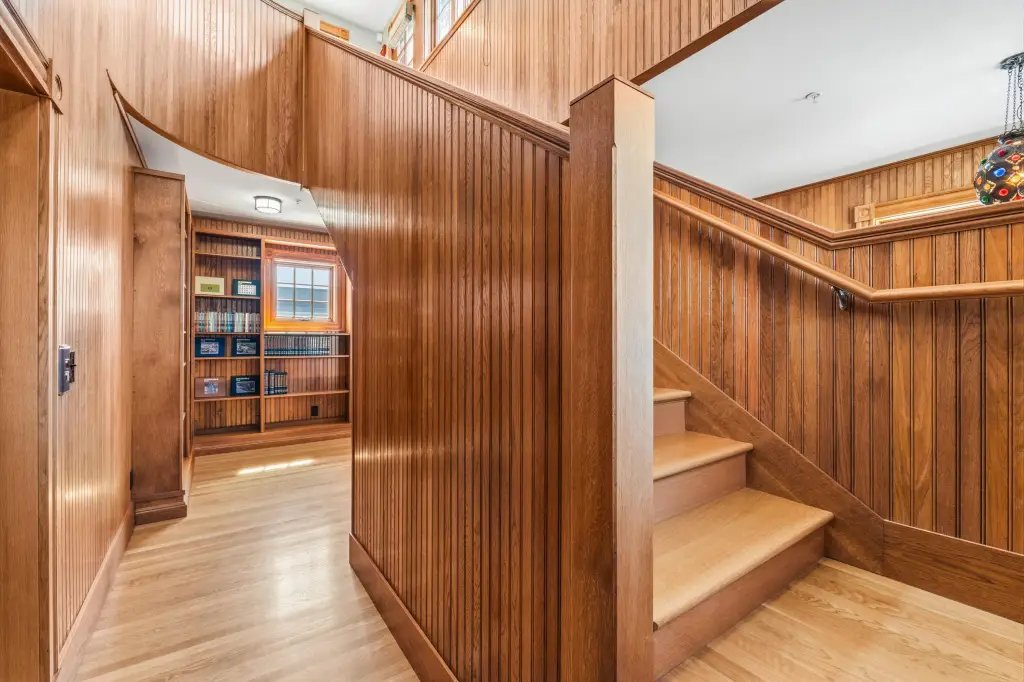
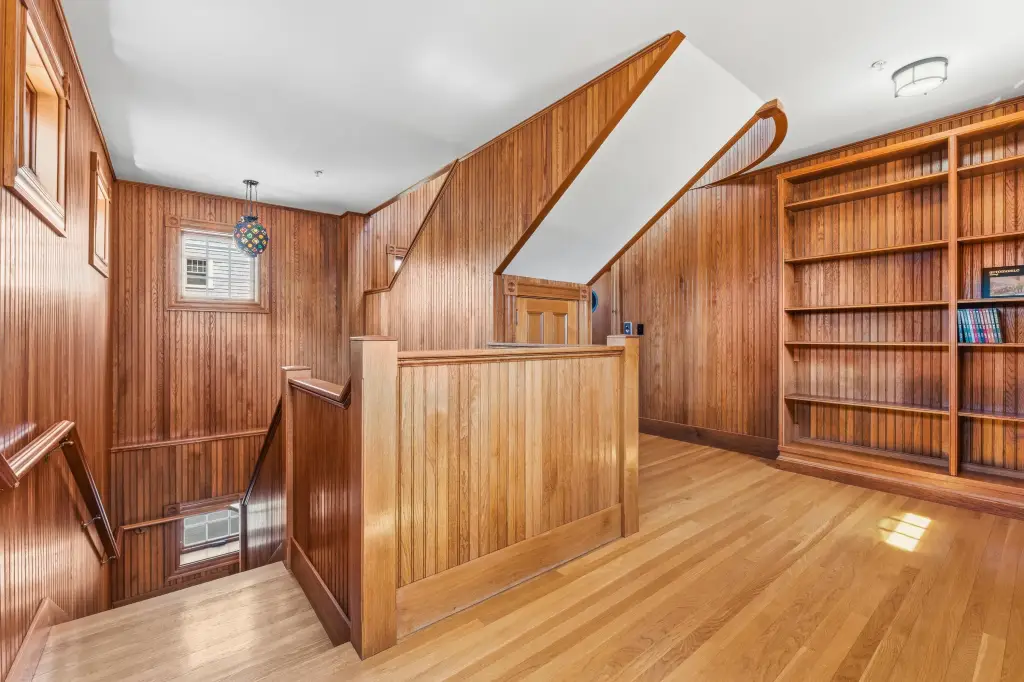
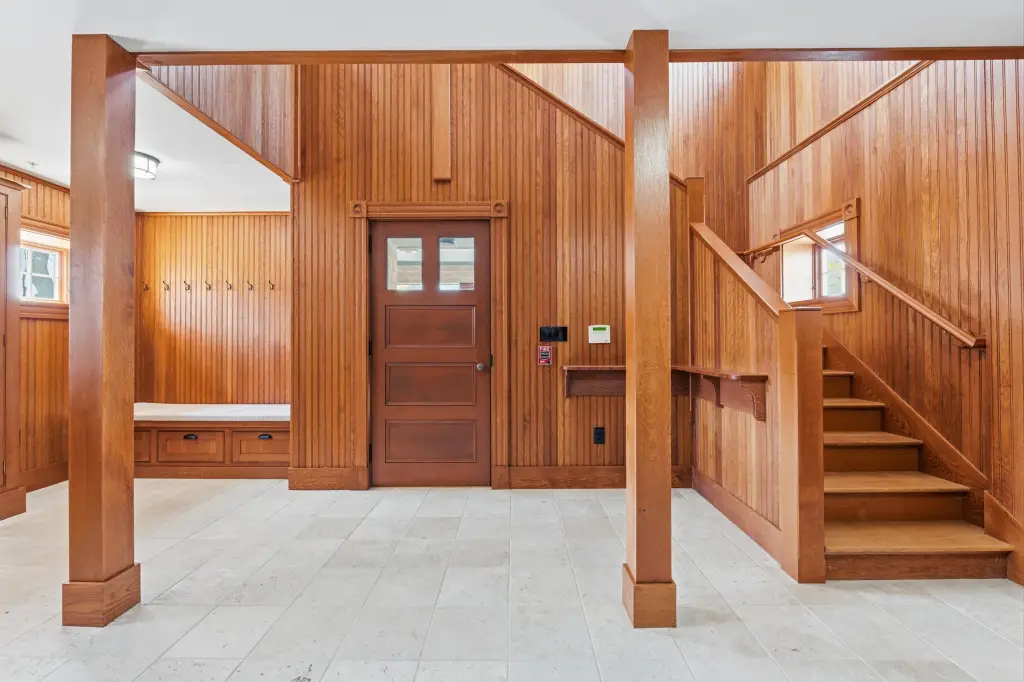
Tile, Wood
Building materials
Wood Frame, Wood Siding
Roof type
Shingle
Architectural style
Cottage
Listing Agency:
Anchor Real Estate
Listed By:
Anchor Real Estate
(207) 361-5007
Added: Jul 12
Changed: Sep 16
Last Checked: Oct 5 at 10:06PM
MLS# 1662449
Copyright © 2026 Maine Listings. All rights reserved. All information provided by the listing agent/broker is deemed reliable but is not guaranteed and should be independently verified.
Investment Insights
Based on property information with market context.
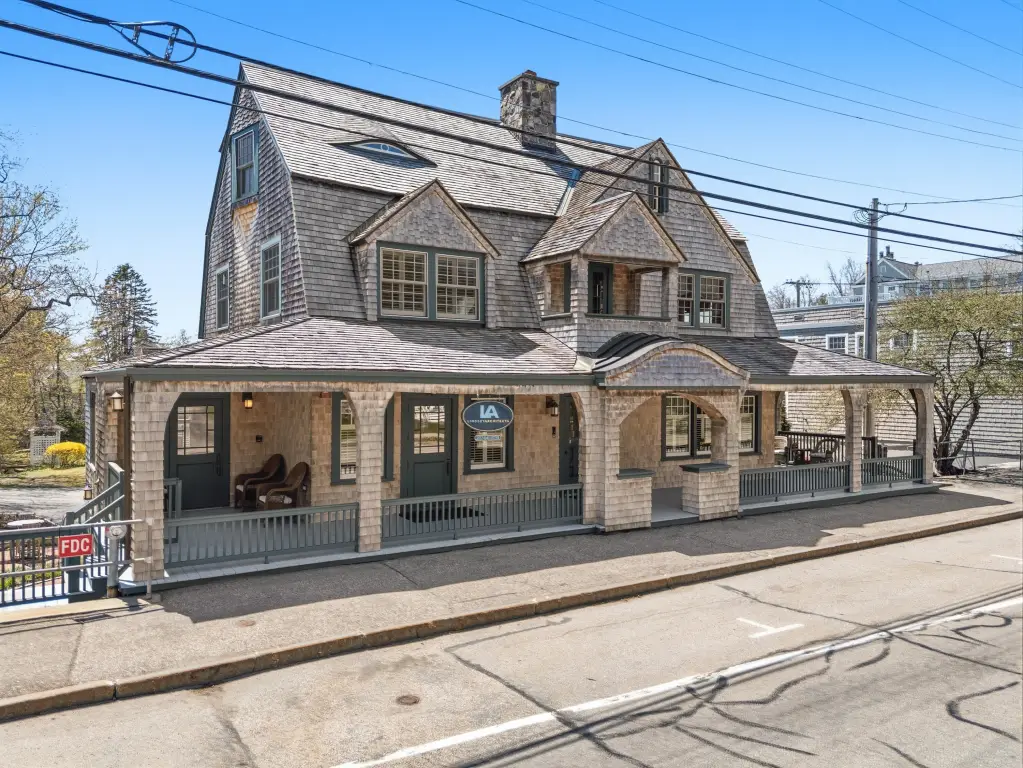
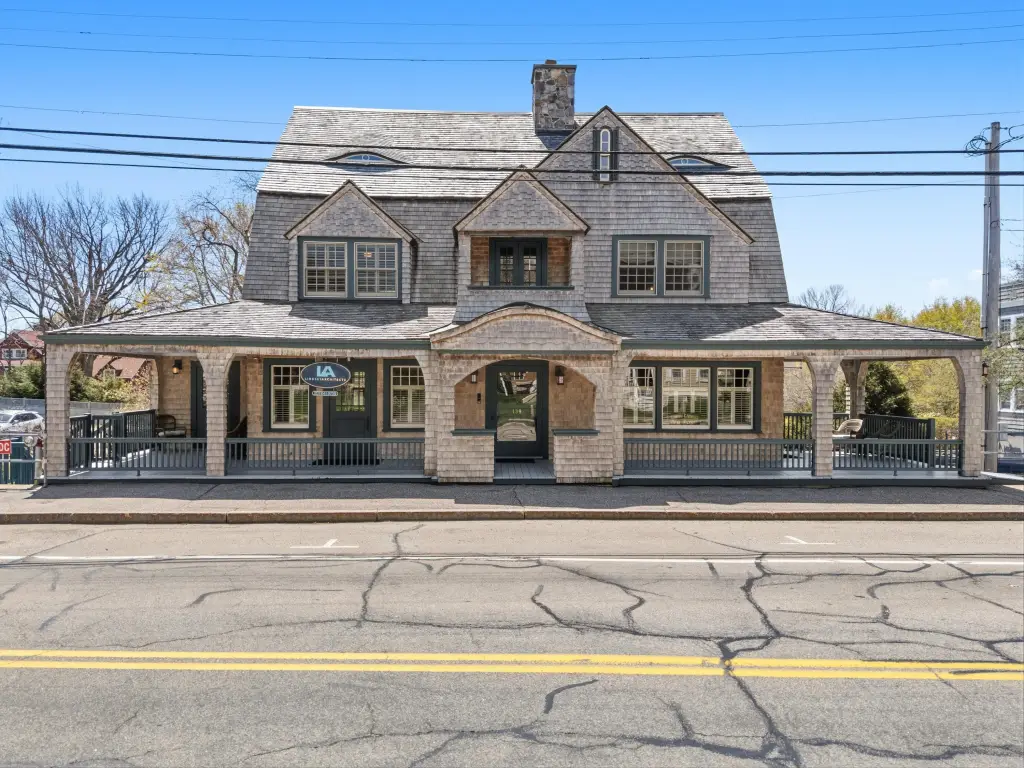
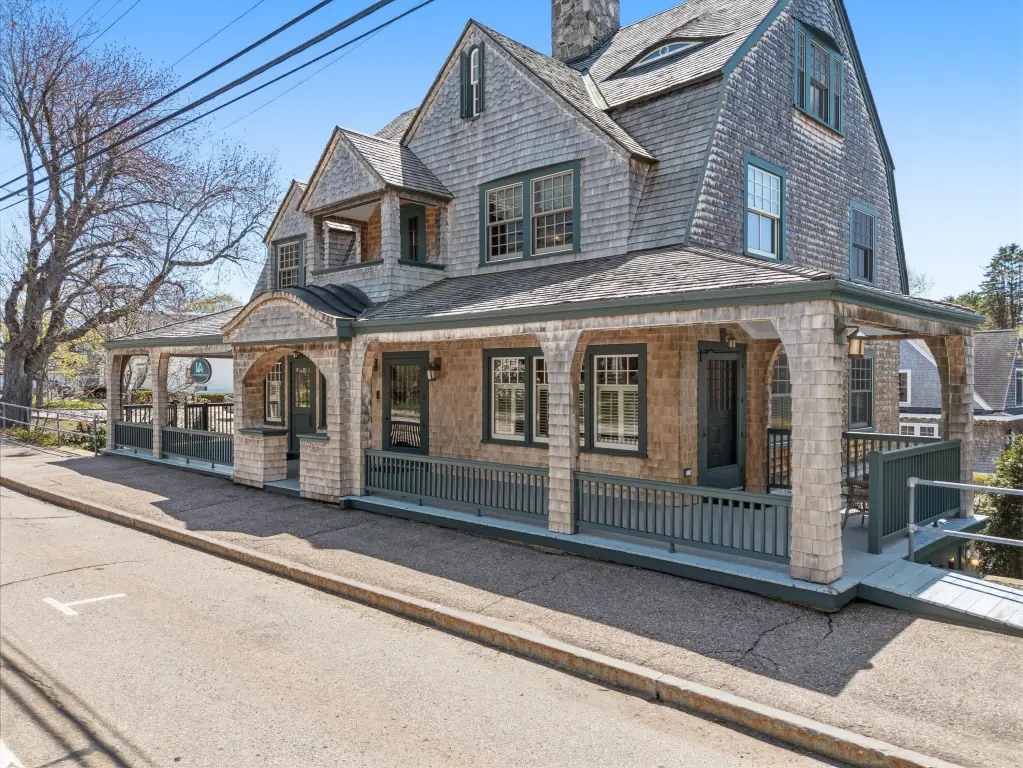
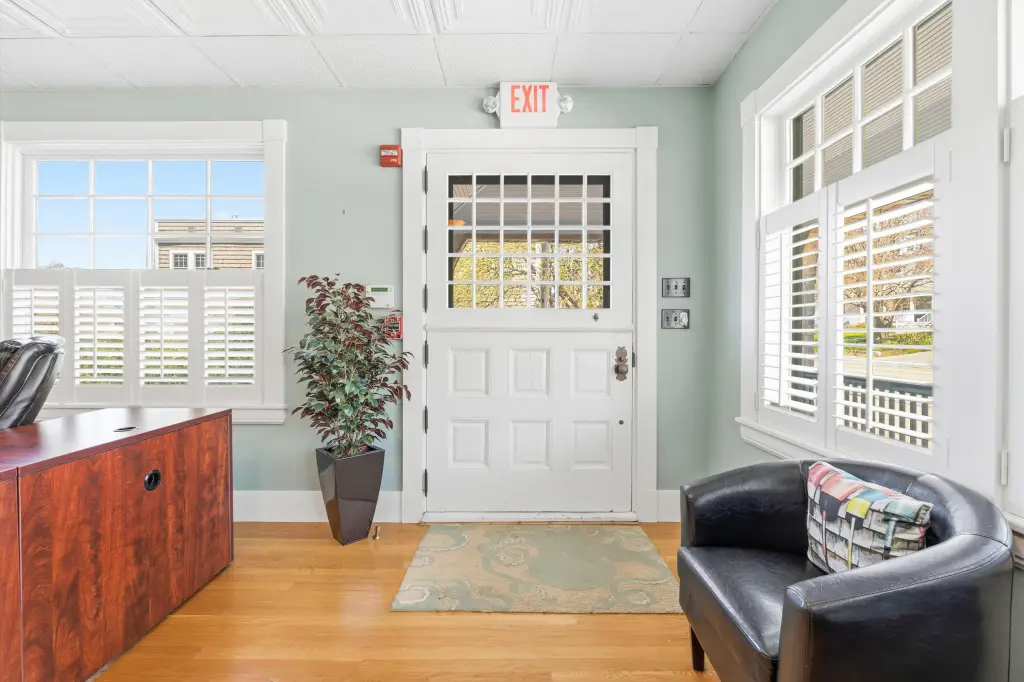
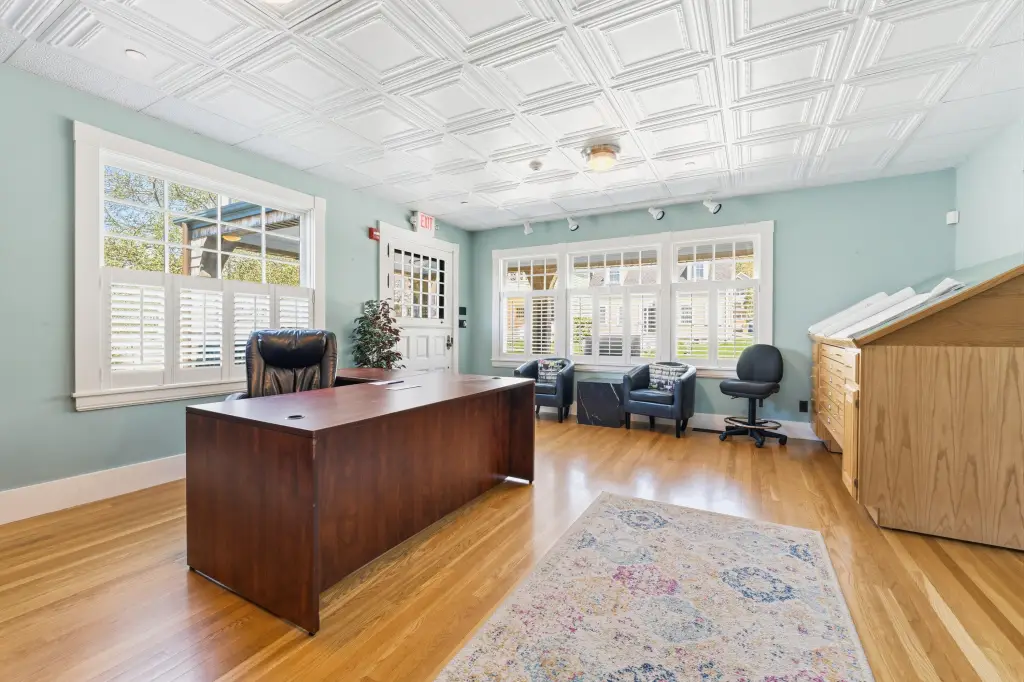
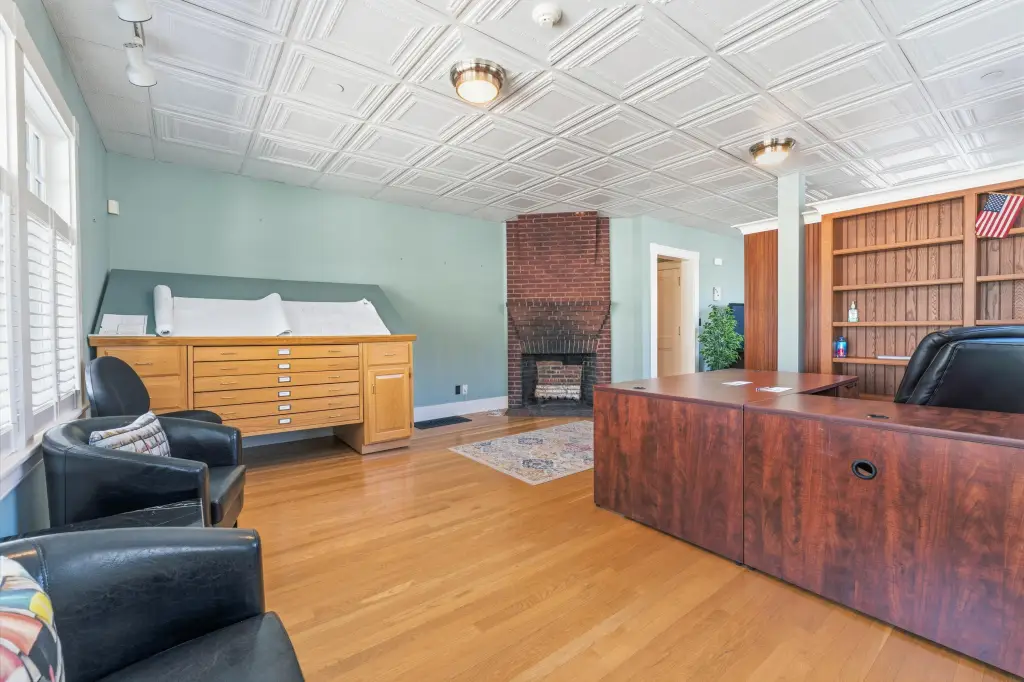
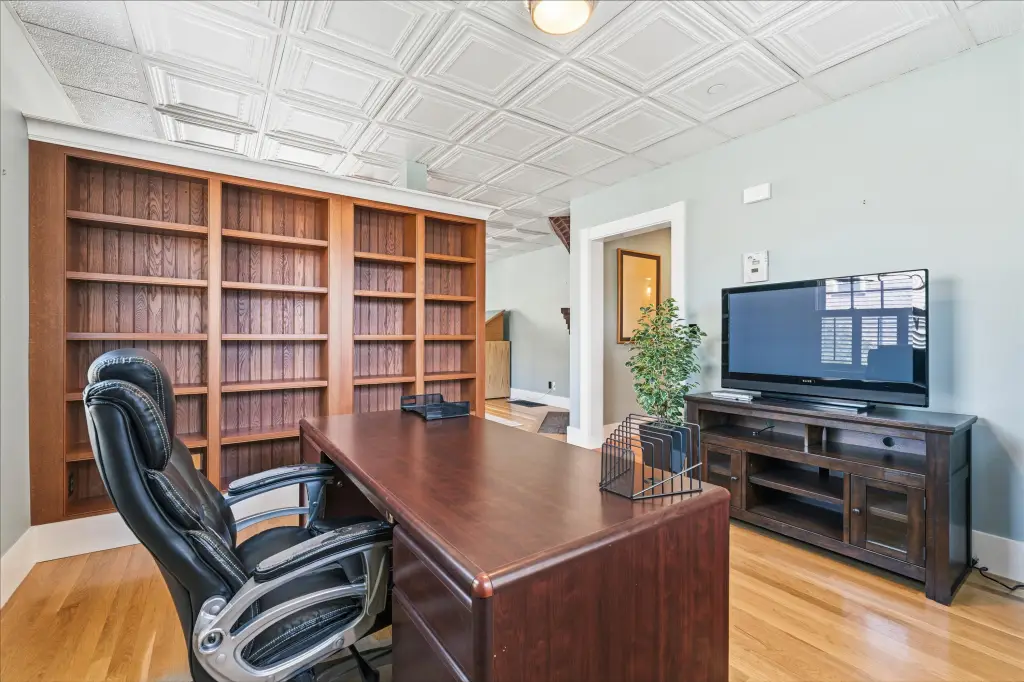
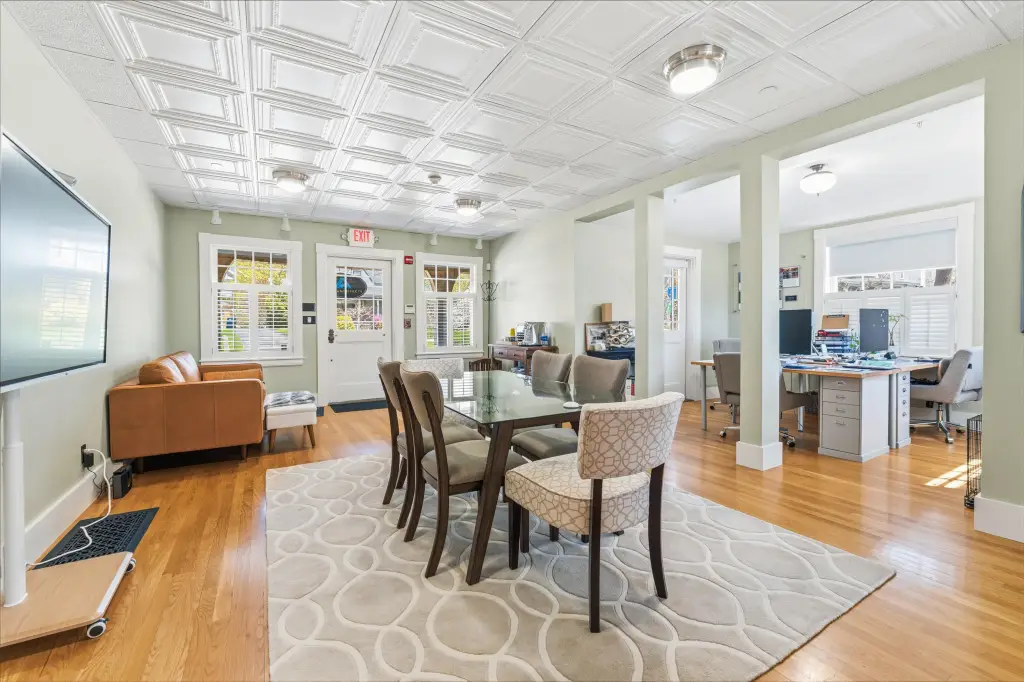
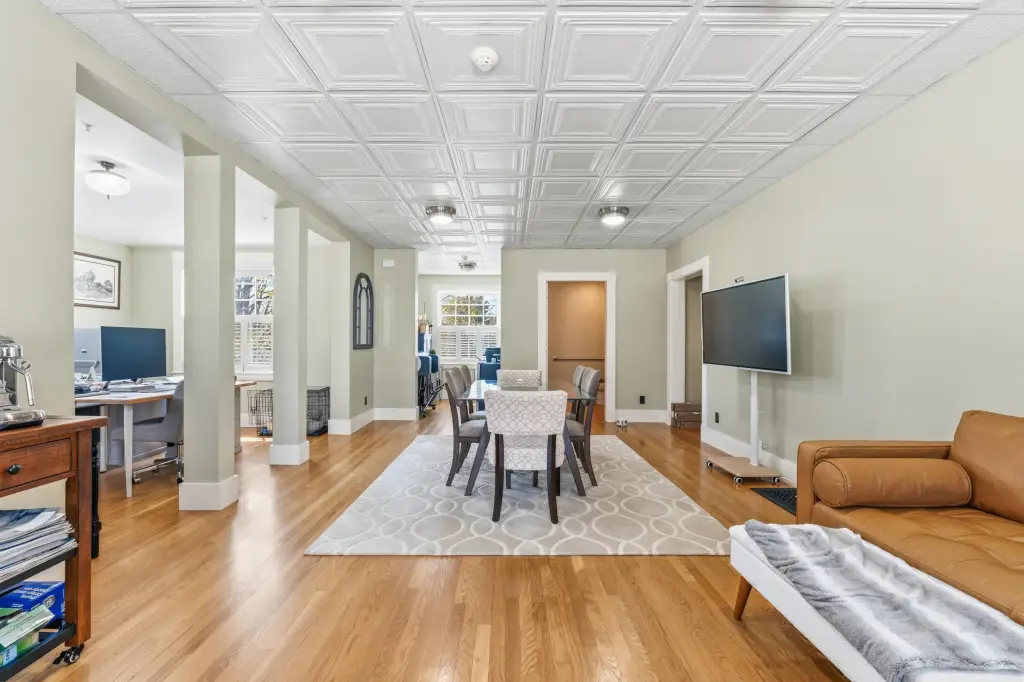
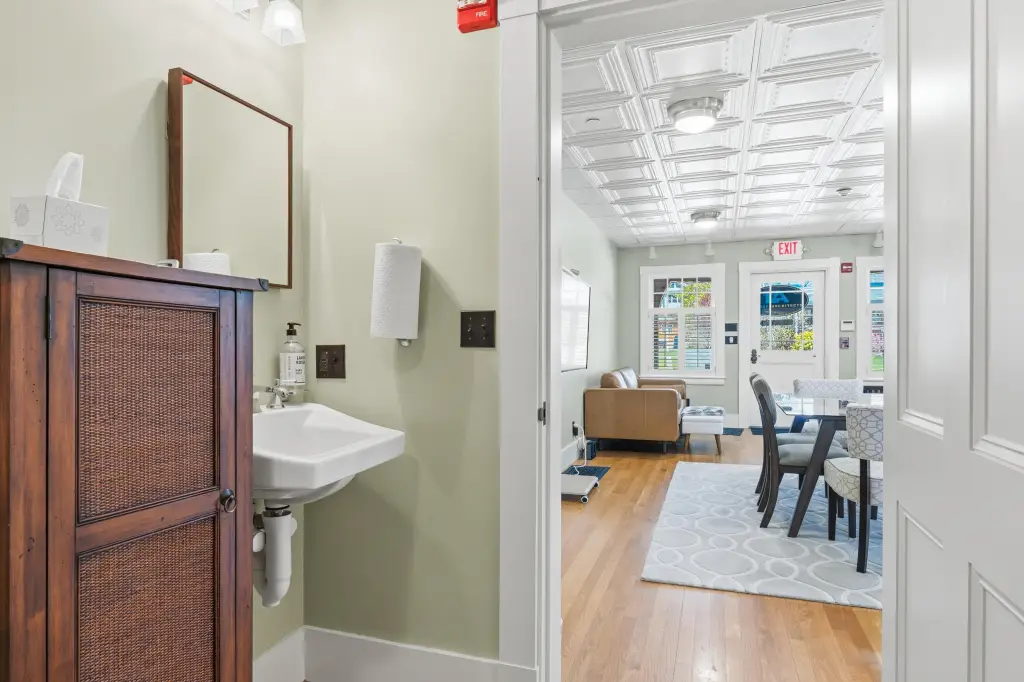
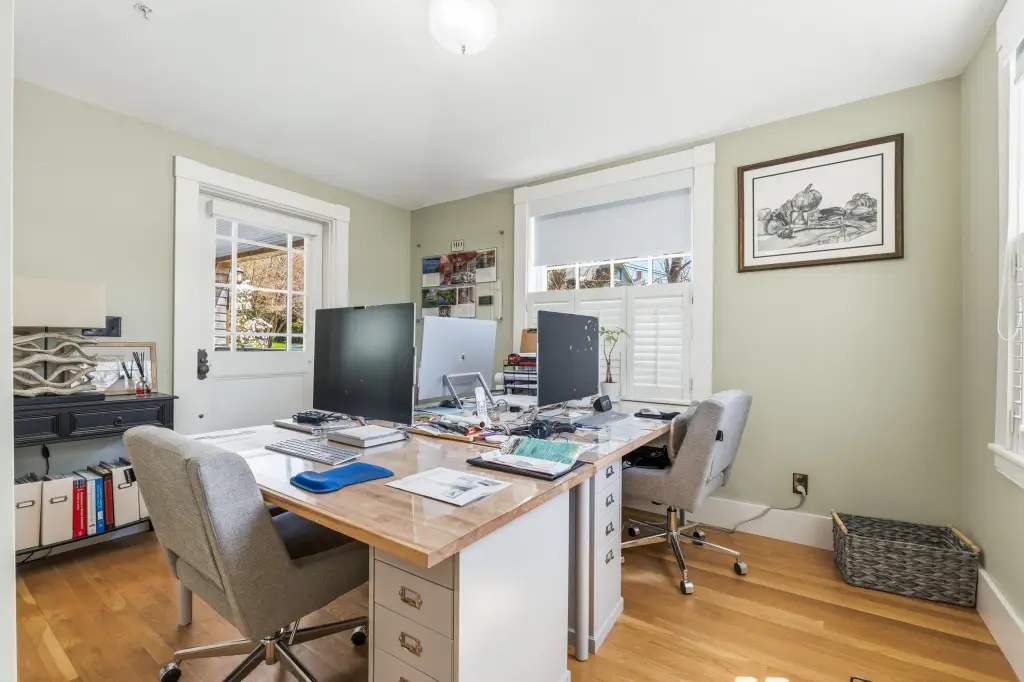
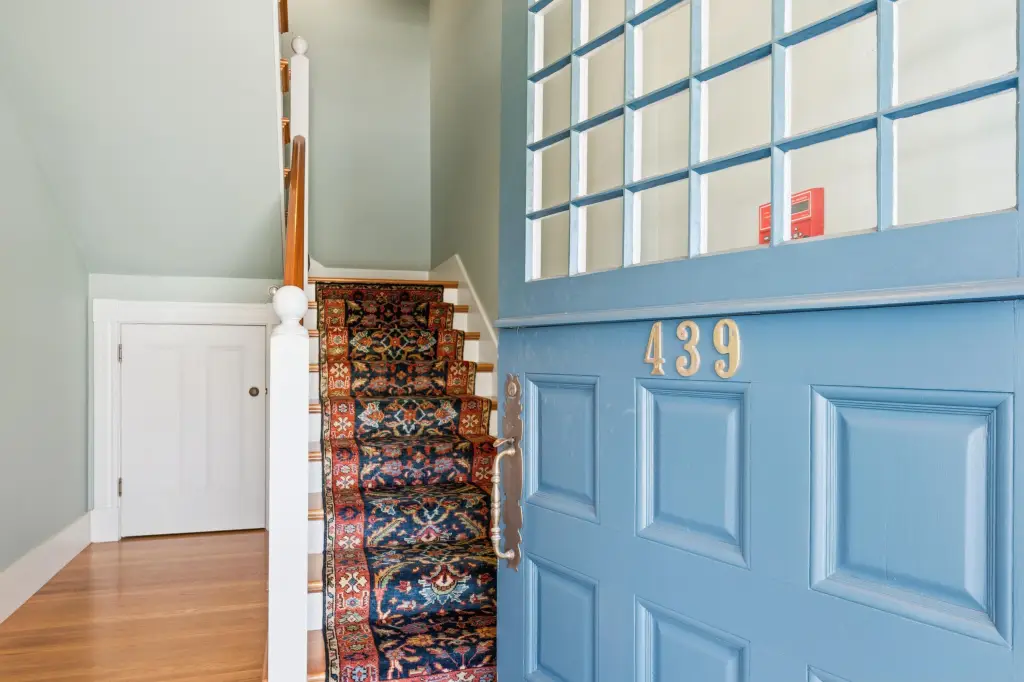
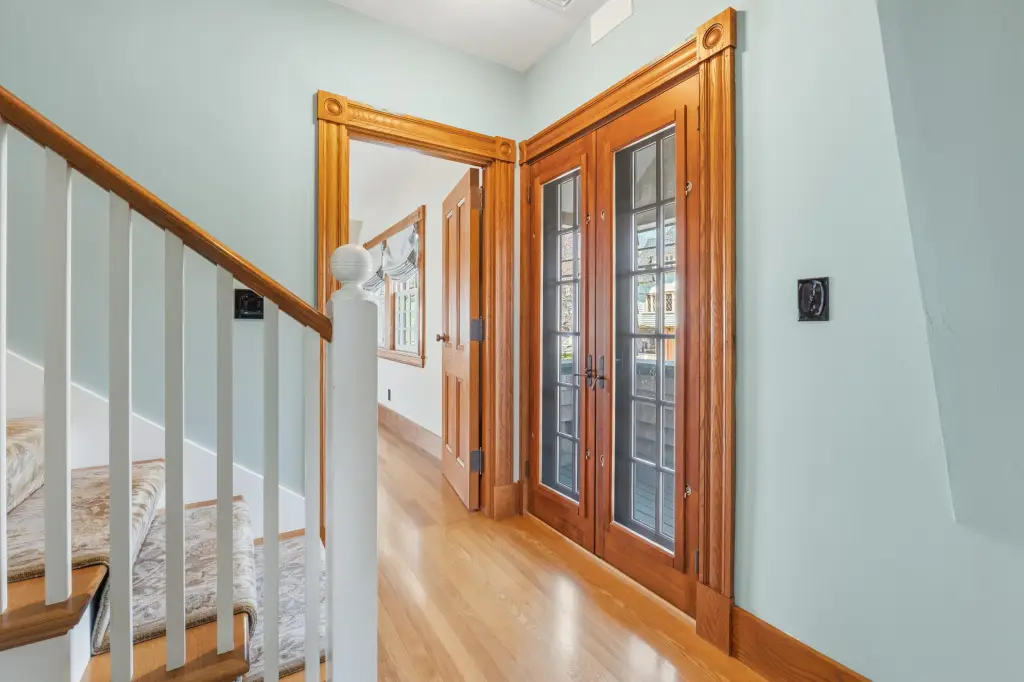
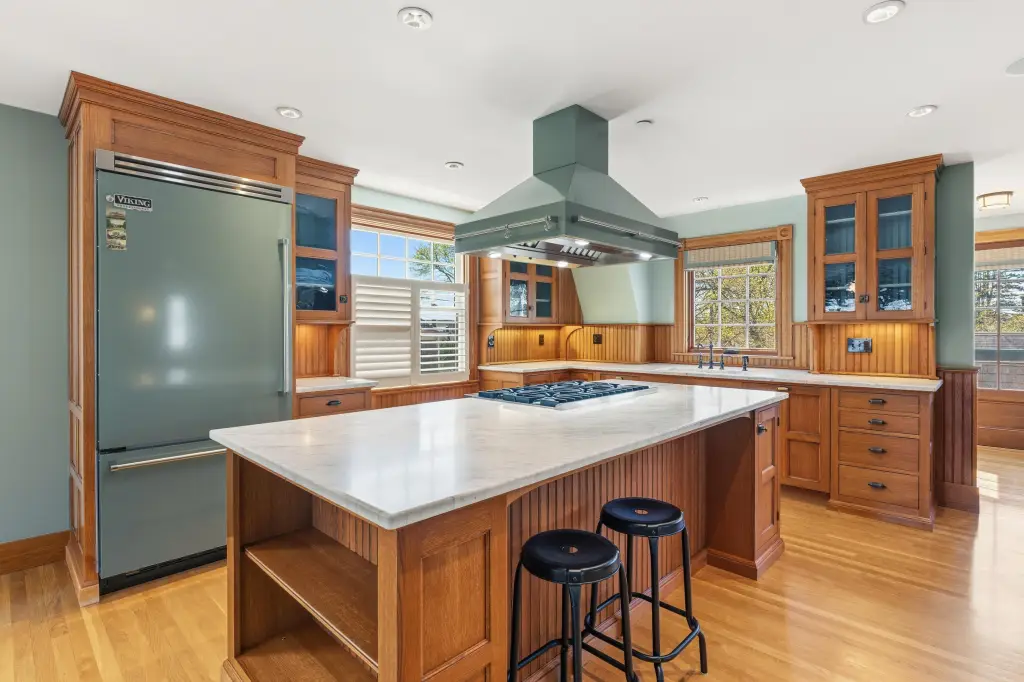
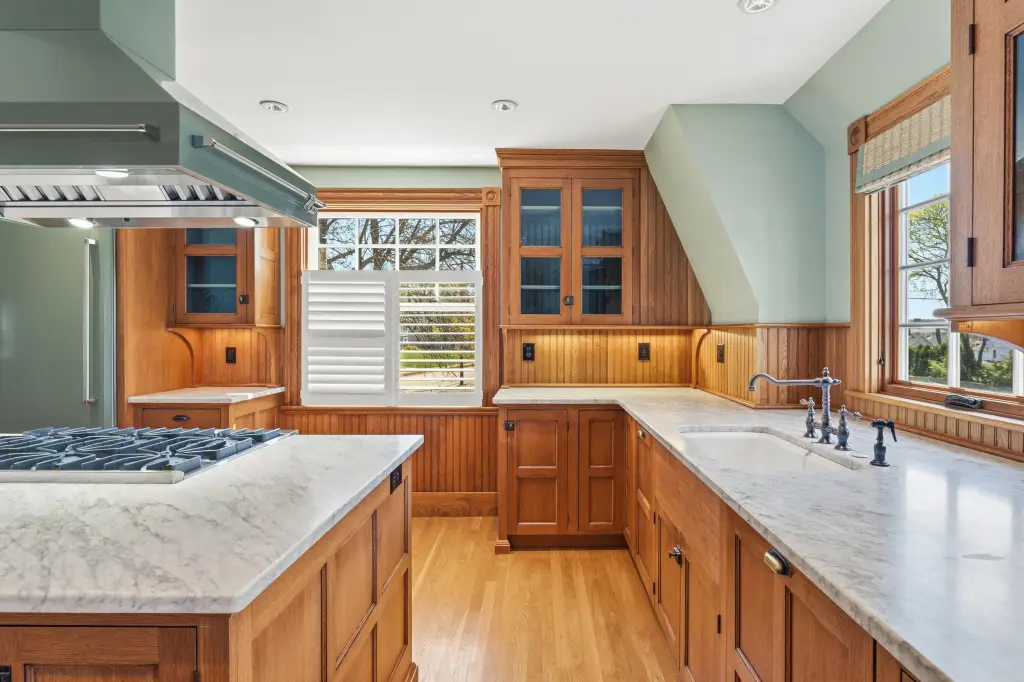
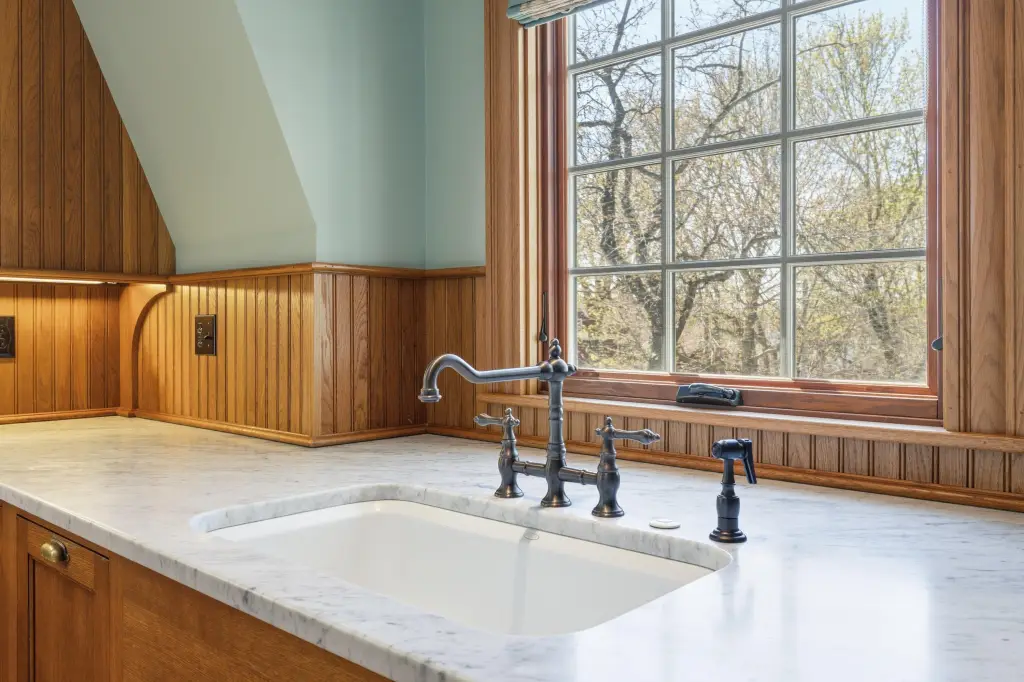
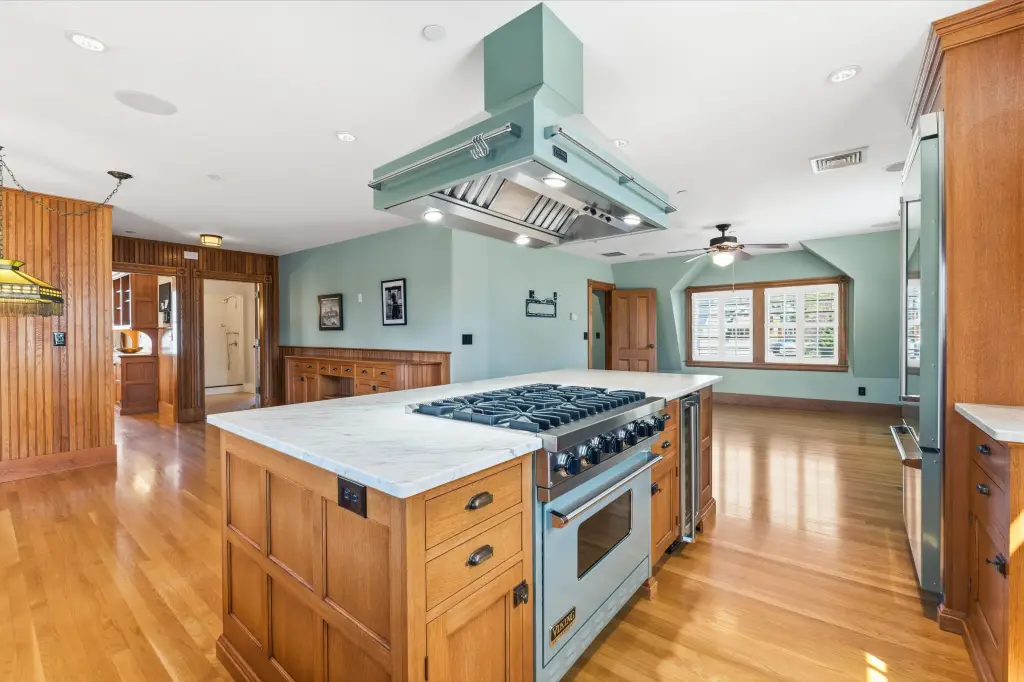
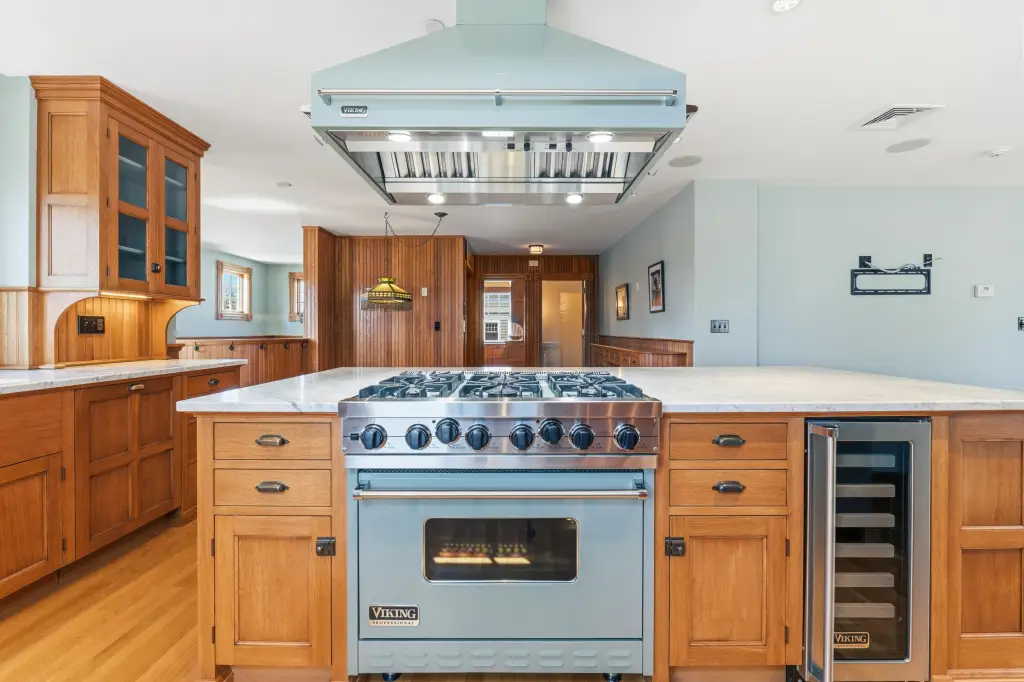
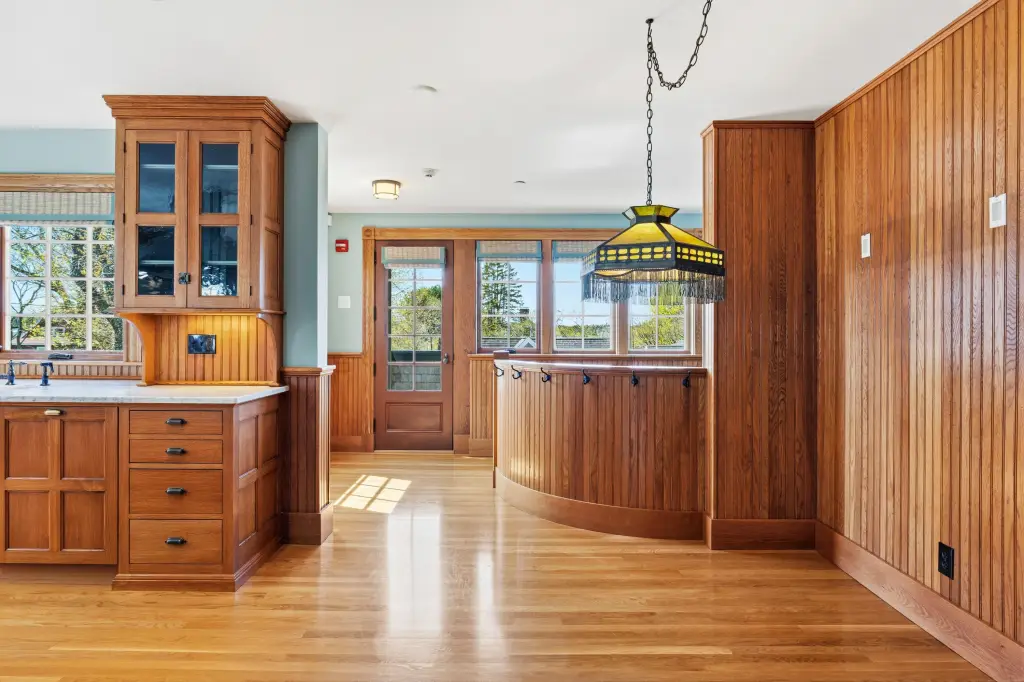
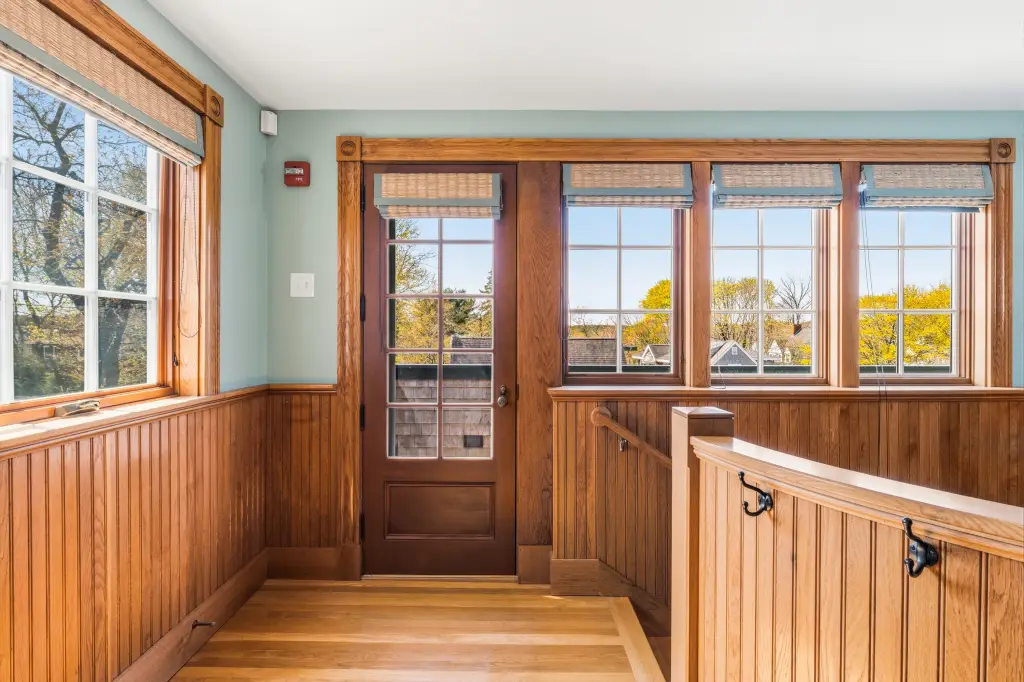
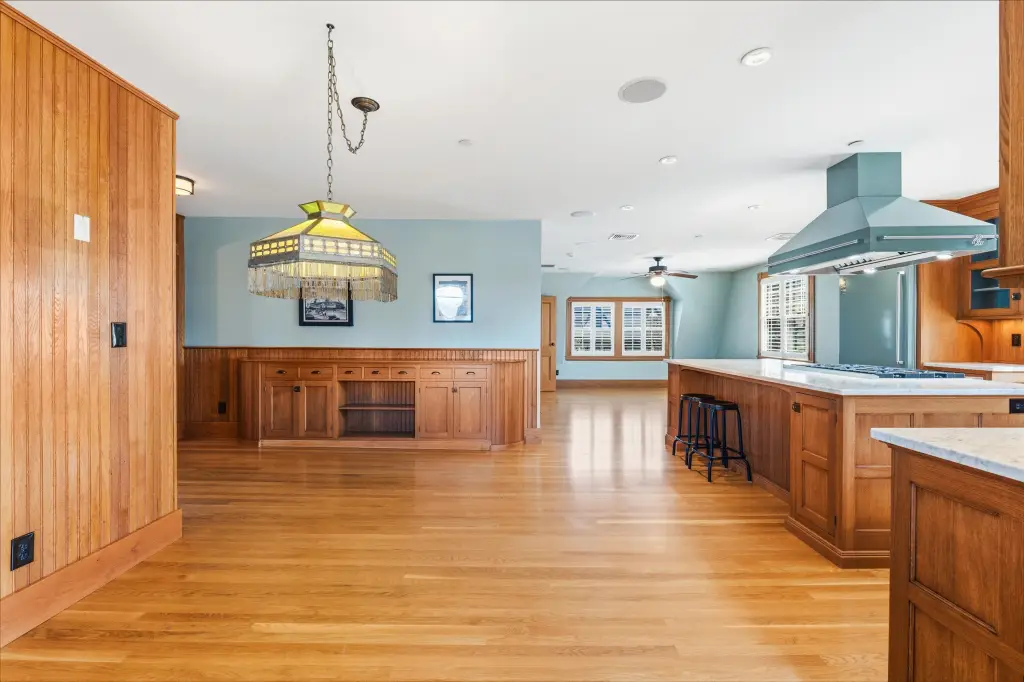
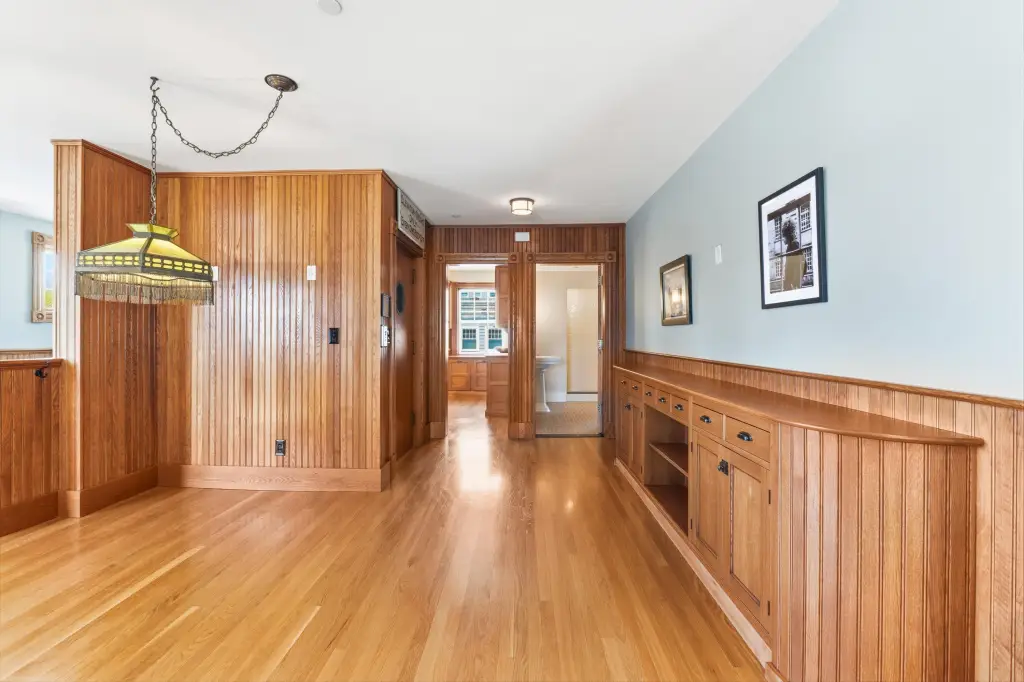
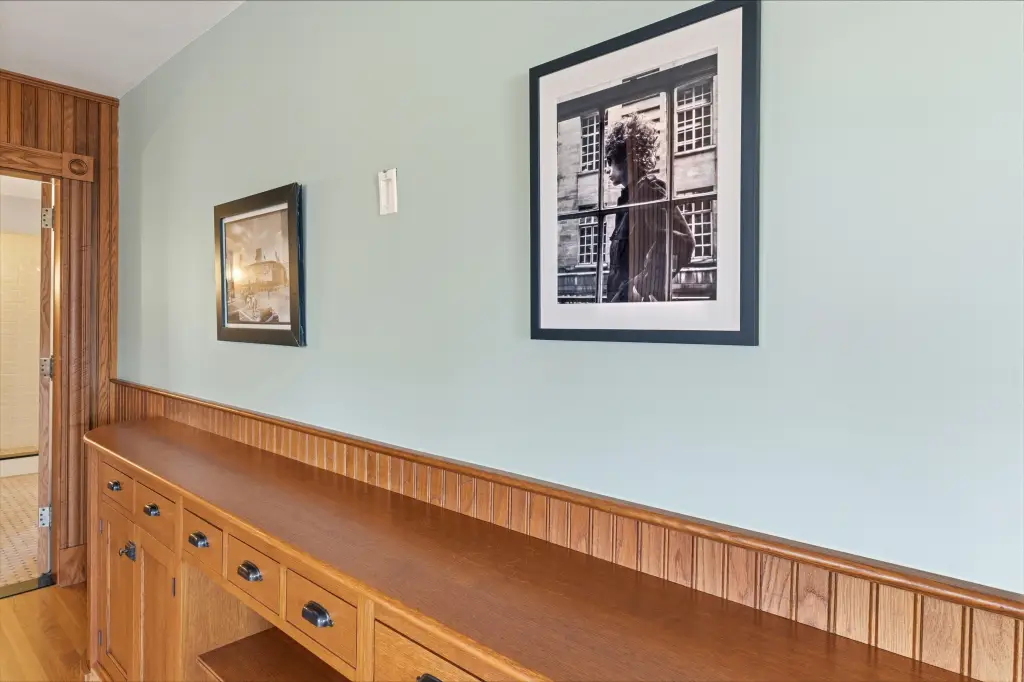
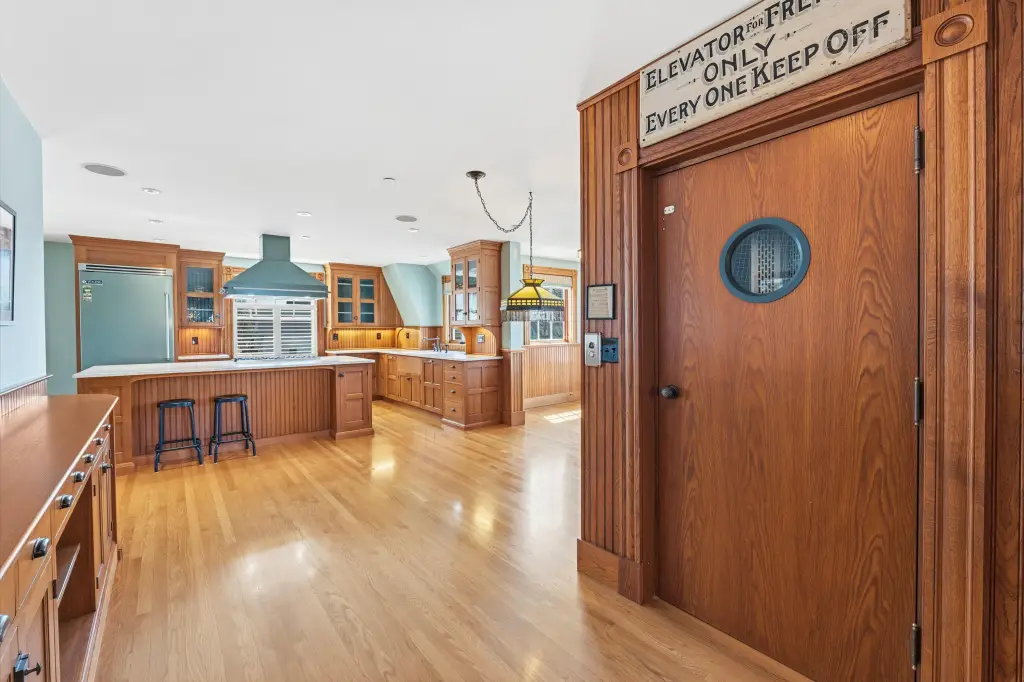
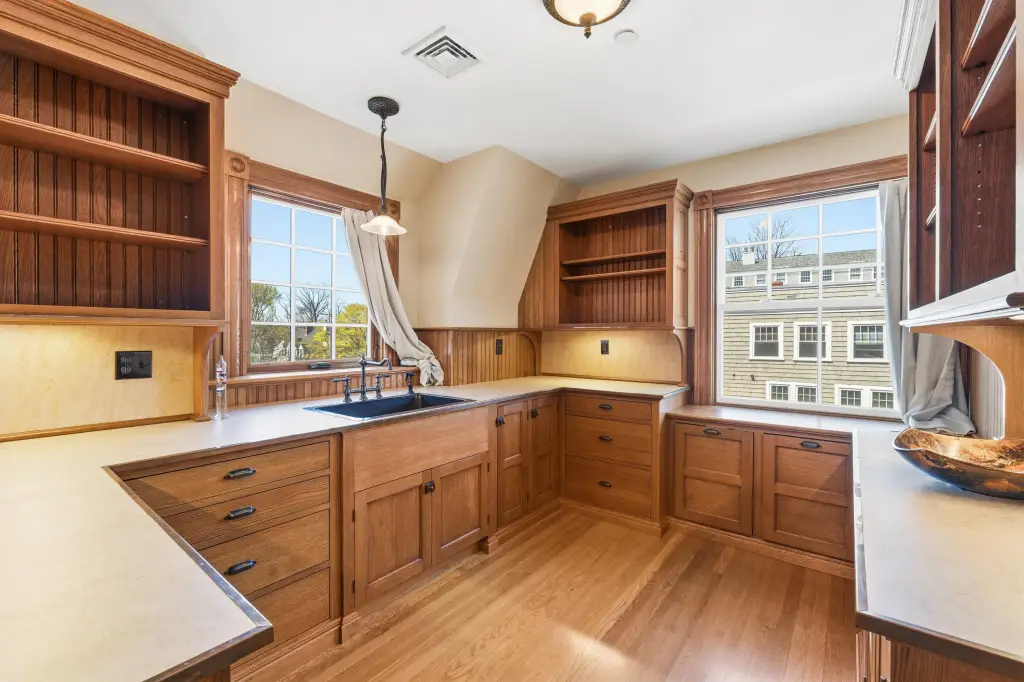
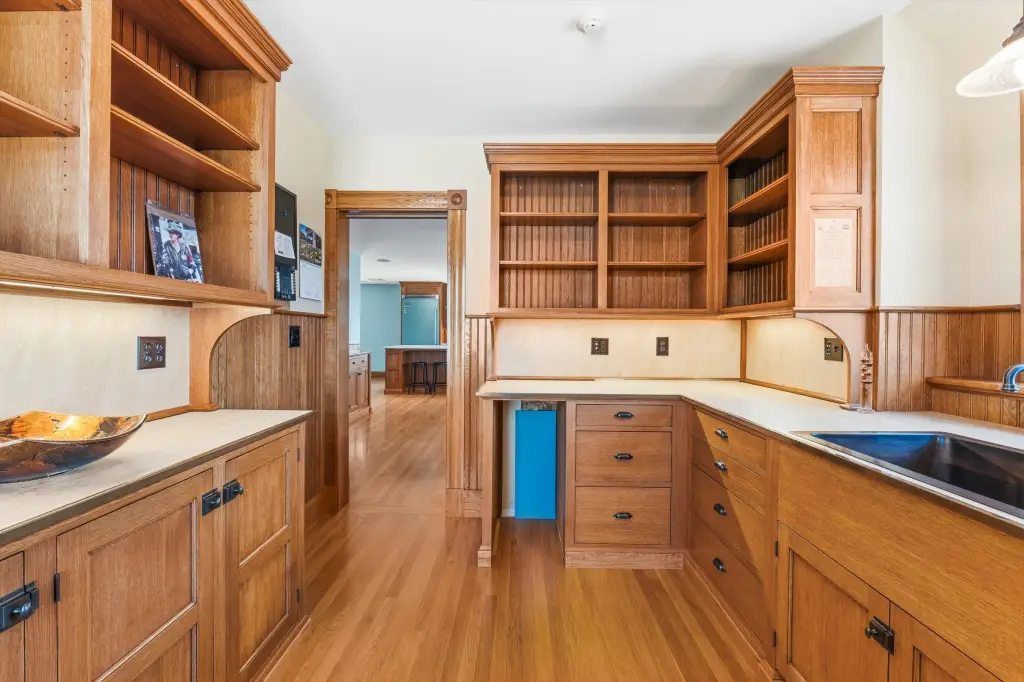
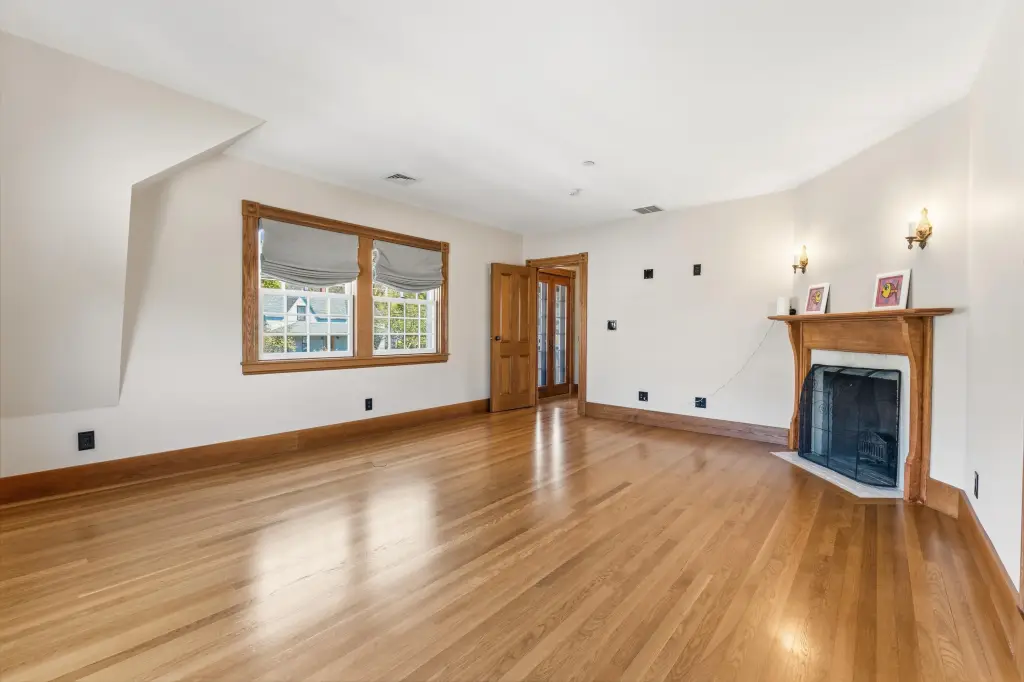
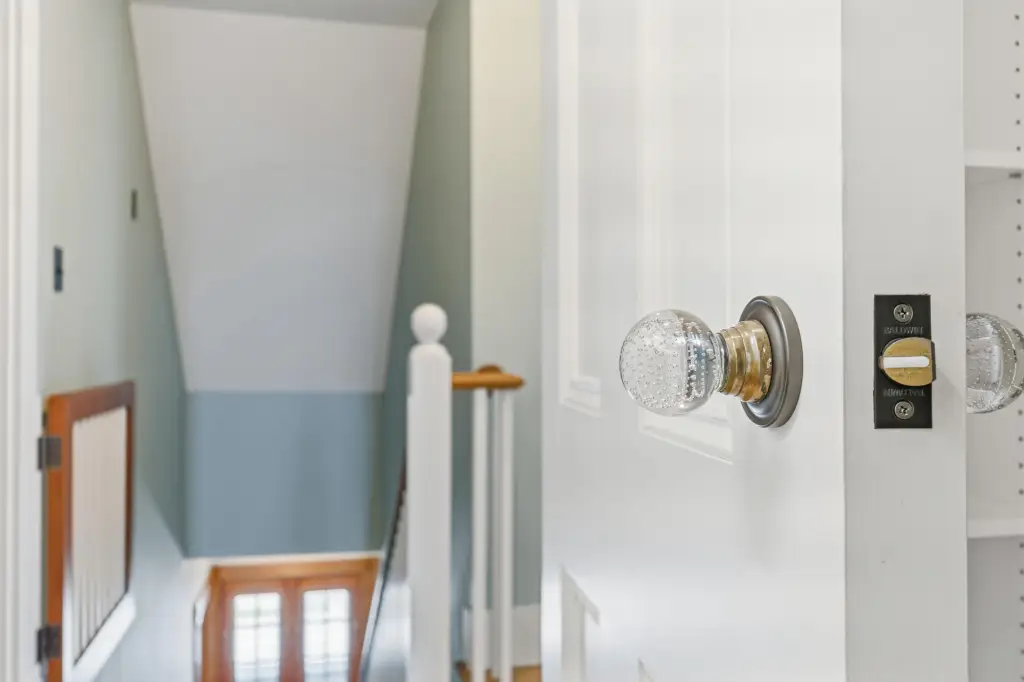
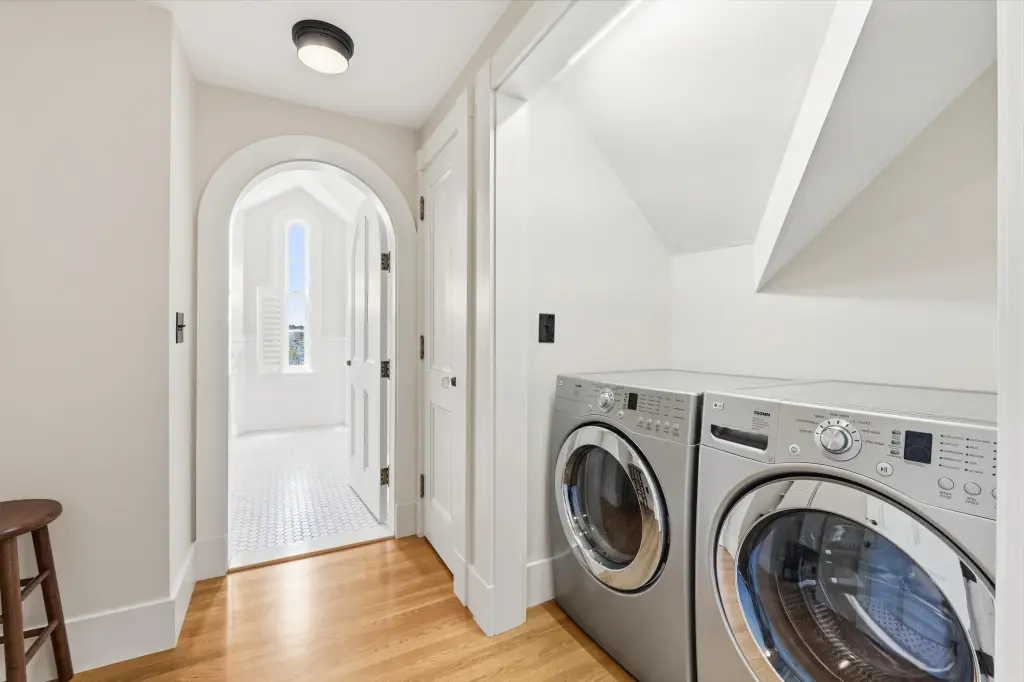
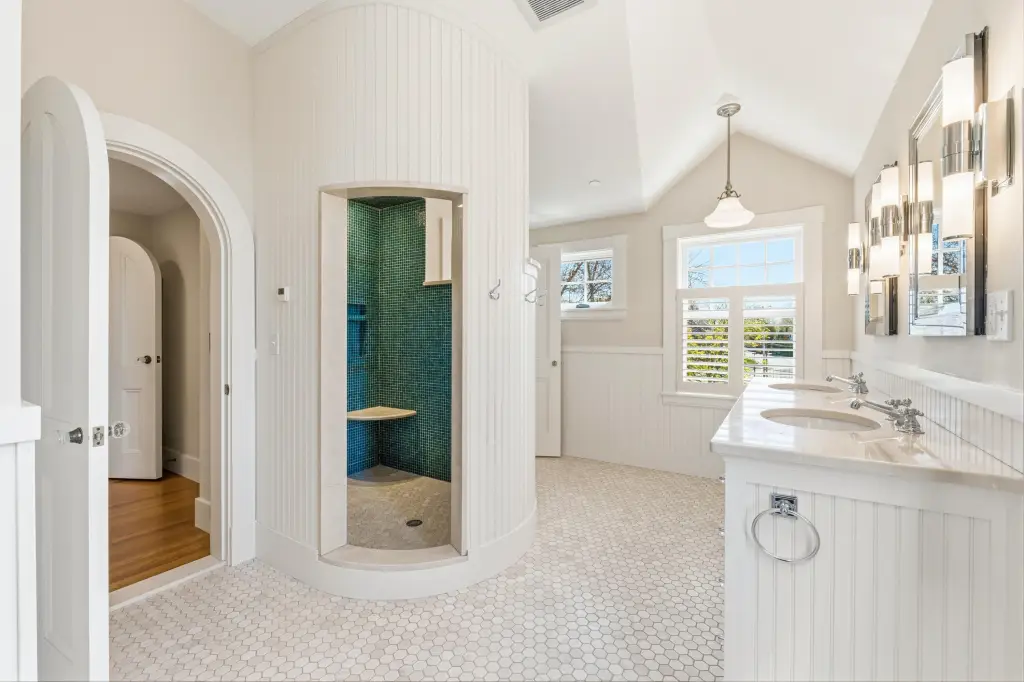
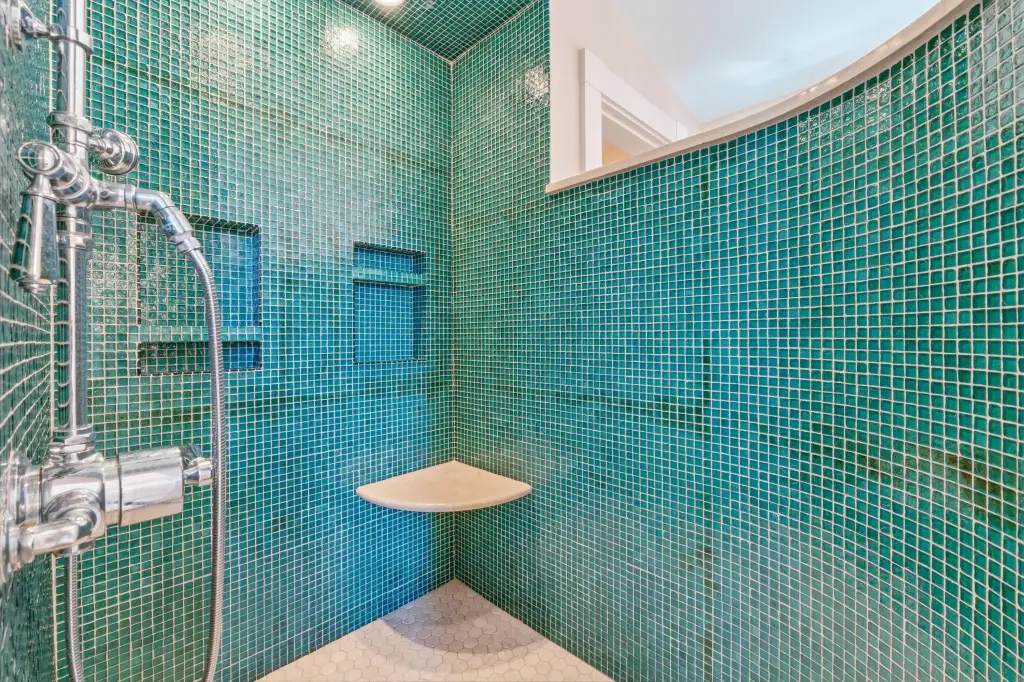
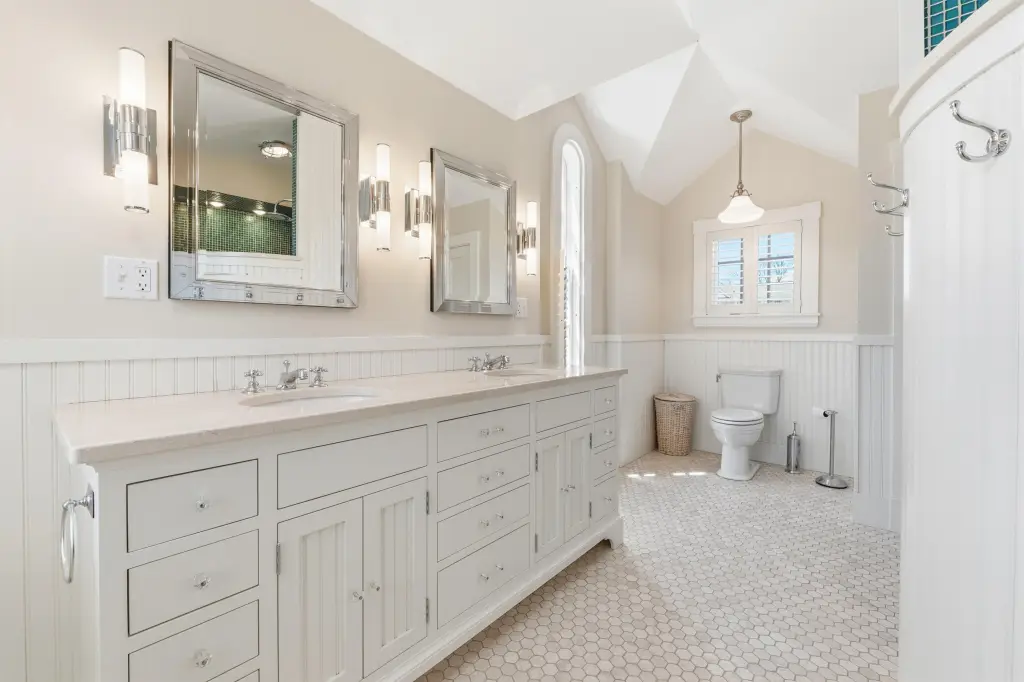
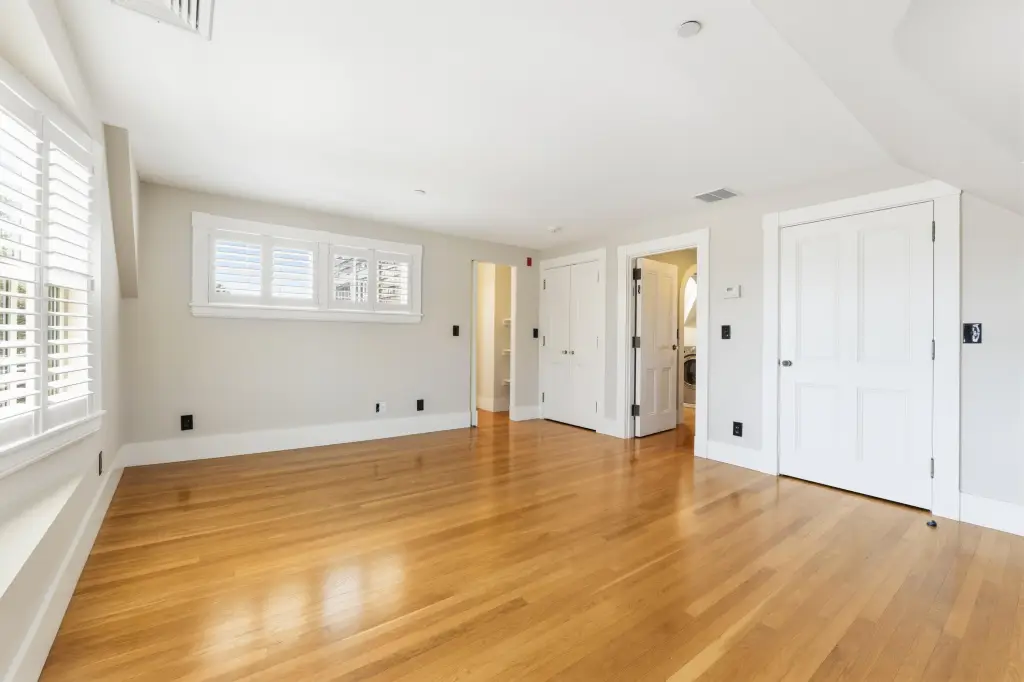
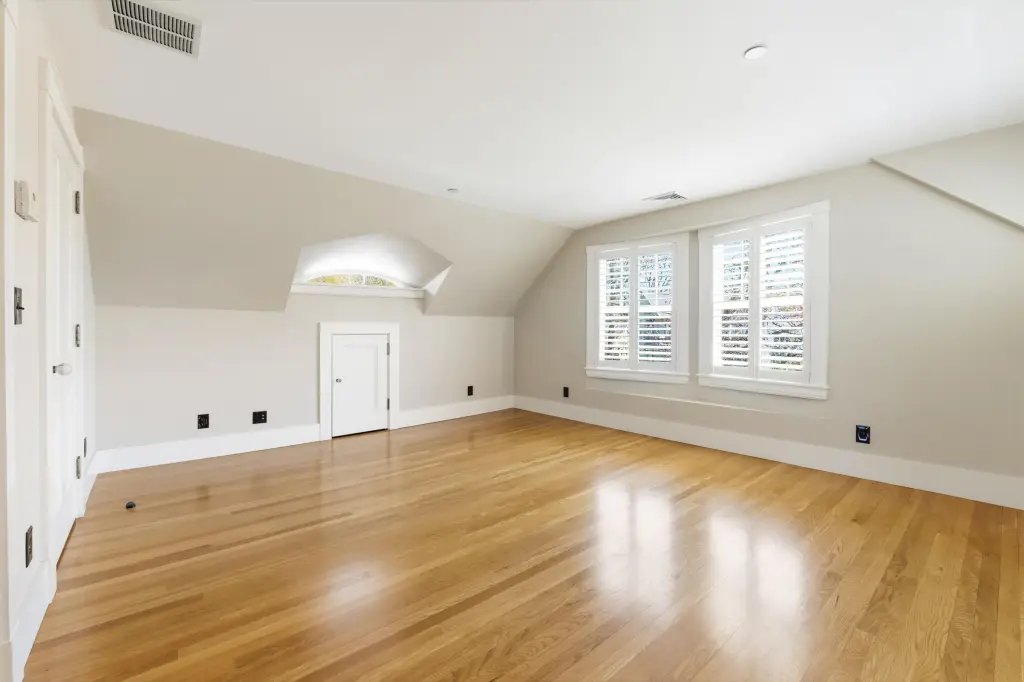
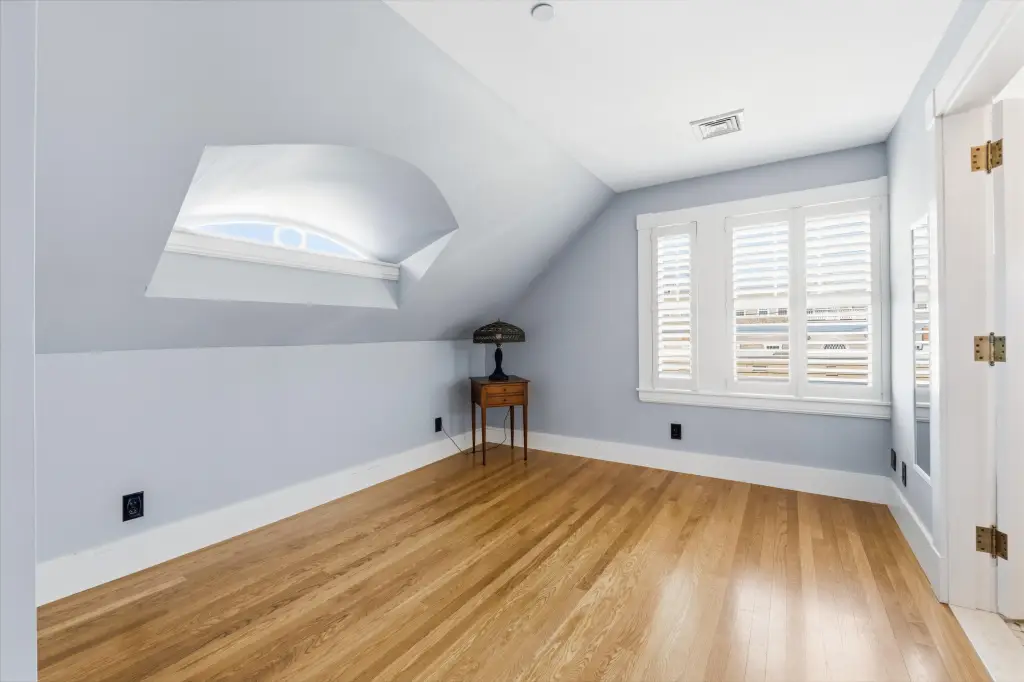
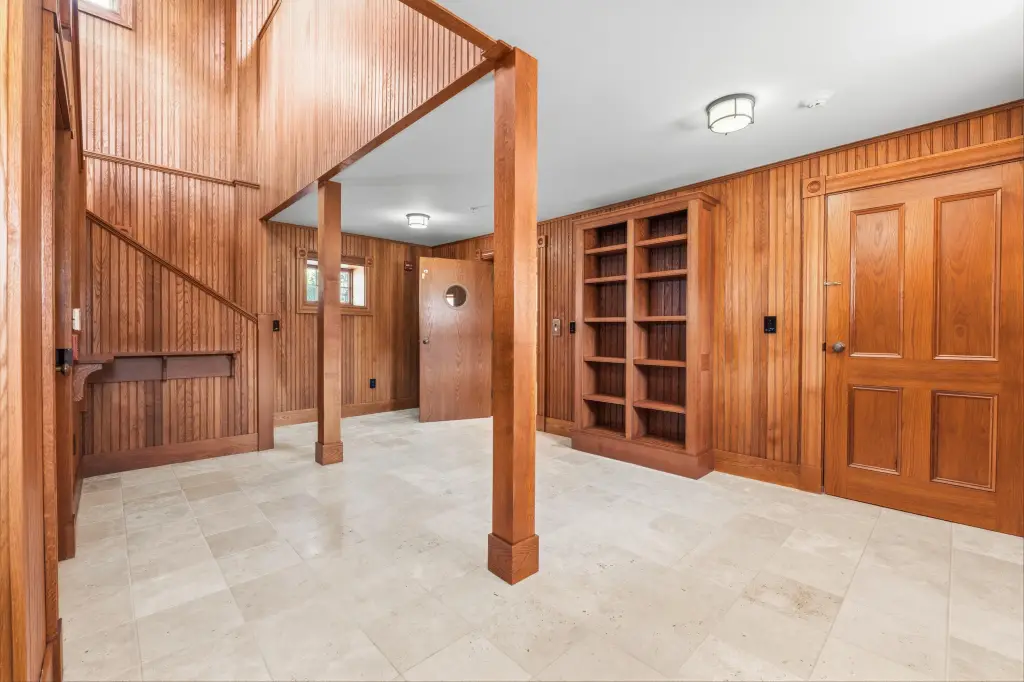
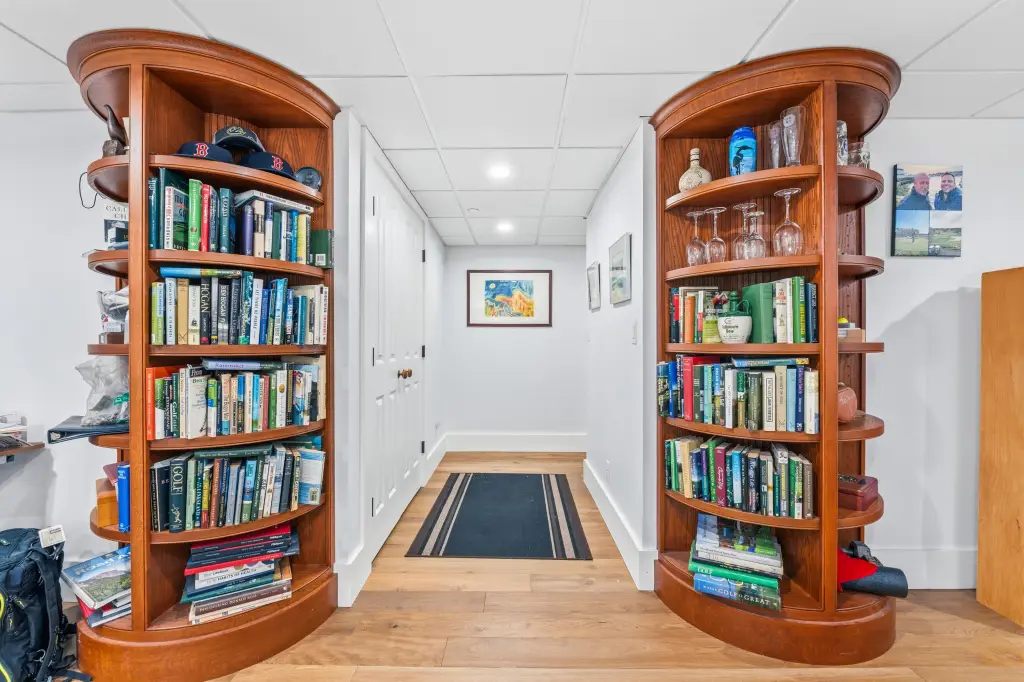
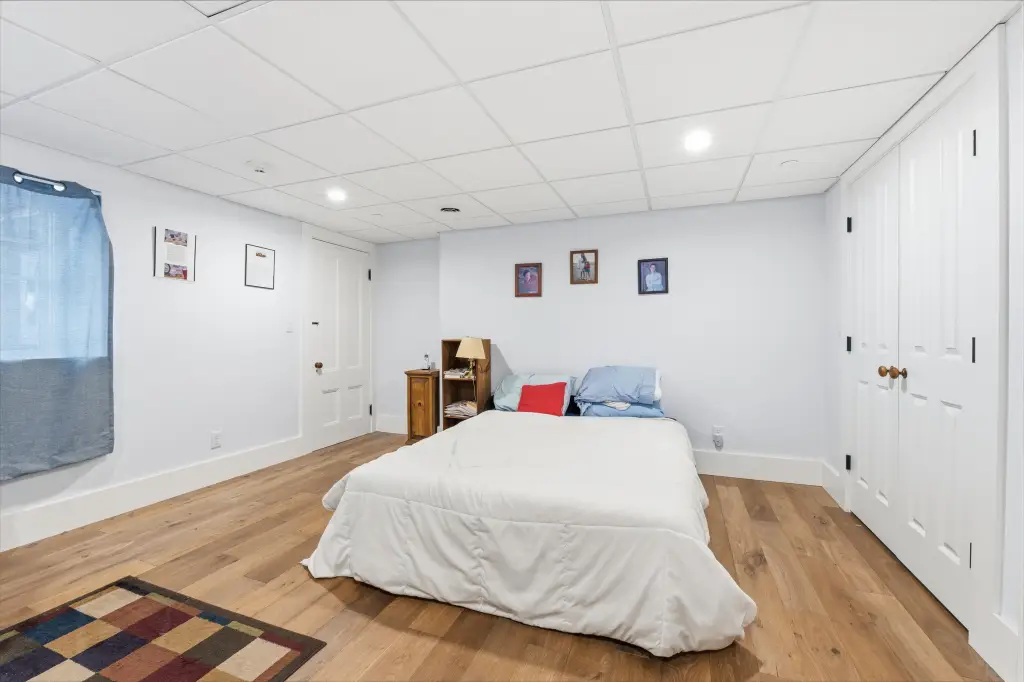
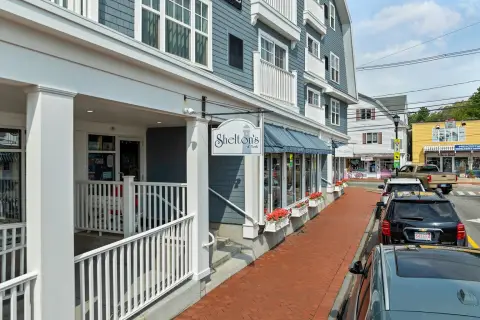
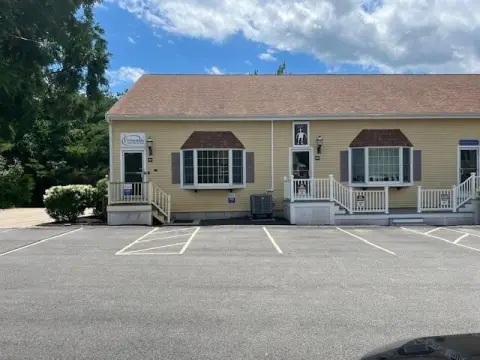
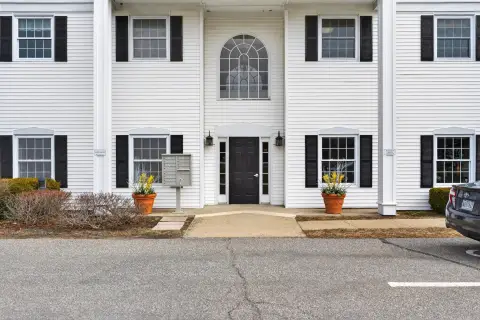
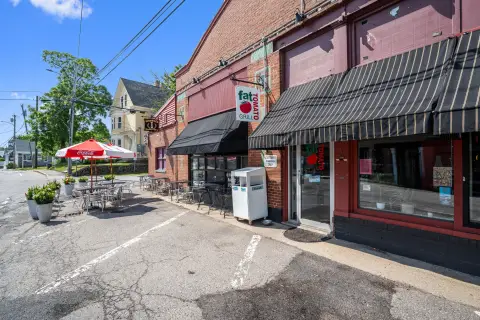
This 5501-square-foot mixed-use building dates to 1900 and has undergone a comprehensive renovation. The property includes two York Street-facing commercial spaces leased to a local business, along with an upper-level residence featuring open living and dining areas, a kitchen with center island and Viking appliances, a primary suite, an additional bedroom suite, and laundry. A separate one-bedroom apartment occupies the lower level.
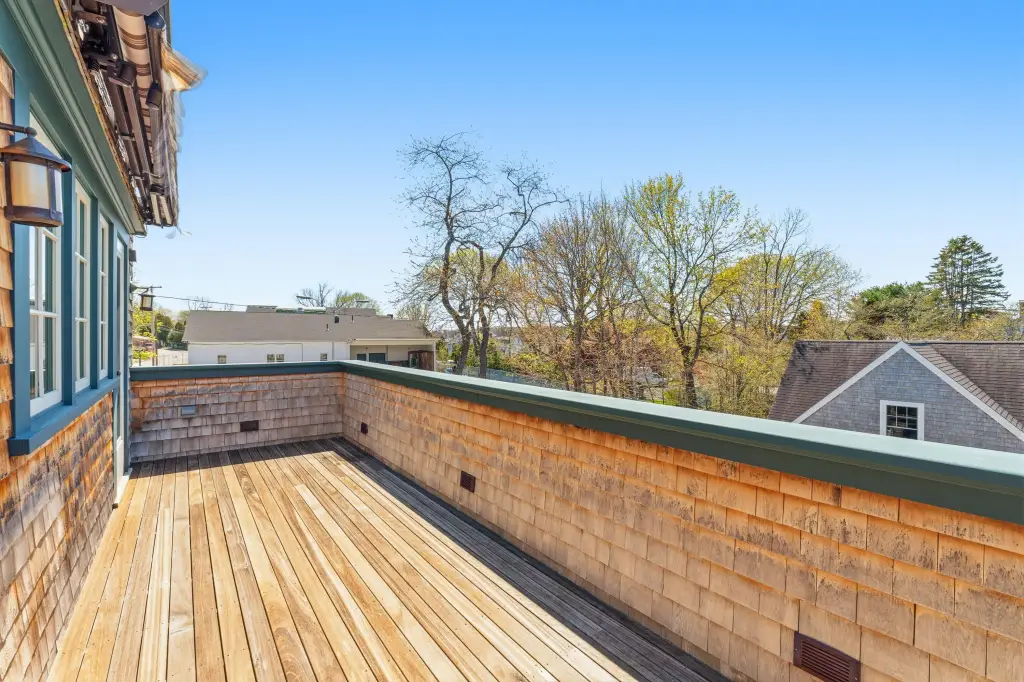
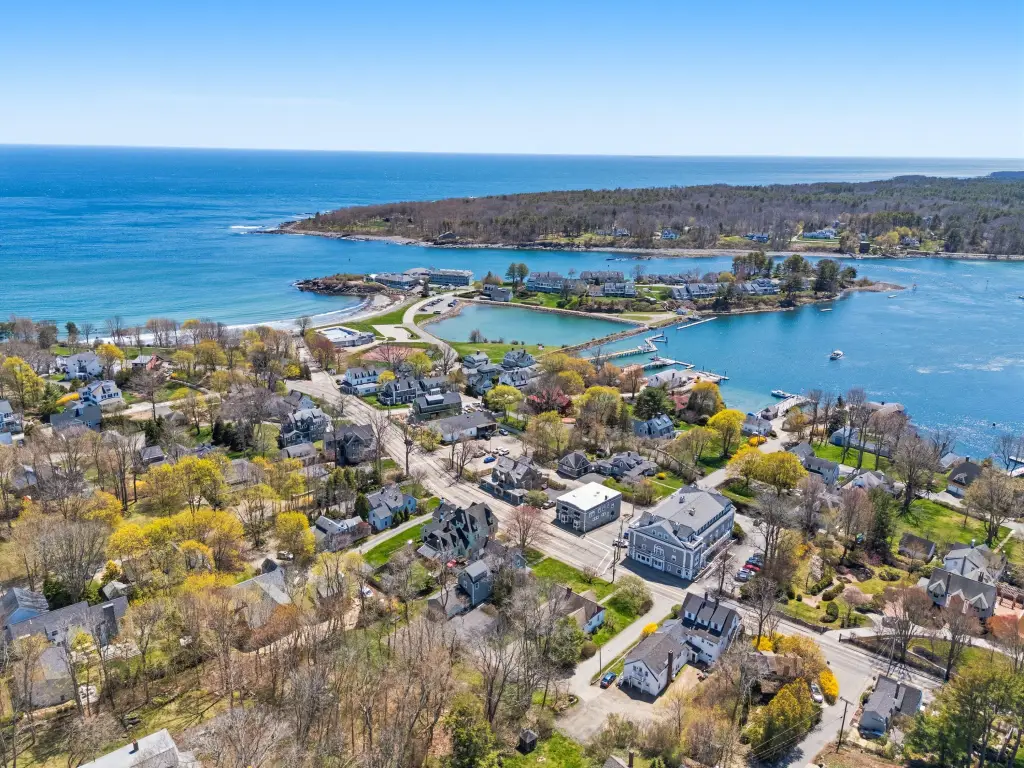
The building has a passenger elevator, semi-finished lower level, wood and tile flooring, central air, forced-air heating, and public water and sewer. Two entrances serve the property: a storefront entry on York Street and a rear-lane access point leading to private off-street parking beneath a porte-cochere. Outdoor features include pocket gardens, a porch, patio, and deck. The 0.17-acre property is zoned BUS-1 and located near York Harbor Beach, Fisherman's Walk, the Cliff Walk, and York Harbor Inn.
The building has a passenger elevator, semi-finished lower level, wood and tile flooring, central air, forced-air heating, and public water and sewer. Two entrances serve the property: a storefront entry on York Street and a rear-lane access point leading to private off-street parking beneath a porte-cochere. Outdoor features include pocket gardens, a porch, patio, and deck. The 0.17-acre property is zoned BUS-1 and located near York Harbor Beach, Fisherman's Walk, the Cliff Walk, and York Harbor Inn.
Key Highlights
- 5501 SF mixed‑use building on a 0.17‑acre lot
- Two York Street‑facing commercial spaces leased to a local business
- Upper‑level residence plus separate one‑bedroom lower‑level apartment
Financial Insights
Estimated NOI and Cap Rate
NOI / Yr
$85,014
Cap Rate
2.84%
Suggested Prices Based on Cap Rates
Cap Rate 5%
$1,700,280
$1.7M
Cap Rate 7%
$1,214,486
$1.2M
Cap Rate 9%
$944,600
$944.6K
Market Conditions
NOI Build-Up for 5,501 SF
Gross rent
$163.0K $29.64/SF
− Vacancy
−$8.5K −$1.54/SF
EGI
$154.6K $28.10/SF
− OpEx
−$69.6K −$12.64/SF
NOI
$85.0K $15.45/SF
Area
York County, ME
Vacancy
5.20%
Lease Rate
$29.64 /SF/Yr
Expense Ratio
45.00%
Simulate Cap Rate and NOI
Suggested Prices Based on Cap Rates
Cap Rate 5%
$1,700,280
Cap Rate 7%
$1,214,486
Cap Rate 9%
$944,600
Alternative Uses
Best Use
Apartment 5plus
$1.21M
$1.06M – $1.42M
NOI $85,014 @ 7.0% cap · market cap 2.84%
Second Best
Mixed Use
$976.0K
$854.0K – $1.14M
NOI $68,322 @ 7.0% cap · market cap 2.29%
Theoretical Best
Office A
$1.74M
$1.53M – $2.03M
NOI $122,065 @ 7.0% cap · market cap 4.08%
Zoning and permitted uses should be independently verified with authorities.
Property Analytics
Unlock full access to Insights
Subscribe to Realmo Intelligence
Open Analytics
Current Use
Lease Details
2
Residential units
Yes
Paved road access
Location Intelligence
Trade Area within ½ mile
181
Businesses Nearby
Explore this area
Business Placement
Demographics for 03909, ME
10,938
Population
7,101
Households
1.5
Avg Household Size
53
Median Age
50%
College-Educated
98%
High-School Grad
35.2 sq mi
ZIP Area
311
Density / Sq Mi
$108,889
Median Household Income
$55,540
Median Earnings
$1,438
Median Rent
$589,400
Median Home Value
Check the figures for this property
Cap Rate, Value Estimation, Potential NOI and more
View Realmo Analytics
Market
Vacancy Rate% for Multifamily in Northeast region

Questions? Ask Rey
Realmo’s AI knows this listing — price, zoning, demand, history. Ask anything.


Frequently Asked Questions
What type of property is this?
Mixed-use property - Renovated mixed-use property combines residential space with two leased storefronts and off-street parking.
Where is this mixed-use property located?
The property is located at 439 York Street York, ME.
What is the asking price?
The asking price for this property is $2,990,000.
What are key features of this property?
This property features: 5501 SF mixed‑use building on a 0.17‑acre lot; Two York Street‑facing commercial spaces leased to a local business; Upper‑level residence plus separate one‑bedroom lower‑level apartment


