Palm Springs Mixed-Use
For Sale
$11,700,000
431 441 & 477 S Palm Canyon Drive, Palm Springs, CA 92262
Prime South Palm Canyon Drive properties with redevelopment potential.
Property Size30,888 SF
Lot Size1.69 Acres
Price / SF$378.79
Days on Market225
Property Features for 431 441 & 477 S Palm Canyon Drive
General Information
Standard status
Active
Size
30,888 SF
Class
B
Lot size
1.69 Acres
Property subtype
Office
Building Details
Building Size
30,888 SF
Year Built
1976
Listing Agency:
Coldwell Banker Commercial Lyle & Associates
Listed By:
Michael Lyle · License #CalDRE #02002995
(760) 774-6533
Source:
Cbclyle
Added: Mar 5
Changed: Oct 15
Last Checked: Oct 16 at 6:13AM
Displayed information is deemed reliable but is not guaranteed and should be independently verified. All listing content including descriptions, pricing, images are the copyrighted material of Coldwell Banker Commercial Lyle & Associates

Ask AI about this property
Review the available facts, identify missing information and prepare questions for the agent.
Investment Insights
Based on property information with market context.
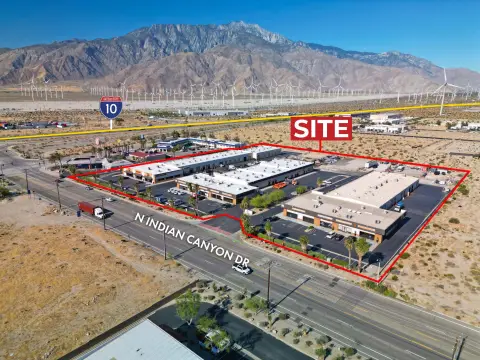
This assemblage of office and retail properties fronts South Palm Canyon Drive in the old financial block of downtown Palm Springs. The block has experienced major investment and change over the past several years, including the redevelopment of the historic JW Robinson Department store building into a multi-tenant property with restaurants, bars, entertainment, BevMo, and Orange Theory. The block is just South of and contiguous to the high foot traffic bar hopping zone, offering dynamic redevelopment opportunities. Adjacent to this assemblage is the new Eisenhower Health Center, which overhauled the 14,152 square foot property in 2013. The area, formerly the banking/financial district of Palm Springs, has been reborn into a mixed-use area with retail including mid-century home furnishings, office, medical, financial services, restaurants, bars, and venue space. The three buildings total 30,888 square feet and have excellent frontage on South Palm Canyon Drive. This is a rare opportunity to acquire an assemblage of contiguous buildings on Palm Canyon Drive. Multiple value-add opportunities exist, including adding storefronts on Palm Canyon Drive to replace former bank drive-through lanes, standardizing leasing forms, synergizing with neighboring Eisenhower Health, constructing a new restaurant storefront with a second-story patio, redeveloping the 441 building parcel, exploring new leasing strategies, and redeveloping the entire 74,051 square foot assemblage of parcels. Condominiums above restaurant/bar/retail are in high demand. An owner/user opportunity exists for 5,000 square feet or larger with prime signage and ground floor frontage.
Key Highlights
- Prime location on South Palm Canyon Drive in a revitalized downtown Palm Springs block.
- Assemblage of three contiguous buildings totaling 30,888 sf, a rare opportunity.
- Multiple value‑add opportunities, including storefront additions, restaurant construction with patio, and redevelopment of parcels.
Financial Insights
Estimated NOI and Cap Rate
NOI / Yr
$485,302
Cap Rate
4.15%
Suggested Prices Based on Cap Rates
Cap Rate 5%
$9,706,040
$9.7M
Cap Rate 7%
$6,932,886
$6.9M
Cap Rate 9%
$5,392,244
$5.4M
Market Conditions
NOI Build-Up for 30,888 SF
Gross rent
$708.0K $22.92/SF
− Vacancy
−$60.9K −$1.97/SF
EGI
$647.1K $20.95/SF
− OpEx
−$161.8K −$5.24/SF
NOI
$485.3K $15.71/SF
Area
Riverside County, CA
Vacancy
8.60%
Lease Rate
$22.92 /SF/Yr
Expense Ratio
25.00%
Simulate Cap Rate and NOI
Suggested Prices Based on Cap Rates
Cap Rate 5%
$9,706,040
Cap Rate 7%
$6,932,886
Cap Rate 9%
$5,392,244
Alternative Uses
Best Use
Office B
$6.93M
$6.07M – $8.09M
NOI $485,302 @ 7.0% cap · market cap 4.15%
Second Best
Retail
$6.32M
$5.53M – $7.38M
NOI $442,741 @ 7.0% cap · market cap 3.78%
Theoretical Best
Office A
$9.25M
$8.10M – $10.80M
NOI $647,747 @ 7.0% cap · market cap 5.54%
Zoning and permitted uses should be independently verified with authorities.
How Realmo checks its estimates
Property Analytics
Unlock full access to Insights
Subscribe to Realmo Intelligence
Open Analytics
Current Use
Location Intelligence
Trade Area within ½ mile
1,842
Businesses Nearby
Explore this area
Business Placement
Demographics for 92262, CA
26,593
Population
19,940
Households
1.3
Avg Household Size
54
Median Age
42%
College-Educated
93%
High-School Grad
35.1 sq mi
ZIP Area
758
Density / Sq Mi
$70,514
Median Household Income
$42,940
Median Earnings
$1,420
Median Rent
$600,600
Median Home Value
Check the figures for this property
Cap Rate, Value Estimation, Potential NOI and more
View Realmo Analytics
Market
Vacancy Rate% for Office in West region




Frequently Asked Questions
What type of property is this?
Office building - Prime South Palm Canyon Drive properties with redevelopment potential.
Where is this office building located?
The property is located at 431 441 & 477 S Palm Canyon Drive Palm Springs, CA.
What is the asking price?
The asking price for this property is $11,700,000.
What are key features of this property?
This property features: Prime location on South Palm Canyon Drive in a revitalized downtown Palm Springs block.; Assemblage of three contiguous buildings totaling 30,888 sf, a rare opportunity.; Multiple value‑add opportunities, including storefront additions, restaurant construction with patio, and redevelopment of parcels.