Remodeled Commercial Property on Corner
For Sale
$574,900
429 N ROYAL AVENUE, Front Royal, VA 22630
Versatile 3,300+ sq ft property with modern updates and expansion potential.
Property Size3,380 SF
Price / SF$170.09
Days on Market191
Property Features for 429 N ROYAL AVENUE
General Information
Standard status
Active
Size
3,380 SF
Property subtype
MixedUse
Taxes and HOA fees
Annual Taxes
$2,359
Building Details
Building Size
3,380 SF
Year Built
1926
Listing Agency:
Preslee Real Estate
Listed By:
Brian Doman · License #0225217540
(540) 333-1093
Source:
Kerishull
Added: Apr 8
Changed: Oct 10
Last Checked: Oct 13 at 1:23AM
Displayed information is deemed reliable but is not guaranteed and should be independently verified. All listing content including descriptions, pricing, images are the copyrighted material of Preslee Real Estate
Investment Insights
Based on property information with market context.
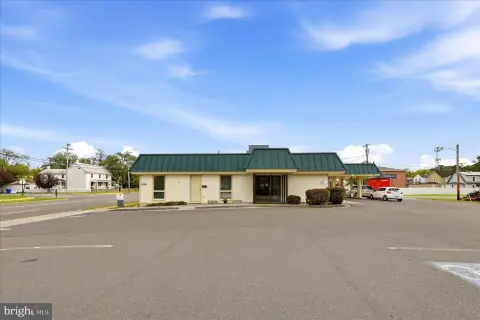
This remodeled commercial property is located on a desirable corner lot in Warren County. The stone bungalow, originally built in 1926, offers over 3,300 square feet of versatile space plus a partially finished basement. The property has high visibility and easy access to major high-traffic routes, including the I-66/I-81 corridor and Routes 340 and 522. The main level features a lobby/entrance, a conference room or private office, and refinished hardwood floors. A painted stone, wood-burning fireplace with mantel adds character, along with a sunroom. There is also a designated area suitable for a kitchen or breakroom, built-ins, and a stairwell leading to the upper level. The upper level includes four spacious offices or conference rooms, each with closets, a sitting area, and additional refinished hardwood flooring. A full bathroom with a stand-up shower and luxury vinyl plank flooring completes the upper level. Each level is equipped with its own HVAC system. The conditioned basement includes a bonus room, two storage rooms with luxury vinyl plank flooring, and an unfinished utility room with painted concrete flooring. Exterior features include a covered side porch, rear covered porch, and a front porch with columns, all with stair access. Additional highlights include a metal roof, rear fencing, and a 17’ x 21’ stone storage building with electricity. An additional vacant lot located at the rear of the property offers potential for parking, expansion, or future development. The property is somewhat walkable with a walk score of 54 and somewhat bikeable with a bike score of 32. The flexible layout allows for a variety of business uses.
Key Highlights
- High‑visibility corner lot location in Warren County with easy access to major highways.
- Versatile 3,300+ sq ft of remodeled commercial space with flexible layout.
- Additional vacant lot included, offering potential for parking, expansion, or future development.
Financial Insights
Estimated NOI and Cap Rate
NOI / Yr
$45,256
Cap Rate
7.87%
Suggested Prices Based on Cap Rates
Cap Rate 5%
$905,120
$905.1K
Cap Rate 7%
$646,514
$646.5K
Cap Rate 9%
$502,844
$502.8K
Market Conditions
NOI Build-Up for 3,380 SF
Gross rent
$70.6K $20.88/SF
− Vacancy
−$10.2K −$3.03/SF
EGI
$60.3K $17.85/SF
− OpEx
−$15.1K −$4.46/SF
NOI
$45.3K $13.39/SF
Area
Warren County, VA
Vacancy
14.50%
Lease Rate
$20.88 /SF/Yr
Expense Ratio
25.00%
Simulate Cap Rate and NOI
Suggested Prices Based on Cap Rates
Cap Rate 5%
$905,120
Cap Rate 7%
$646,514
Cap Rate 9%
$502,844
Alternative Uses
Best Use
Office B
$646.5K
$565.7K – $754.3K
NOI $45,256 @ 7.0% cap · market cap 7.87%
Second Best
—
—
no second resolved use
Theoretical Best
Specialty Retail
$1.88M
$1.64M – $2.19M
NOI $131,414 @ 7.0% cap · market cap 22.86%
Zoning and permitted uses should be independently verified with authorities.
How Realmo checks its estimates
Property Analytics
Unlock full access to Insights
Subscribe to Realmo Intelligence
Open Analytics
Current Use
Location Intelligence
Trade Area within ½ mile
1,139
Businesses Nearby
Explore this area
Business Placement
Demographics for 22630, VA
33,829
Population
14,465
Households
2.3
Avg Household Size
42
Median Age
26%
College-Educated
89%
High-School Grad
121.9 sq mi
ZIP Area
278
Density / Sq Mi
$84,513
Median Household Income
$44,771
Median Earnings
$1,183
Median Rent
$329,500
Median Home Value
Check the figures for this property
Cap Rate, Value Estimation, Potential NOI and more
View Realmo Analytics
Market
Vacancy Rate% for Office in South region

Questions? Ask Rey
Realmo’s AI knows this listing — price, zoning, demand, history. Ask anything.





Frequently Asked Questions
What type of property is this?
Office building - Versatile 3,300+ sq ft property with modern updates and expansion potential.
Where is this office building located?
The property is located at 429 N ROYAL AVENUE Front Royal, VA.
What is the asking price?
The asking price for this property is $574,900.
What are key features of this property?
This property features: High‑visibility corner lot location in Warren County with easy access to major highways.; Versatile 3,300+ sq ft of remodeled commercial space with flexible layout.; Additional vacant lot included, offering potential for parking, expansion, or future development.


