Three-Unit Condo Income
For Sale
Contact for pricing
42-46 E Thompson Boulevard, Ventura, CA 93001
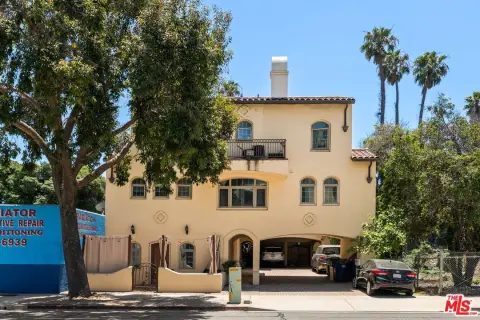
Three 2006-built condos with private garages, patios, and in-unit laundry, each on a separate APN.
Property Size4,210 SF
Lot Size0.05 Acres
Price / SF$457.24
Days on Market120
Property Features for 42-46 E Thompson Boulevard
General Information
Standard status
Active
Size
4,210 SF
Class
B
Lot size
0.05 Acres
Property subtype
Multifamily
Zoning
T4.3
Occupancy
100%
Investment Type
Value Add
Net Operating Income
$65,070
Additional Details
Highway Access
Yes
Multifamily Units
3
Building Details
Year Built
2006
Buildings
1
Units
3
Tenancy
Multi
Listing Agency:
Compass
Listed By:
John Swartz · License #CA 01873487
(310) 230-5478
Source:
Crexi
Added: Jun 17
Changed: Oct 7
Last Checked: Oct 12 at 8:15PM
Displayed information is deemed reliable but is not guaranteed and should be independently verified. All listing content including descriptions, pricing, images are the copyrighted material of Compass
Investment Insights
Based on property information with market context.
Built in 2006, this three-unit condominium asset offers condo-quality residences with independent ownership structure. Two units are 2-bedroom, 2-bath homes, and one unit is a 3-bedroom, 2-bath home. Each residence includes a private garage and dedicated private patio, with in-unit washer/dryers, dishwashers, stoves, and additional appliances.
The property is offered for sale at 42-46 E Thompson Boulevard in Ventura. The units are positioned along the 101 Freeway corridor, placing residents within convenient reach of major employment hubs described in the offering, including commercial centers of Oxnard and Camarillo to the south, the tech and biotech corridor anchored by Thousand Oaks, and the Greater Los Angeles market.
From an ownership and tenant management perspective, the three condominiums are held under separate APNs, providing flexibility for holding all units together or disposing of individual units over time. The offering also states the property is not subject to any form of local rent control. Tenants are responsible for electricity and gas, while ownership covers water, trash, and gardening, supporting a straightforward monthly expense structure for day-to-day operations.
The property is offered for sale at 42-46 E Thompson Boulevard in Ventura. The units are positioned along the 101 Freeway corridor, placing residents within convenient reach of major employment hubs described in the offering, including commercial centers of Oxnard and Camarillo to the south, the tech and biotech corridor anchored by Thousand Oaks, and the Greater Los Angeles market.
From an ownership and tenant management perspective, the three condominiums are held under separate APNs, providing flexibility for holding all units together or disposing of individual units over time. The offering also states the property is not subject to any form of local rent control. Tenants are responsible for electricity and gas, while ownership covers water, trash, and gardening, supporting a straightforward monthly expense structure for day-to-day operations.
Key Highlights
- Three‑unit condo property built in 2006 in Ventura
- Unit mix: two 2 bed/2 bath (1,141 SF and 1,418 SF) plus one 3 bed/2 bath (1,651 SF)
- Each unit has a separate APN for flexible ownership and exit options
Financial Insights
Estimated NOI and Cap Rate
NOI / Yr
$72,150
Cap Rate
3.75%
Suggested Prices Based on Cap Rates
Cap Rate 5%
$1,443,000
$1.4M
Cap Rate 7%
$1,030,714
$1.0M
Cap Rate 9%
$801,667
$801.7K
Market Conditions
NOI Build-Up for 4,210 SF
Gross rent
$107.4K $25.50/SF
− Vacancy
−$4.3K −$1.02/SF
EGI
$103.1K $24.48/SF
− OpEx
−$30.9K −$7.34/SF
NOI
$72.2K $17.14/SF
Area
Ventura County, CA
Vacancy
3.99%
Lease Rate
$25.50 /SF/Yr
Expense Ratio
30.00%
Simulate Cap Rate and NOI
Suggested Prices Based on Cap Rates
Cap Rate 5%
$1,443,000
Cap Rate 7%
$1,030,714
Cap Rate 9%
$801,667
Alternative Uses
Best Use
Multifamily LT 5
$1.03M
$901.9K – $1.20M
NOI $72,150 @ 7.0% cap · market cap 3.75%
Second Best
Apartment 5plus
$950.7K
$831.8K – $1.11M
NOI $66,547 @ 7.0% cap · market cap 3.46%
Theoretical Best
Office A
$1.45M
$1.26M – $1.69M
NOI $101,169 @ 7.0% cap · market cap 5.26%
Zoning and permitted uses should be independently verified with authorities.
How Realmo checks its estimates
Property Analytics
Unlock full access to Insights
Subscribe to Realmo Intelligence
Open Analytics
Current Use
Lease Details
3
Residential units
Yes
Highway access
Location Intelligence
Trade Area within ½ mile
1
Businesses Nearby
Explore this area
Business Placement
Demographics for 93001, CA
33,859
Population
14,705
Households
2.3
Avg Household Size
40
Median Age
38%
College-Educated
88%
High-School Grad
96.6 sq mi
ZIP Area
351
Density / Sq Mi
$86,310
Median Household Income
$45,023
Median Earnings
$1,881
Median Rent
$760,700
Median Home Value
Check the figures for this property
Cap Rate, Value Estimation, Potential NOI and more
View Realmo Analytics
Market
Vacancy Rate% for Multifamily in West region

Questions? Ask Rey
Realmo’s AI knows this listing — price, zoning, demand, history. Ask anything.




Frequently Asked Questions
What type of property is this?
Triplex - Three 2006-built condos with private garages, patios, and in-unit laundry, each on a separate APN.
Where is this triplex located?
The property is located at 42-46 E Thompson Boulevard Ventura, CA.
What is the asking price?
The asking price for this property is $1,925,000.
What are key features of this property?
This property features: Three‑unit condo property built in 2006 in Ventura; Unit mix: two 2 bed/2 bath (1,141 SF and 1,418 SF) plus one 3 bed/2 bath (1,651 SF); Each unit has a separate APN for flexible ownership and exit options


