Six-Unit Ranch Apartment
For Sale
$250,000
4186 Drouillard Street, Lincoln Park, MI 48146
Multifamily, 1 Story, Lincoln Park, MI
Property Size1,200 SF
Lot Size0.10 Acres
Price / SF$208.33
Days on Market93
Property Features for 4186 Drouillard Street
General Information
Property type
Residential Multi Family
Property subtype
Single Family Residence
Zoning
Multi-Family
Bedrooms
3
Bathrooms
3
Full bathrooms
3
Rooms
Bedroom 1, Bathroom 3, Bathroom 1, Bedroom 2, Bathroom 2, Bedroom 3
Pets allowed
Call
Subdivision
Lincoln Park Highlands Sub
Elementary school district
Lincoln Park
Middle school district
Lincoln Park
High school district
Lincoln Park
Directions
Southfield S/E to Fort, South to Goddard, to Drouillard
Standard status
Active
APN
45021080174000
Size
1,200 SF
Lot size
0.10 Acres
Taxes and HOA fees
Tax Description
QD174 175A1 LOT 174 AND THE N 5 FT OF LOT 175 ALSO E 1/2 ADJ VAC ALLEY LINCOLN PARK HIGHLANDS SUB FRAC SEC 19 L46 P91 WCR
Tax Annual Amount
3092
Legal Description
QD174 175A1 LOT 174 AND THE N 5 FT OF LOT 175 ALSO E 1/2 ADJ VAC ALLEY LINCOLN PARK HIGHLANDS SUB FRAC SEC 19 L46 P91 WCR
Utilities
Heating system
Forced Air
Water source
Public
Building Details
Year built
1958
Floors in Building
1
Number of units
3
Building materials
Brick
Architectural style
Ranch
Listing Agency:
Keller Williams Somerset · Keller Williams Realty
(248) 649-7200
Listed By:
Joseph Hammel · License #6501422602
(248) 422-1685
Added: Jul 6
Changed: Sep 13
Last Checked: Oct 6 at 2:06AM
MLS# 20261050386
Copyright © 2026 Realcomp Limited II. All rights reserved. All information provided by the listing agent/broker is deemed reliable but is not guaranteed and should be independently verified.
Investment Insights
Based on property information with market context.
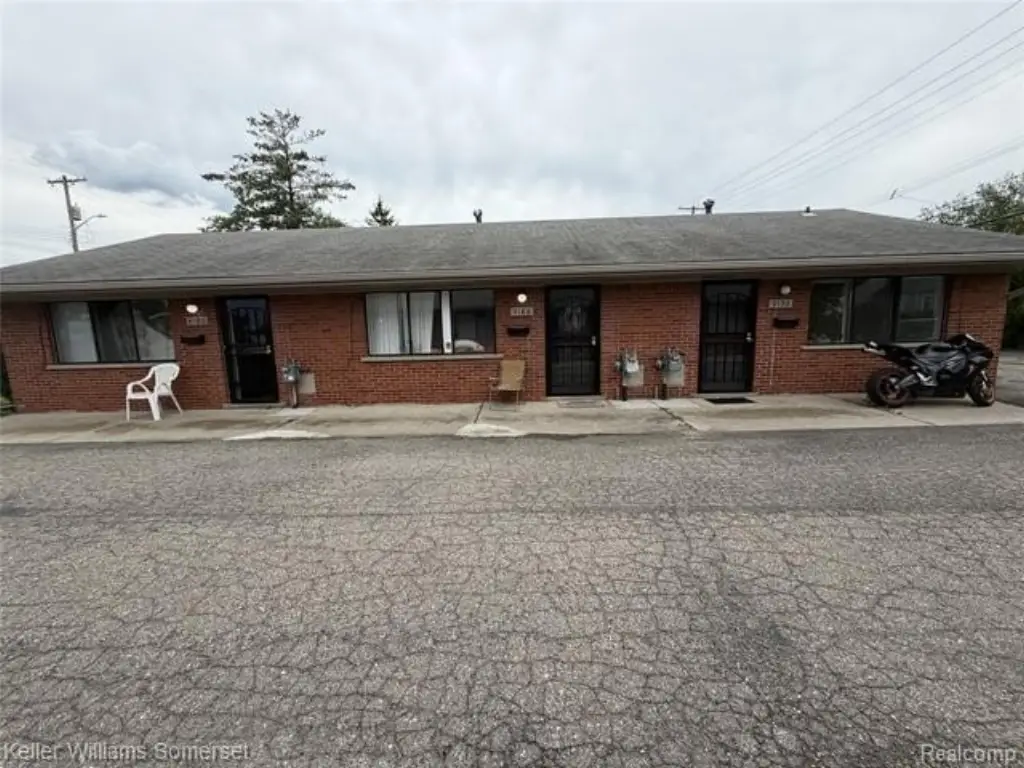
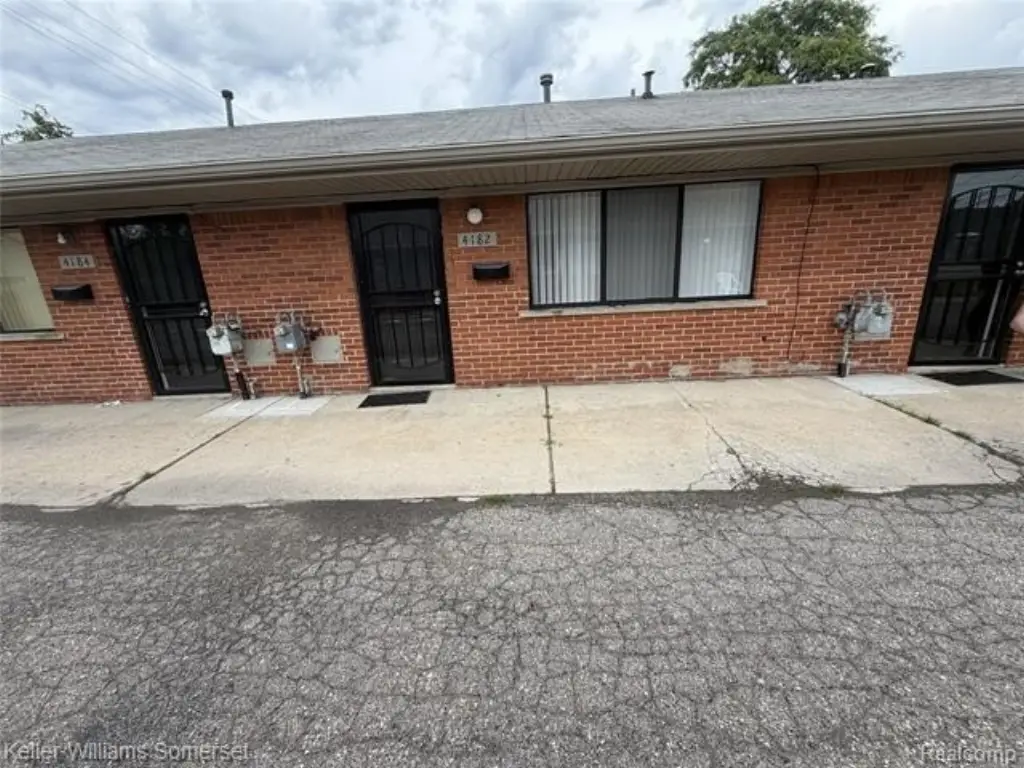
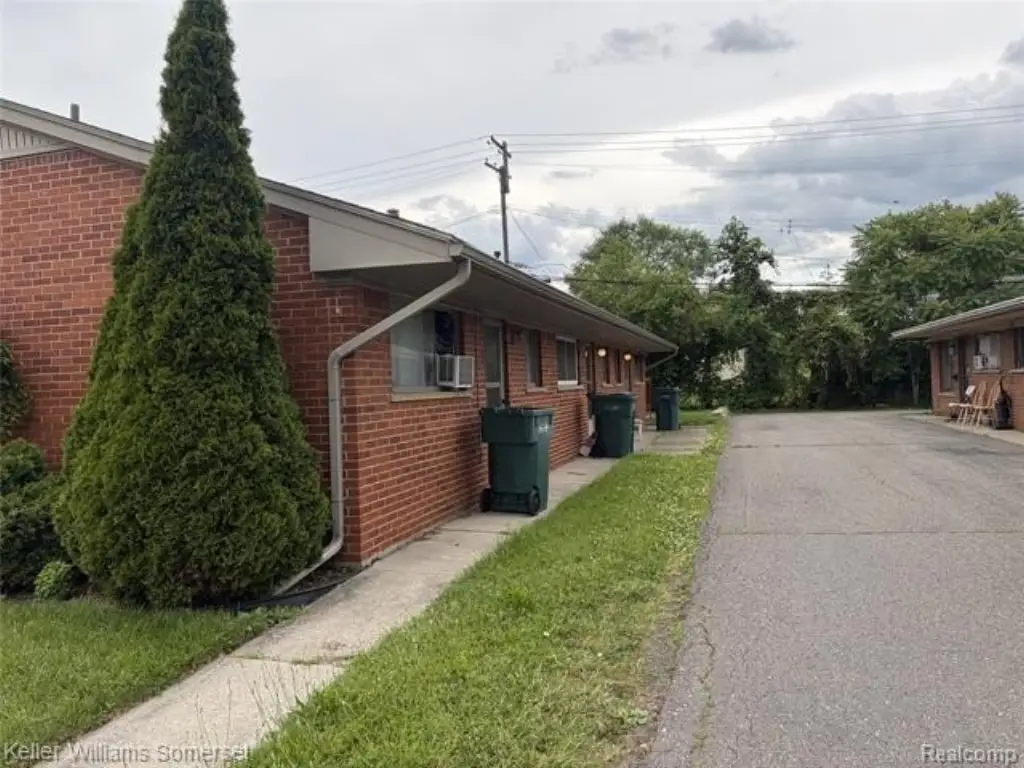
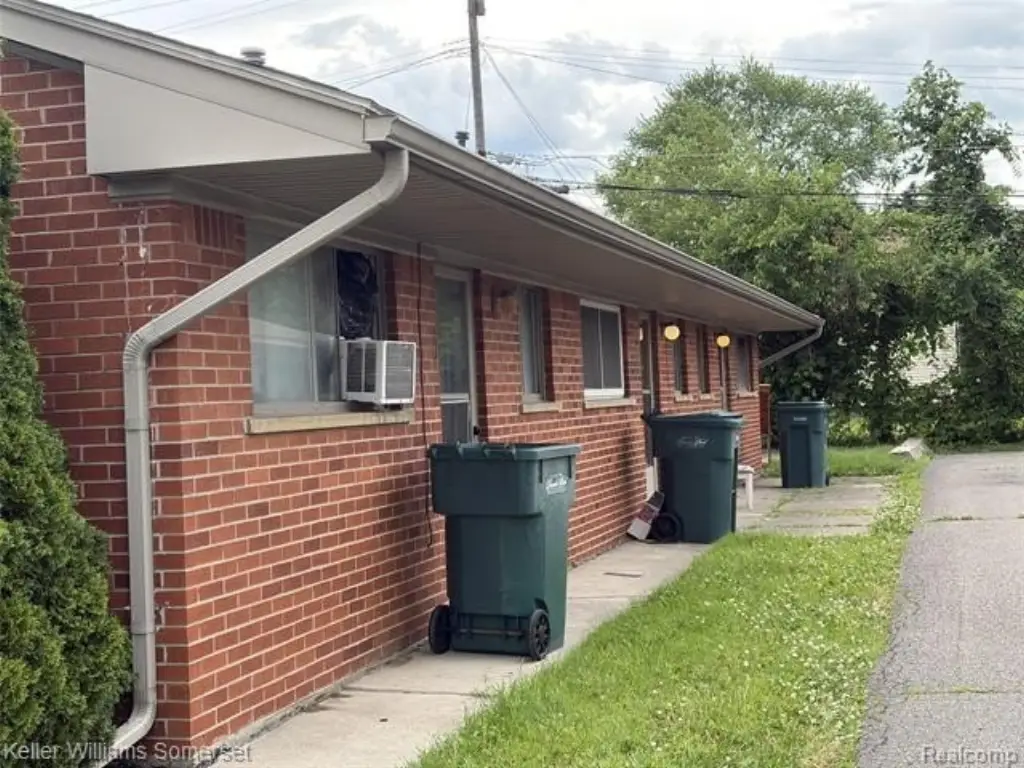
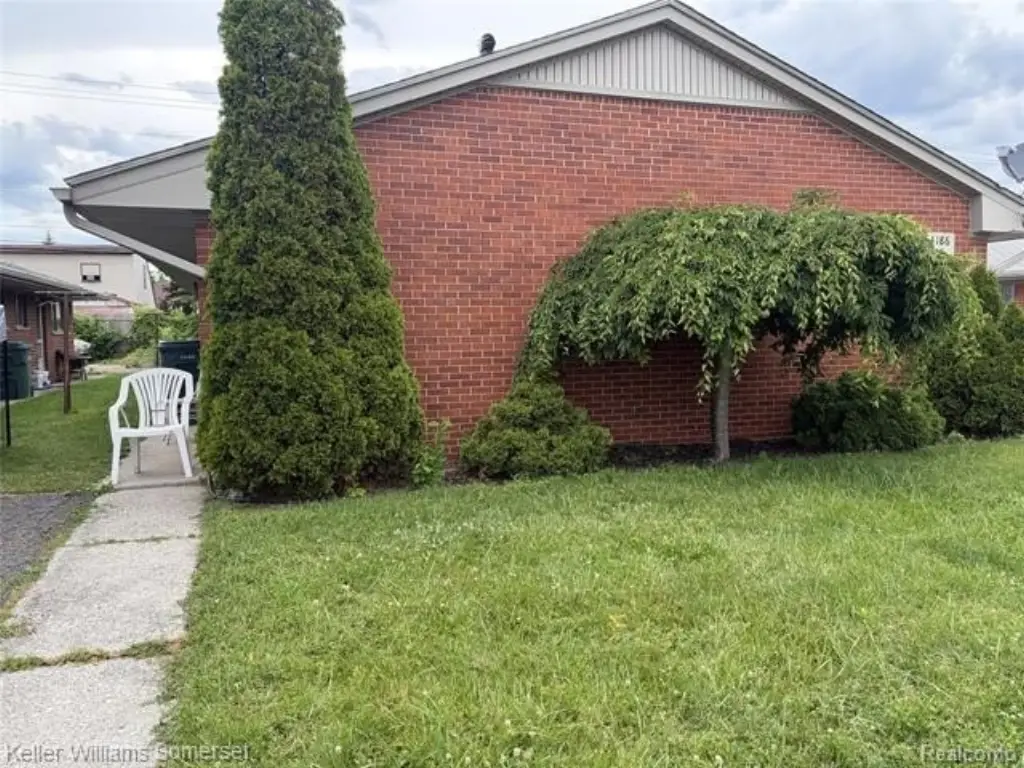
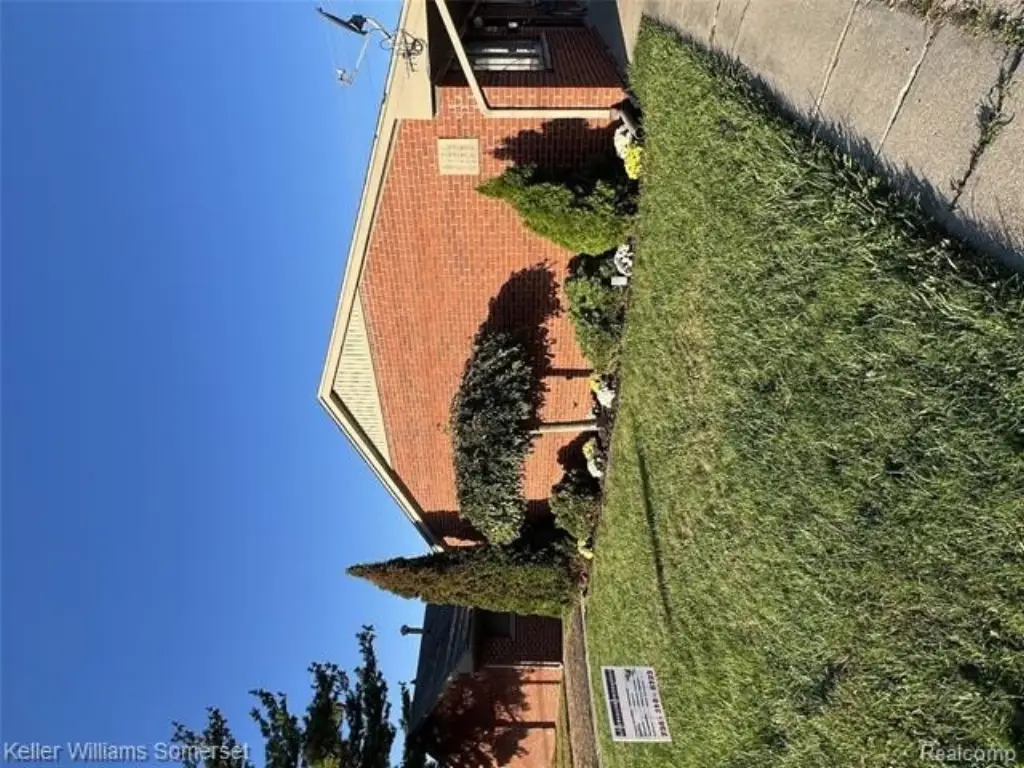
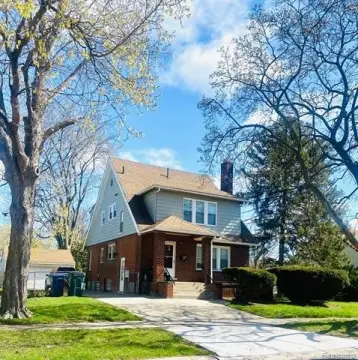
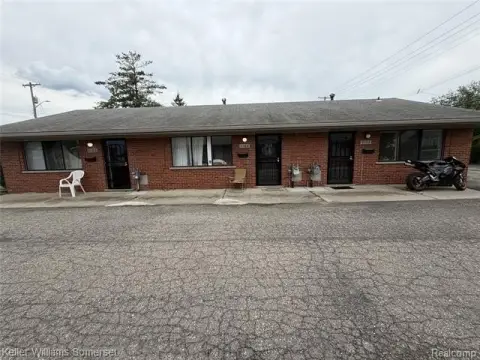
This ranch-style apartment property in Lincoln Park contains six units, with five currently occupied and two units recently renovated. The building measures 1,200 square feet, sits on 0.1 acres, and features brick construction, forced-air heating, and public water service. Built in 1958, the property is zoned Multi-Family.
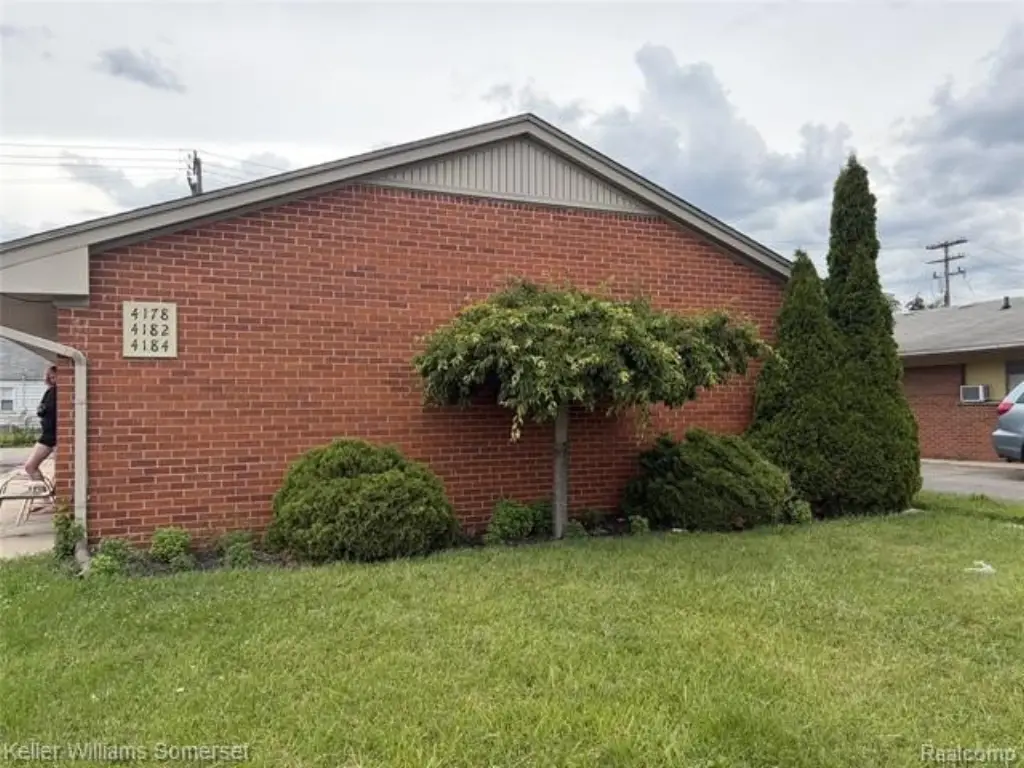
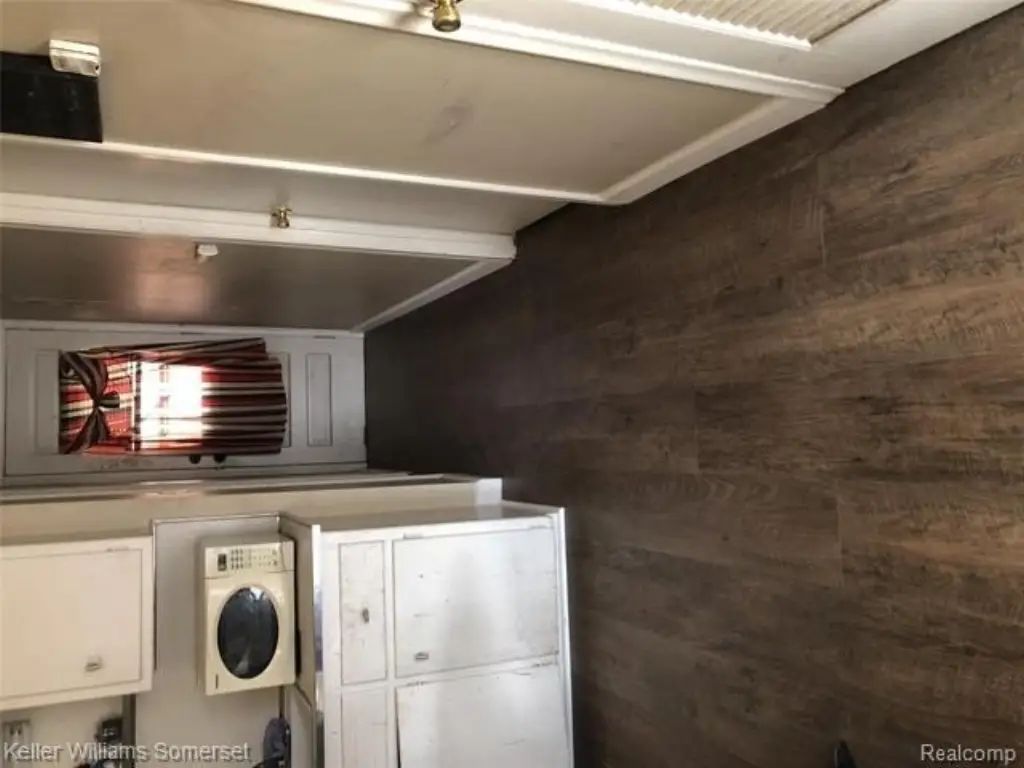
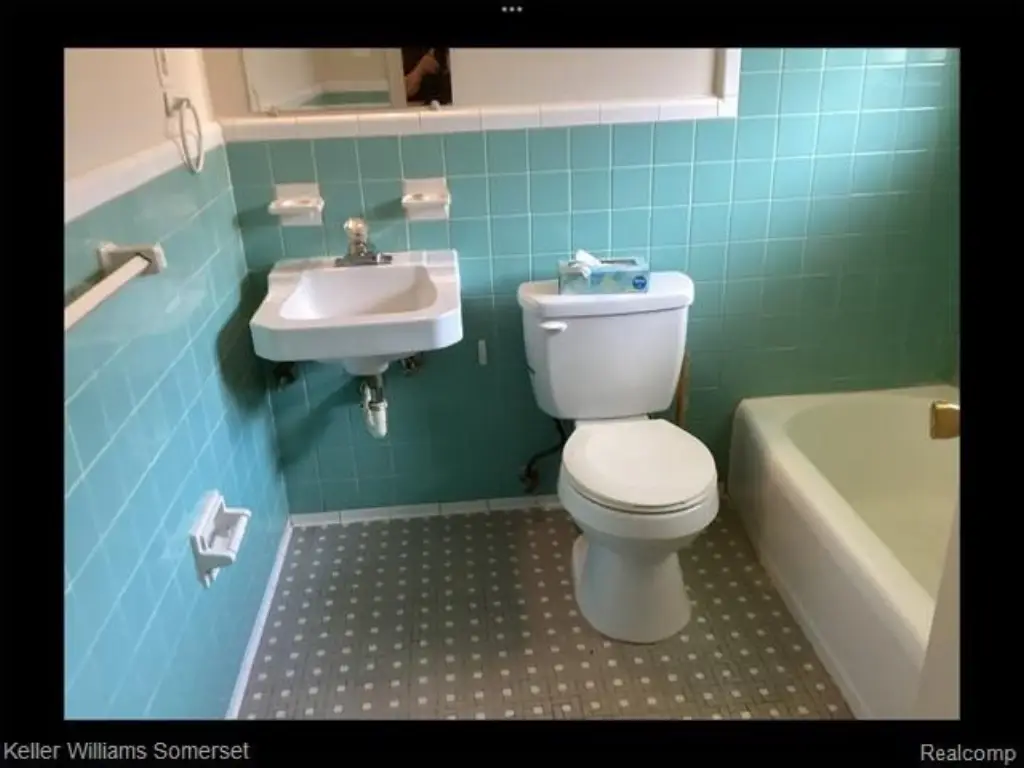
The roof, furnaces, and water heaters have recently undergone inspections. The property is identified with two separate tax IDs, allowing the 4178 and 4186 Drouillard Street buildings to be purchased together or separately. Current occupancy, recent unit improvements, and the existing six-unit layout provide a clear snapshot of the property’s operating configuration.
The roof, furnaces, and water heaters have recently undergone inspections. The property is identified with two separate tax IDs, allowing the 4178 and 4186 Drouillard Street buildings to be purchased together or separately. Current occupancy, recent unit improvements, and the existing six-unit layout provide a clear snapshot of the property’s operating configuration.
Key Highlights
- Six total units with 5 currently rented
- 2 units recently renovated
- 1,200 square feet on 0.1 acres
Financial Insights
Estimated NOI and Cap Rate
NOI / Yr
$10,818
Cap Rate
4.33%
Suggested Prices Based on Cap Rates
Cap Rate 5%
$216,360
$216.4K
Cap Rate 7%
$154,543
$154.5K
Cap Rate 9%
$120,200
$120.2K
Market Conditions
NOI Build-Up for 1,200 SF
Gross rent
$20.9K $17.40/SF
− Vacancy
−$1.2K −$1.01/SF
EGI
$19.7K $16.39/SF
− OpEx
−$8.9K −$7.38/SF
NOI
$10.8K $9.01/SF
Area
Wayne County, MI
Vacancy
5.80%
Lease Rate
$17.40 /SF/Yr
Expense Ratio
45.00%
Simulate Cap Rate and NOI
Suggested Prices Based on Cap Rates
Cap Rate 5%
$216,360
Cap Rate 7%
$154,543
Cap Rate 9%
$120,200
Alternative Uses
Best Use
Apartment 5plus
$154.5K
$135.2K – $180.3K
NOI $10,818 @ 7.0% cap · market cap 4.33%
Second Best
—
—
no second resolved use
Theoretical Best
Specialty Retail
$222.2K
$194.4K – $259.2K
NOI $15,552 @ 7.0% cap · market cap 6.22%
Zoning and permitted uses should be independently verified with authorities.
Property Analytics
Unlock full access to Insights
Subscribe to Realmo Intelligence
Open Analytics
Current Use
Lease Details
6
Residential units
Location Intelligence
Trade Area within ½ mile
469
Businesses Nearby
Explore this area
Business Placement
Demographics for 48146, MI
40,245
Population
15,874
Households
2.5
Avg Household Size
37
Median Age
11%
College-Educated
81%
High-School Grad
5.8 sq mi
ZIP Area
6,939
Density / Sq Mi
$57,183
Median Household Income
$36,886
Median Earnings
$972
Median Rent
$117,400
Median Home Value
Check the figures for this property
Cap Rate, Value Estimation, Potential NOI and more
View Realmo Analytics
Market
Vacancy Rate% for Multifamily in Midwest region

Questions? Ask Rey
Realmo’s AI knows this listing — price, zoning, demand, history. Ask anything.






Frequently Asked Questions
What type of property is this?
Apartment building - Brick construction, public water, and forced-air heating support the property’s existing residential configuration.
Where is this apartment building located?
The property is located at 4186 Drouillard Street Lincoln Park, MI.
What is the asking price?
The asking price for this property is $250,000.
What are key features of this property?
This property features: Six total units with 5 currently rented; 2 units recently renovated; 1,200 square feet on 0.1 acres


