Single-Family Residence with Covered


For Sale
$532,987
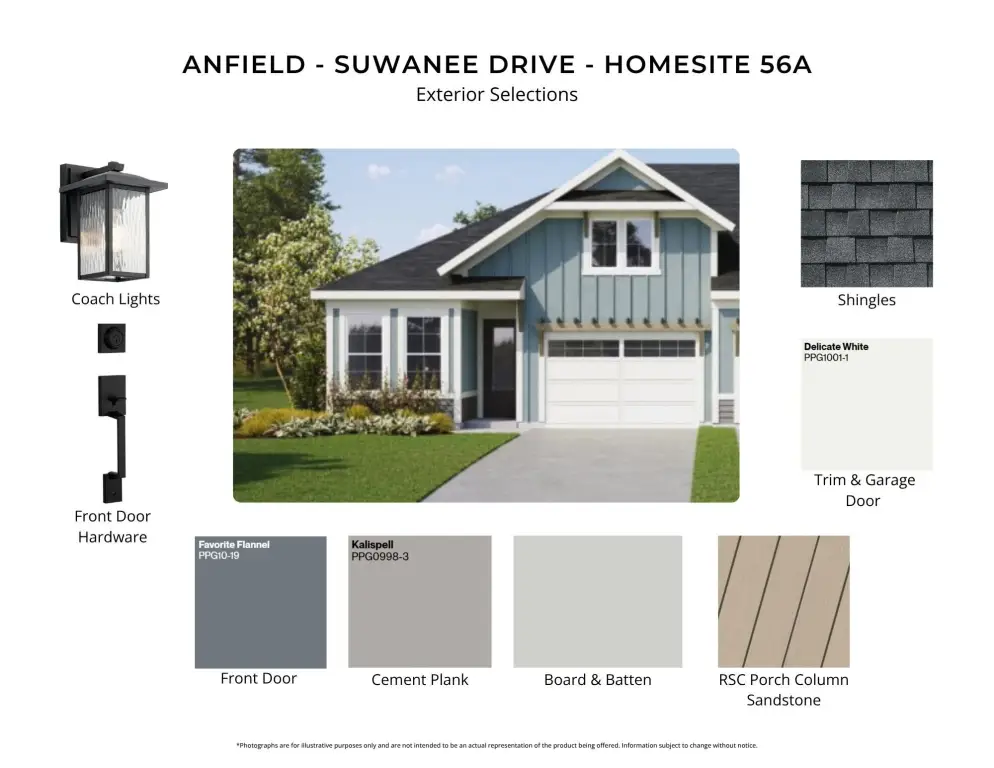
415 A Suwannee Drive, Watersound, FL 32461
Residential, Watersound, FL
Property Size1,442 SF
Price / SF$369.62
Days on Market107
Property Features for 415 A Suwannee Drive
General Information
Property type
Residential Multi Family
Property subtype
Other
Property condition
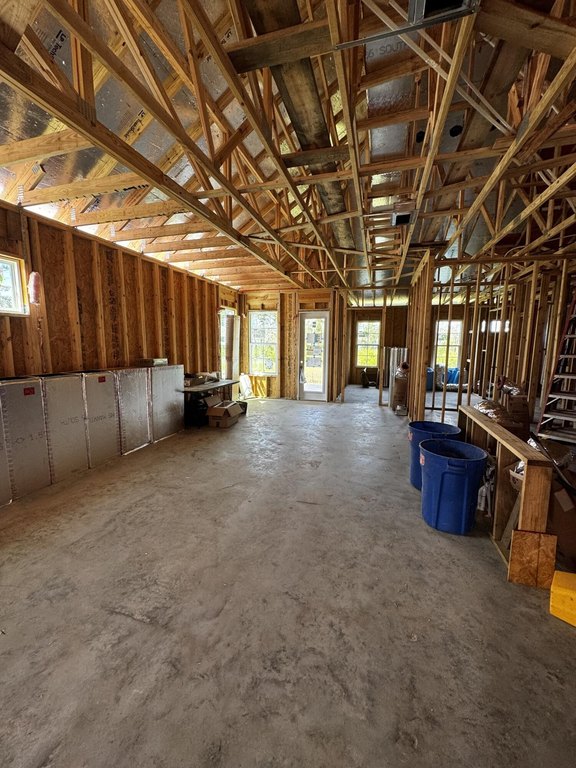
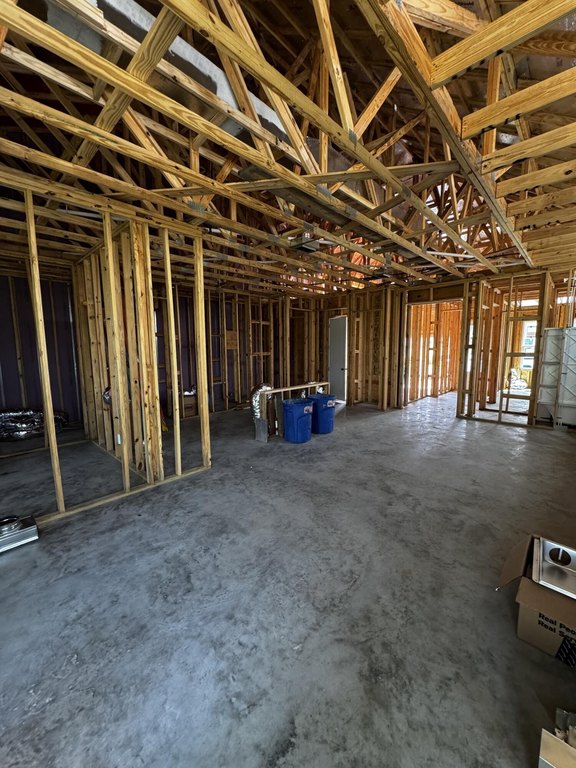
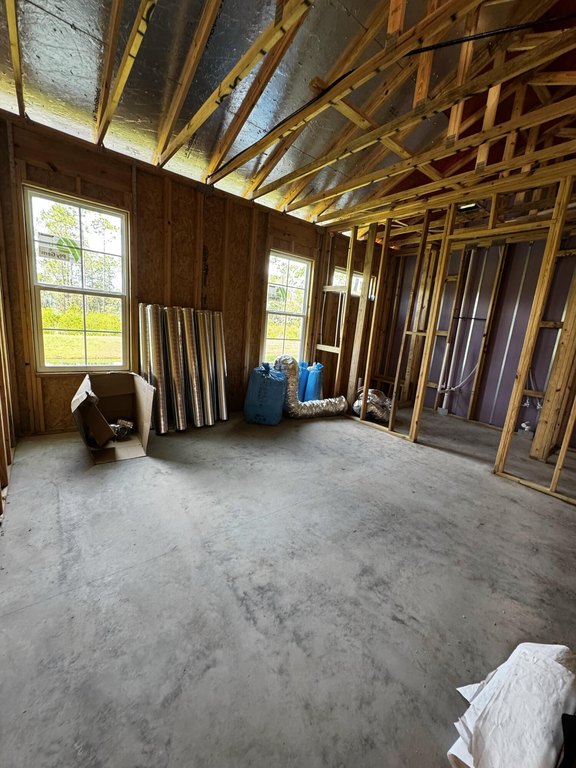
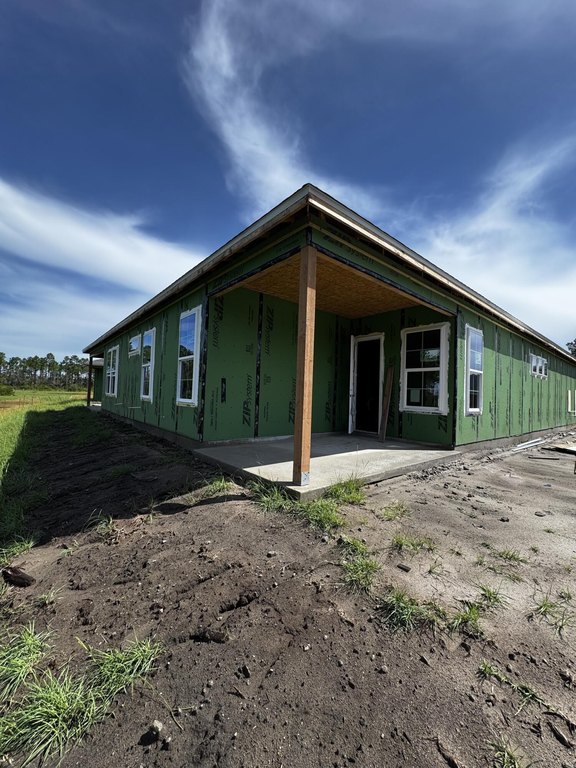
Under Construction
Zoning
Resid Single Family
Bedrooms
2
Bathrooms
3
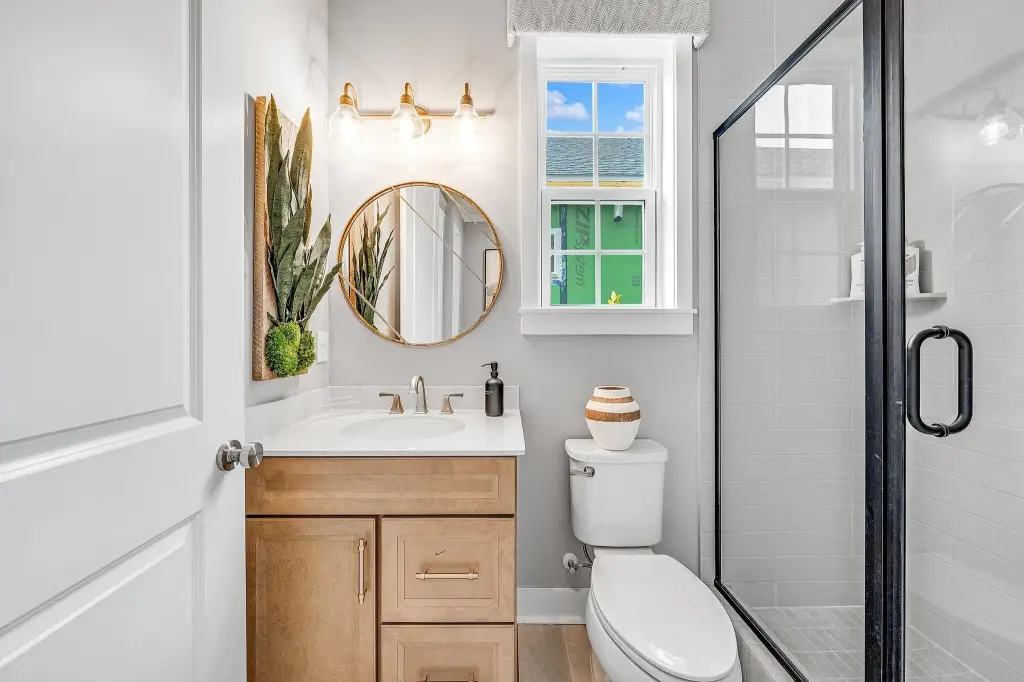
Full bathrooms
2
Half bathrooms
1
Rooms
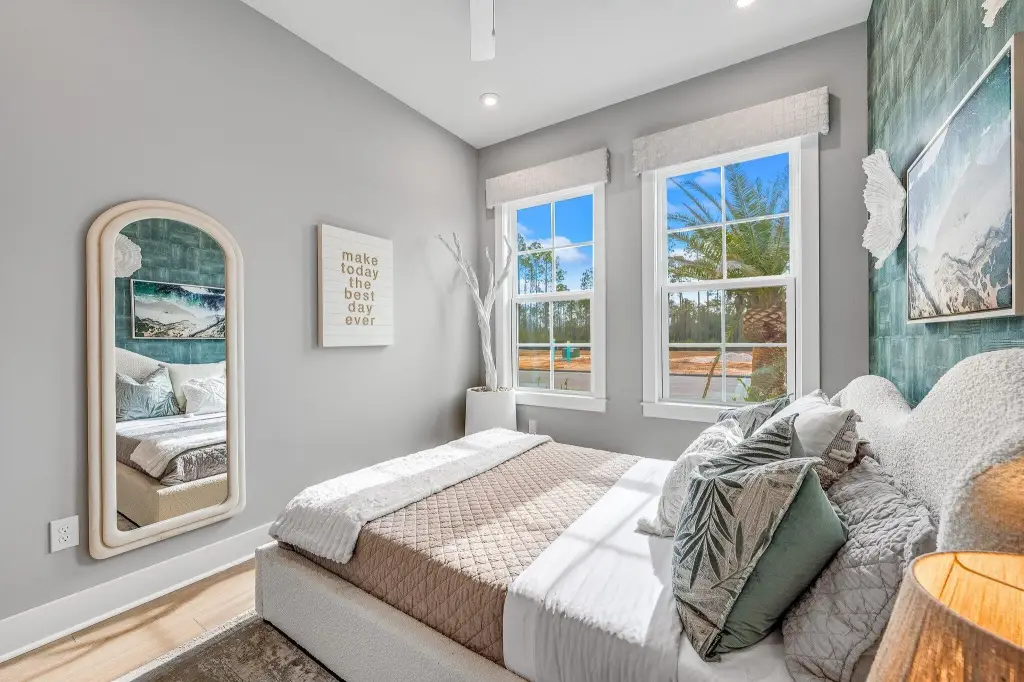
Family Room, Bedroom 2, Bathroom 2, Bathroom 3, Bathroom 1, Bedroom 1
Parking
2
Window features
Storm Window(s)
Patio and Porch features
Porch, Patio
Interior features
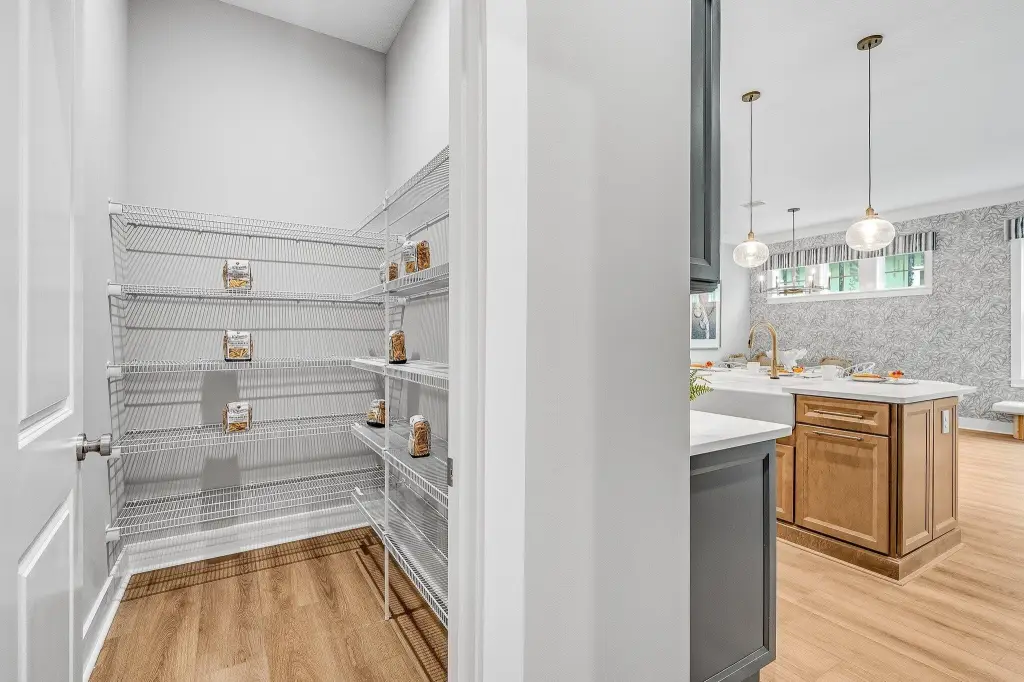
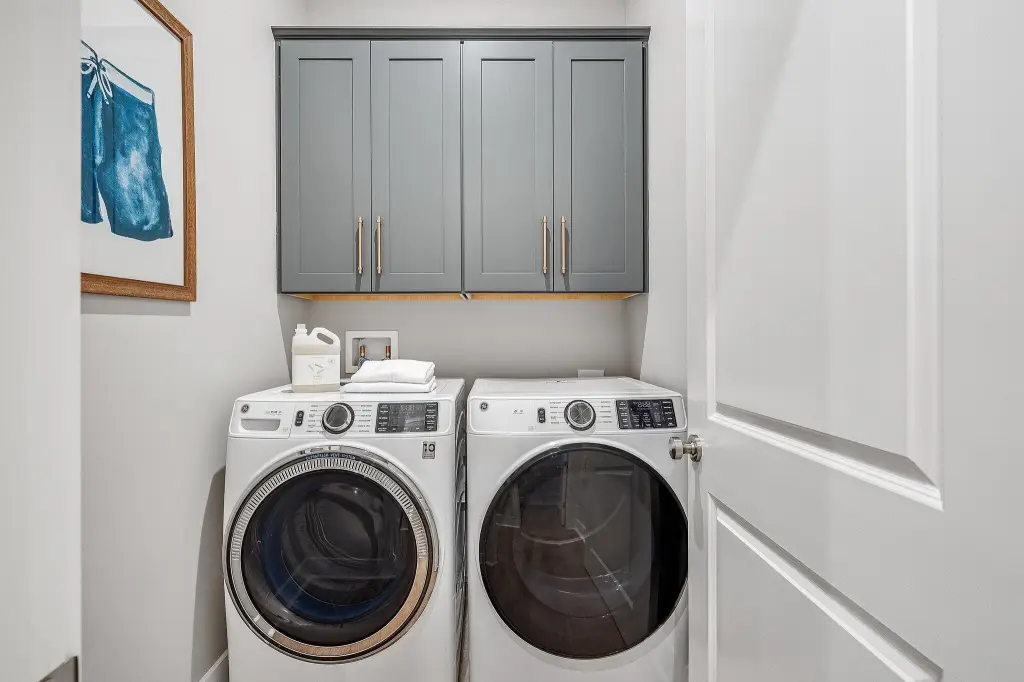
Kitchen Island, Lighting Recessed, Pantry, Pull Down Stairs, Washer/Dryer Hookup, Woodwork Painted
Exterior features
Sprinkler System
Appliances
Auto Garage Door Opn, Cooktop, Dishwasher, Disposal, Microwave, Refrigerator, Security System, Smoke Detector, Stove/Oven Electric, Warranty Provided, Water Heater - Tnkls
Subdivision
WATERSOUND ORIGINS
Lot features
Interior, Wooded
Elementary school
Dune Lakes
Middle school
Emerald Coast
High school
South Walton
Directions
Located in the Watersound Town Center. From Hwy 98, turn onto Watersound Pkwy North, then turn right onto Origins Main St, and the Watersound Real Estate office is the second building on the right. 34 Origins Main St, Ste 101.
Standard status
Active
APN
23-3S-18-16160-000-0560
Size
1,442 SF
Taxes and HOA fees
Tax Description
LOT 56 THE VILLAS AT LONGLEAF PARK PB 26-93 OR 3362-2141
HOA Fee
$924 Quarterly
Legal Description
LOT 56 THE VILLAS AT LONGLEAF PARK PB 26-93 OR 3362-2141
Utilities
Sewer type
Public Sewer
Heating system
Central
Cooling system
Central Air
Building Details
Year built
2026
Floors in Building
1
Flooring type
Tile, Vinyl
Building materials
Frame, Siding CmntFbrHrdBrd
Architectural style
Other
Listing Agency:
Watersound Real Estate
(850) 213-5170
Listed By:
Builder Services
(850) 428-3002
Added: Jul 3
Changed: Oct 1
Last Checked: Oct 17 at 10:06AM
MLS# 1006928
Copyright © 2026 Emerald Coast Association of Realtors. All rights reserved. All information provided by the listing agent/broker is deemed reliable but is not guaranteed and should be independently verified.

Ask AI about this property
Review the available facts, identify missing information and prepare questions for the agent.
Investment Insights
Based on property information with market context.
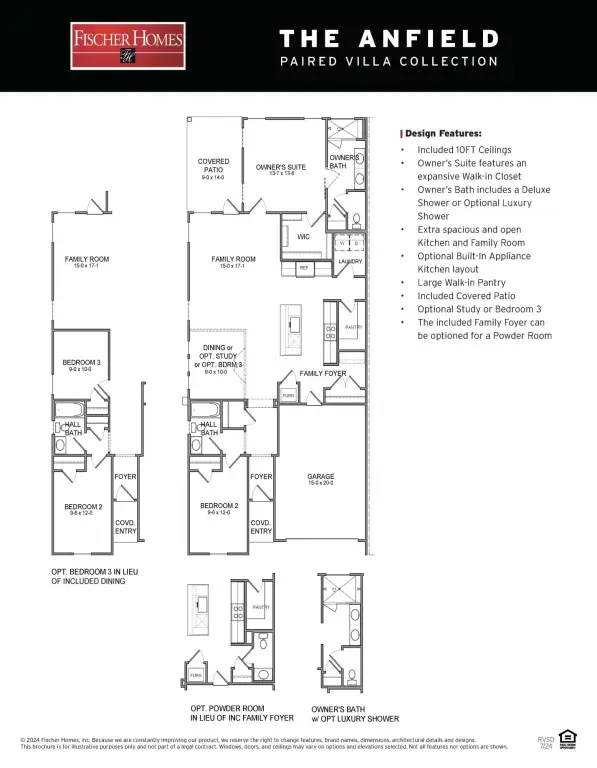
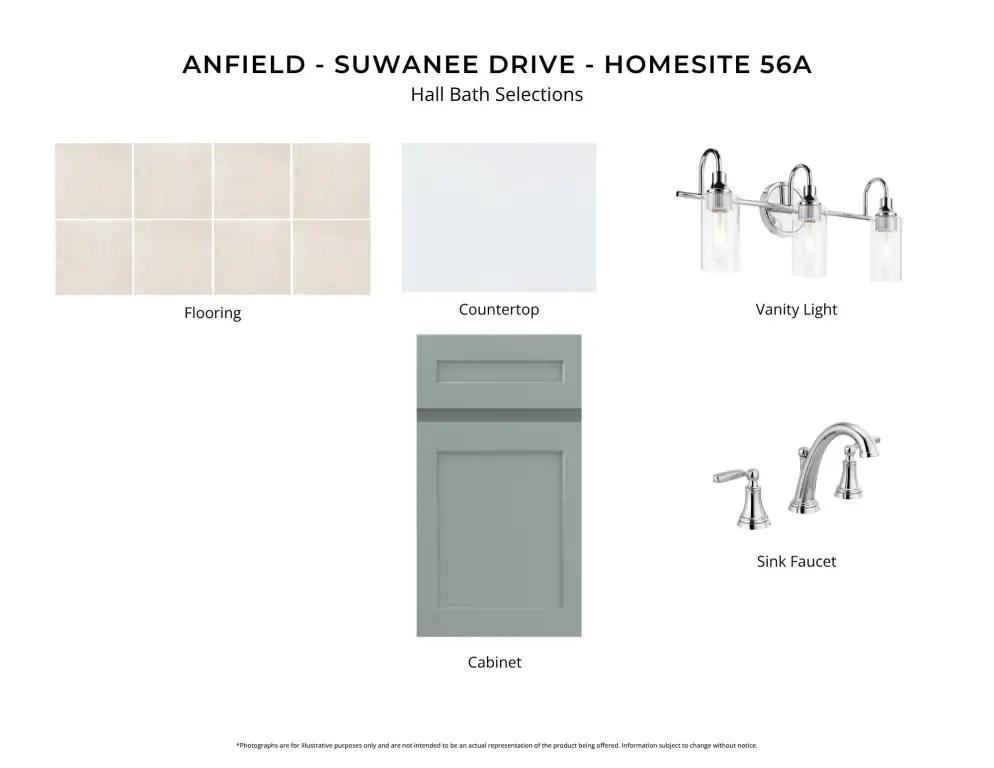
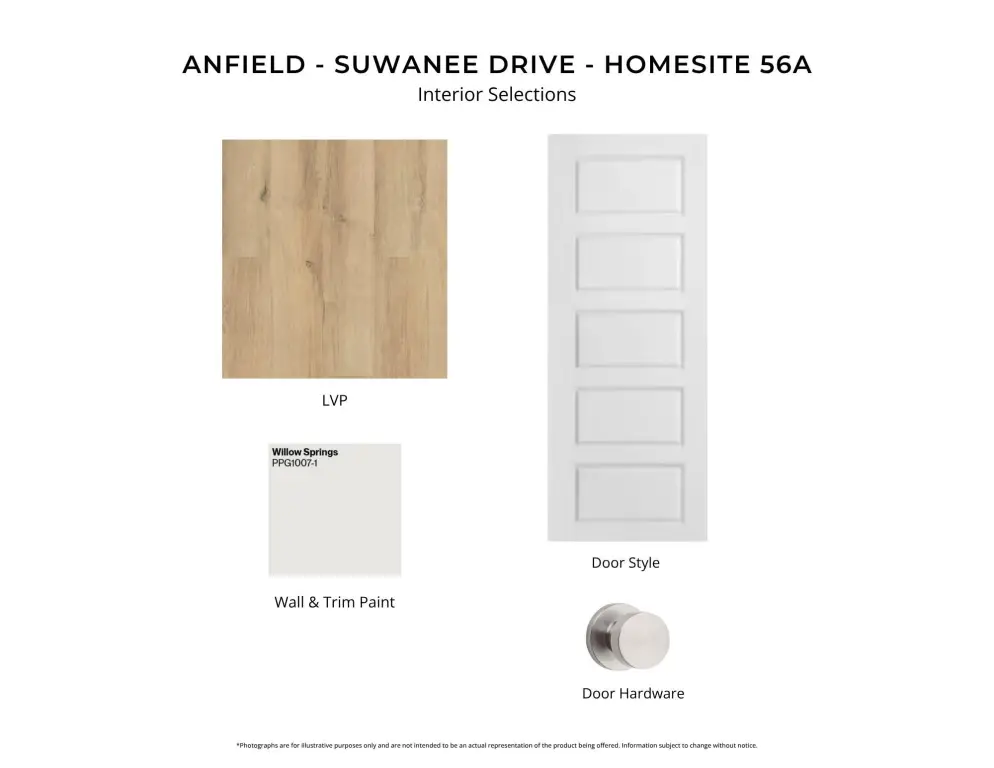
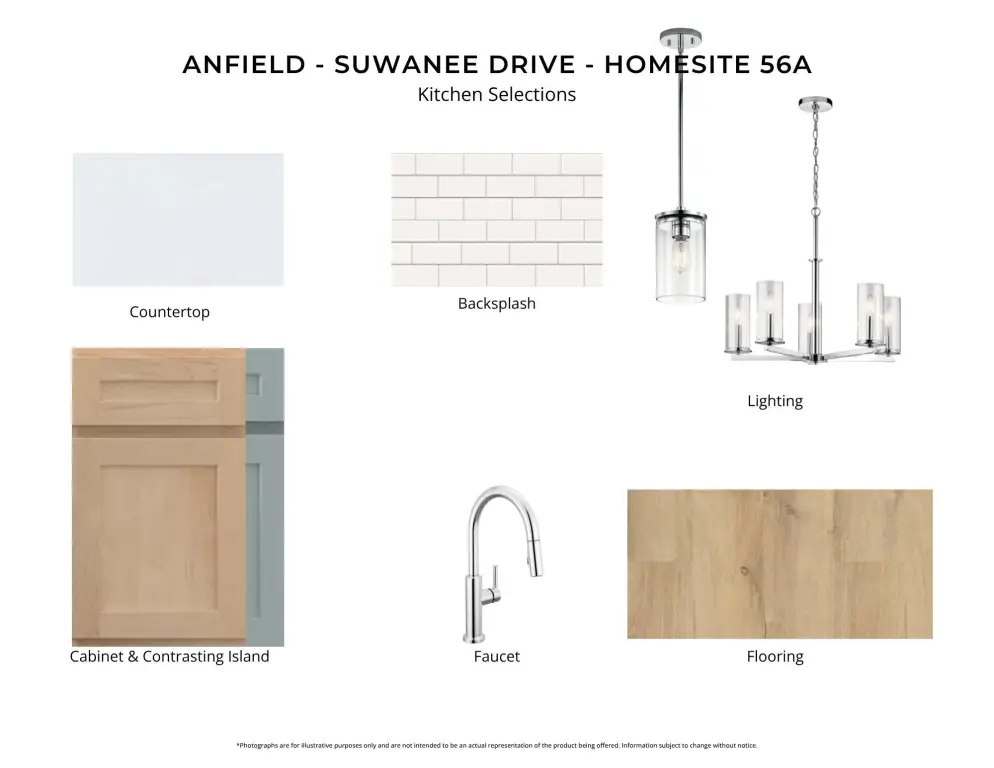
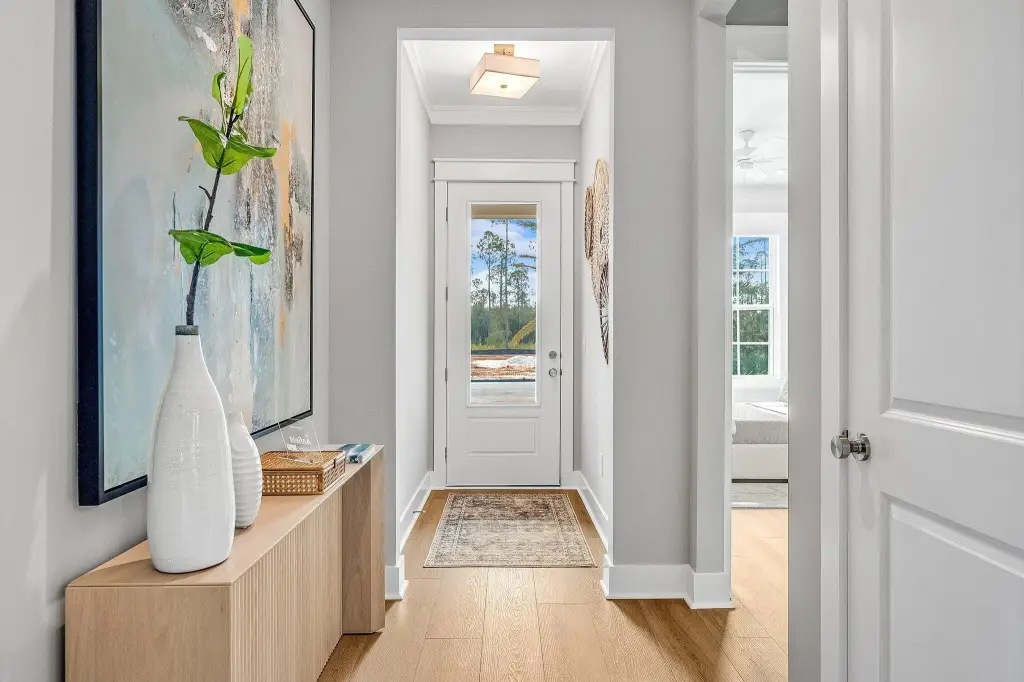
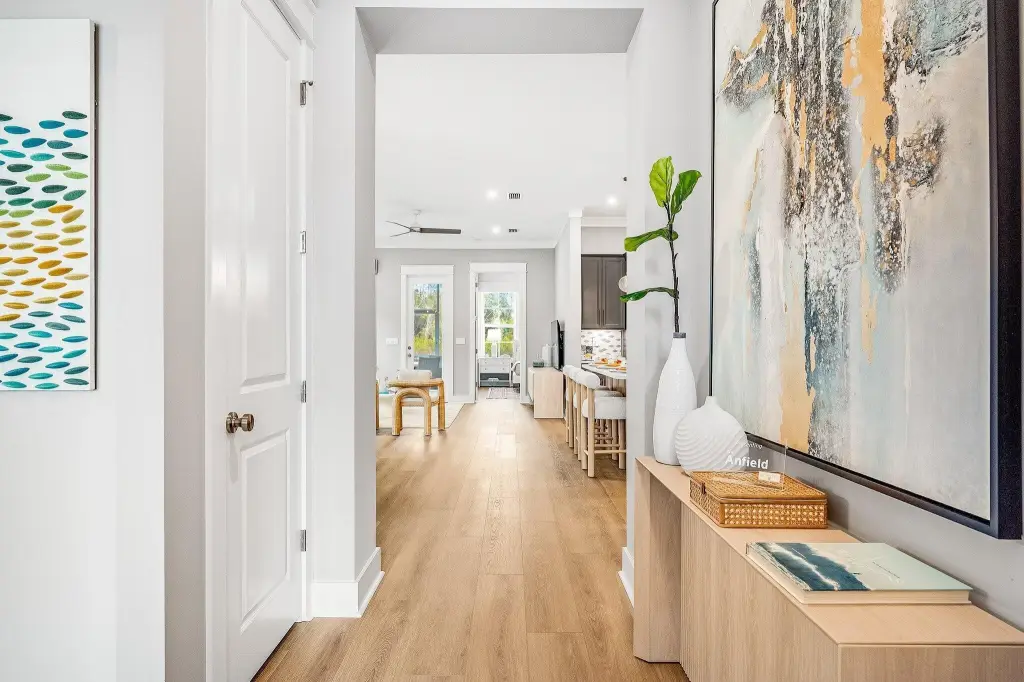
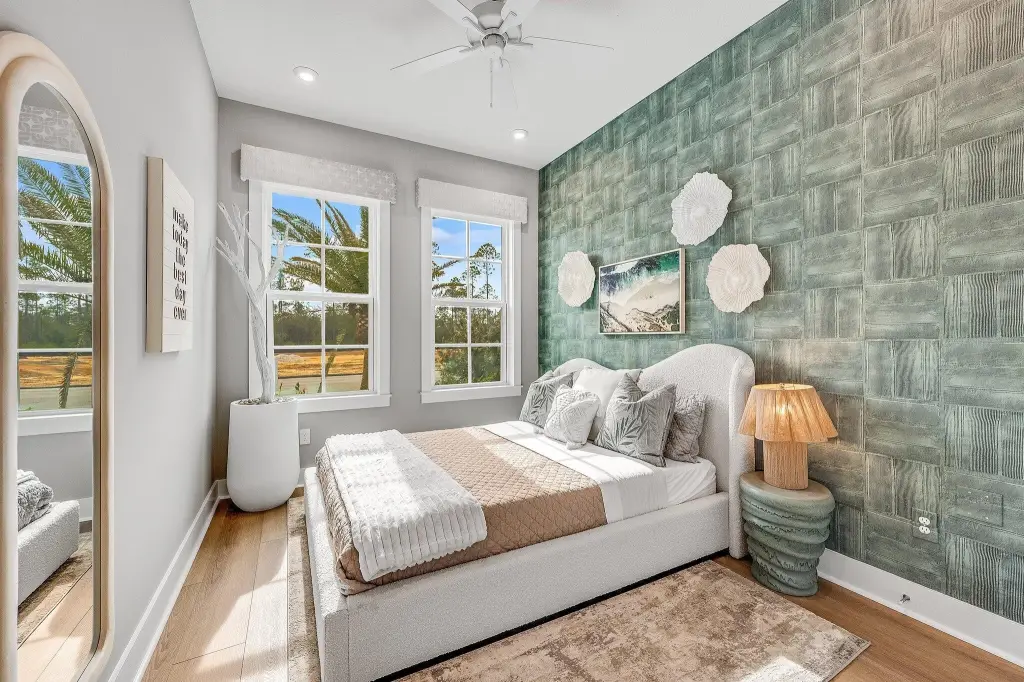
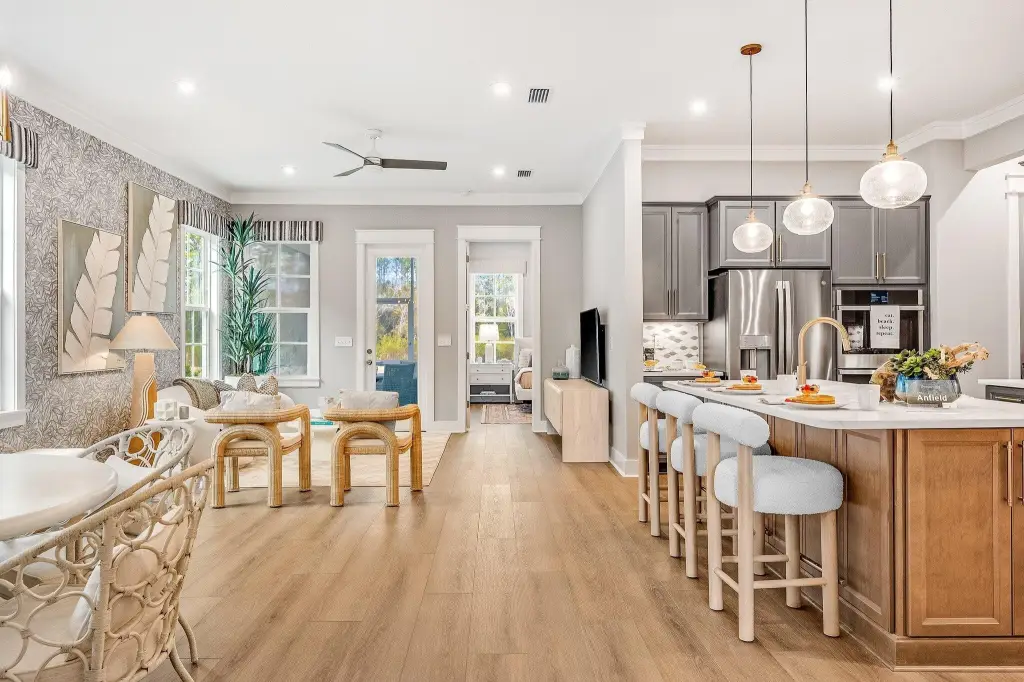
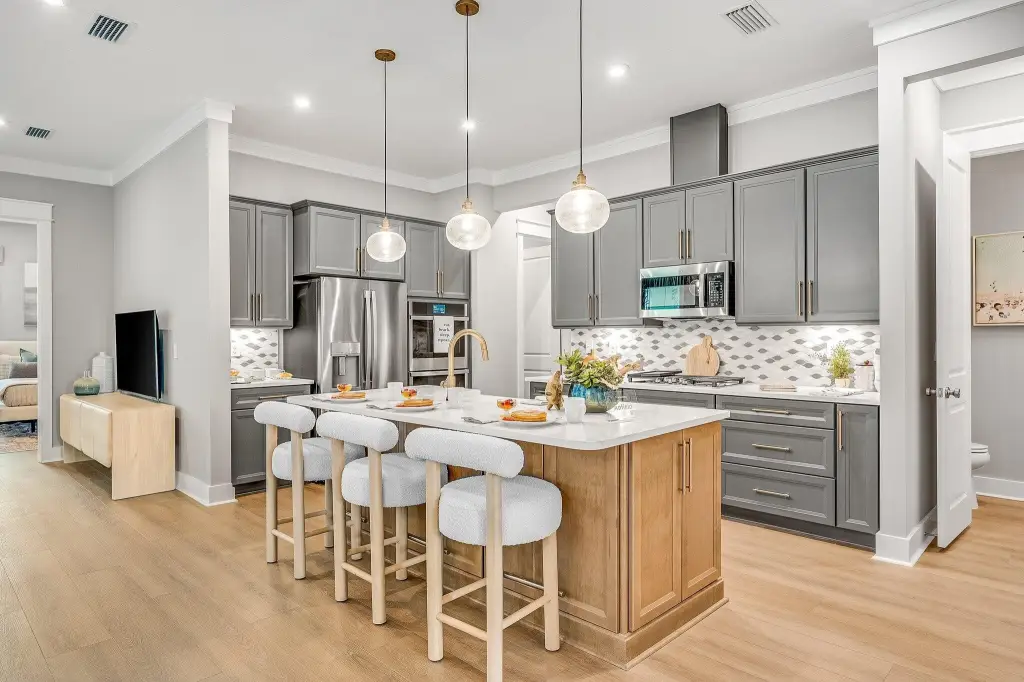
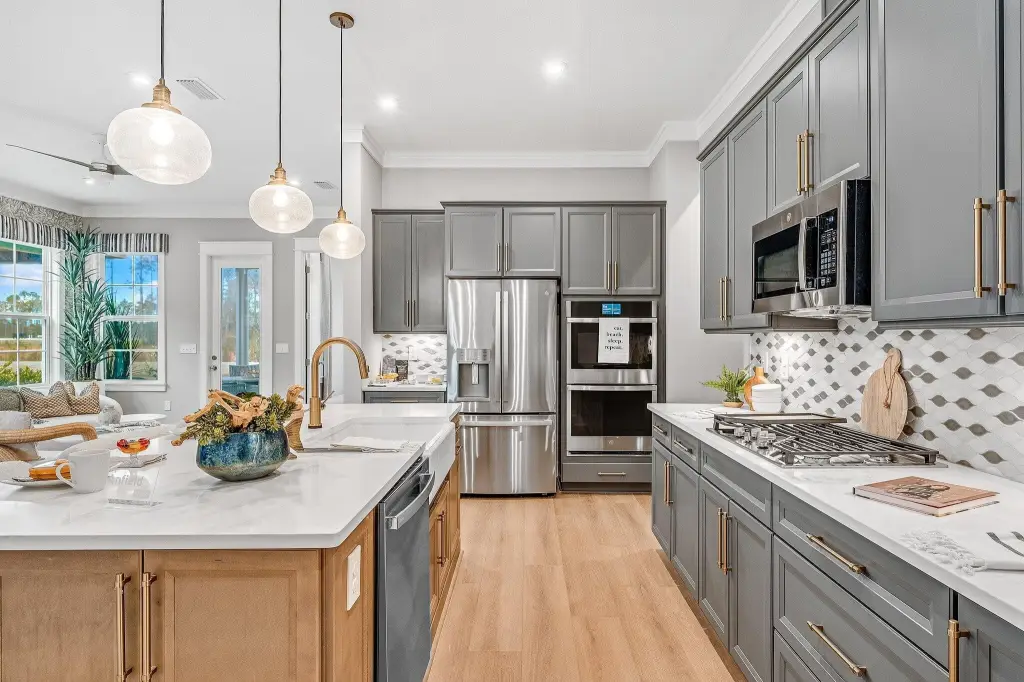
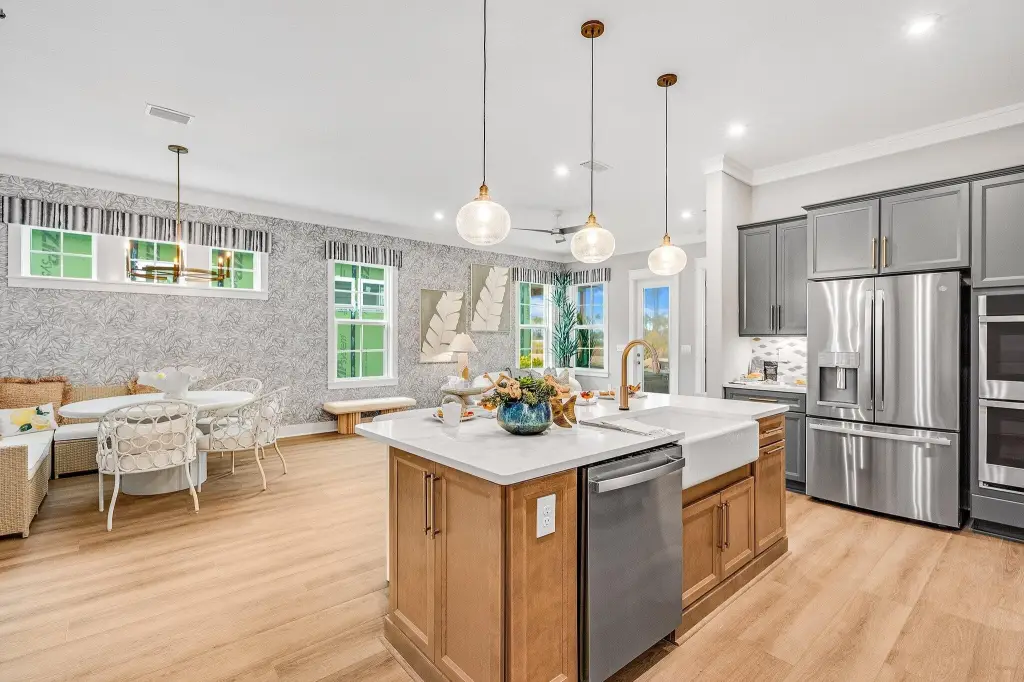
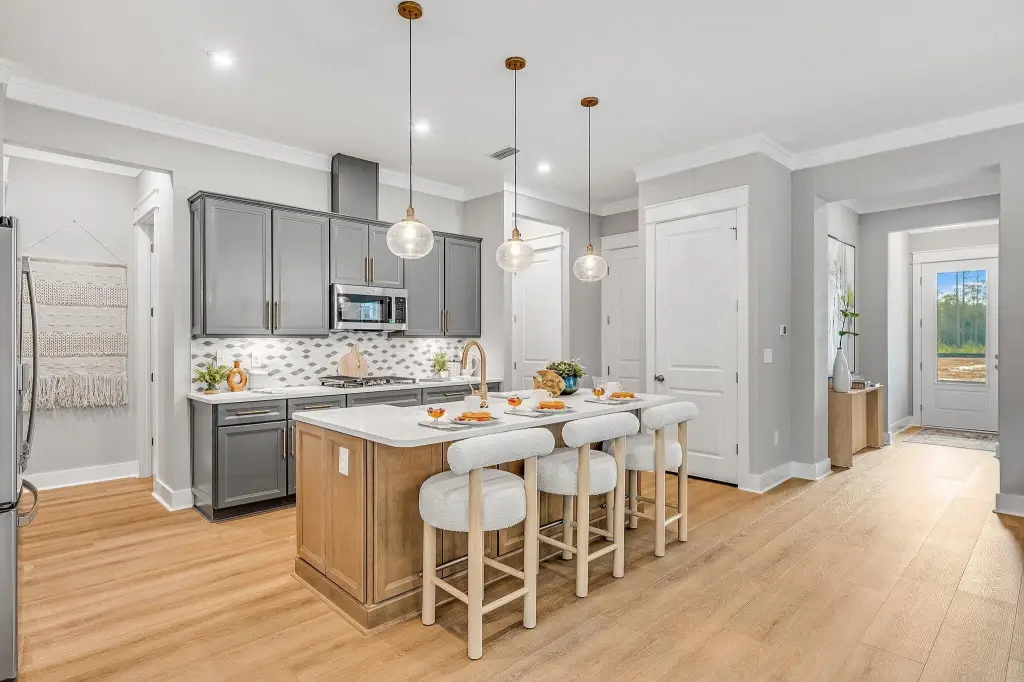
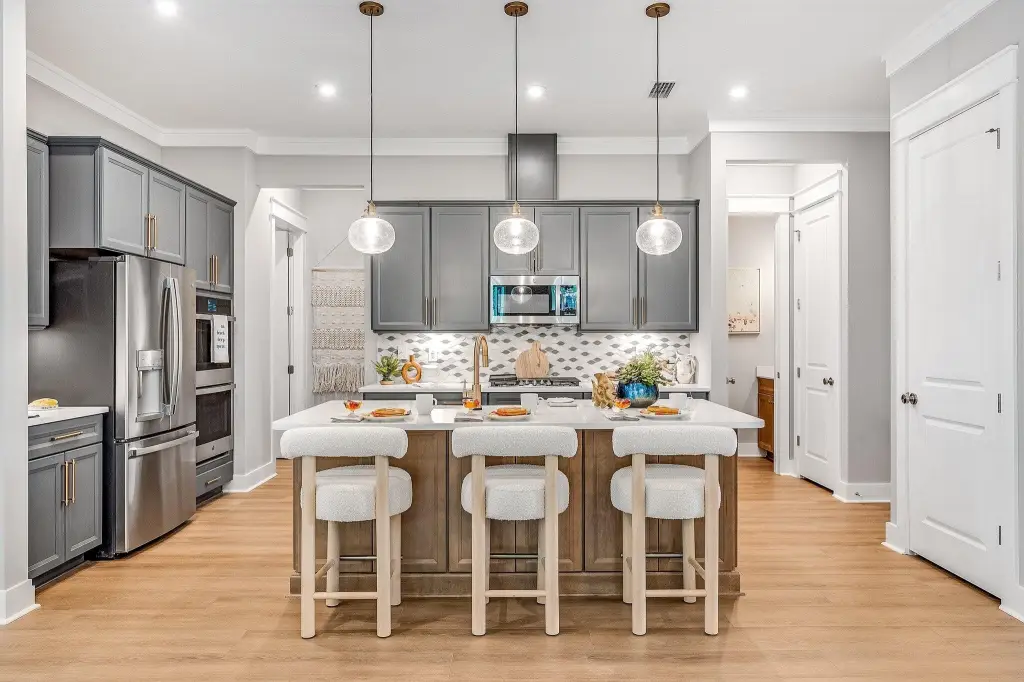
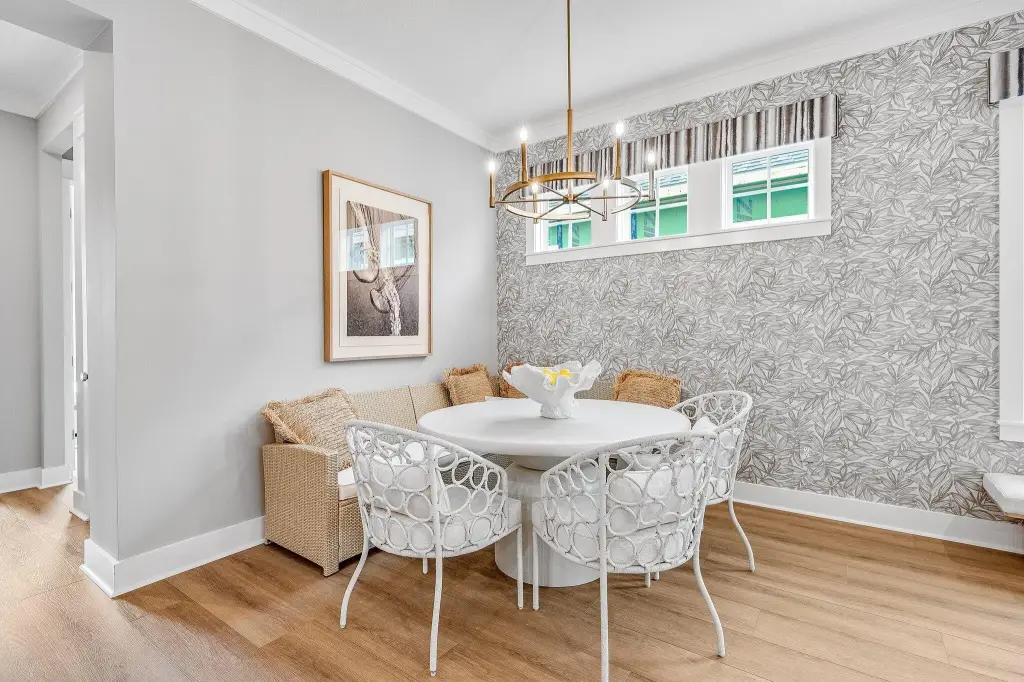
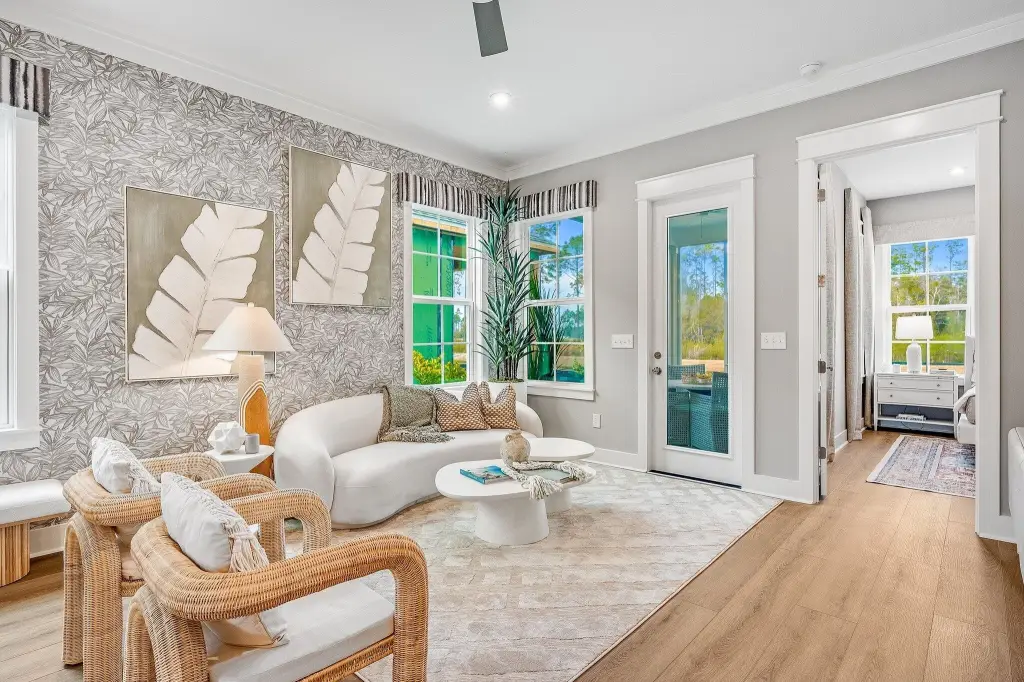
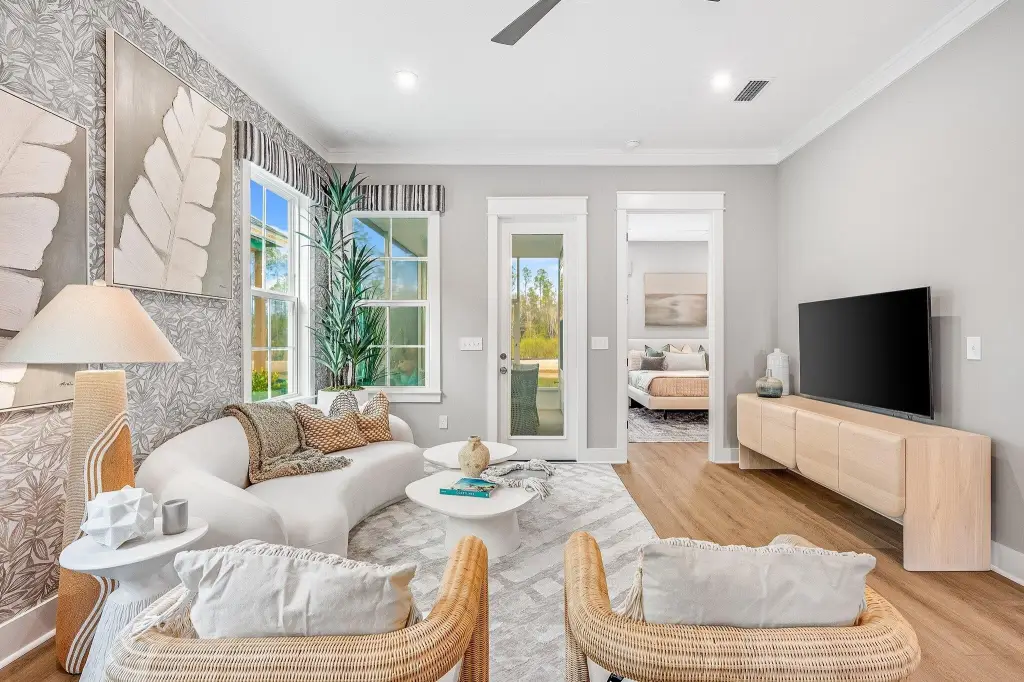
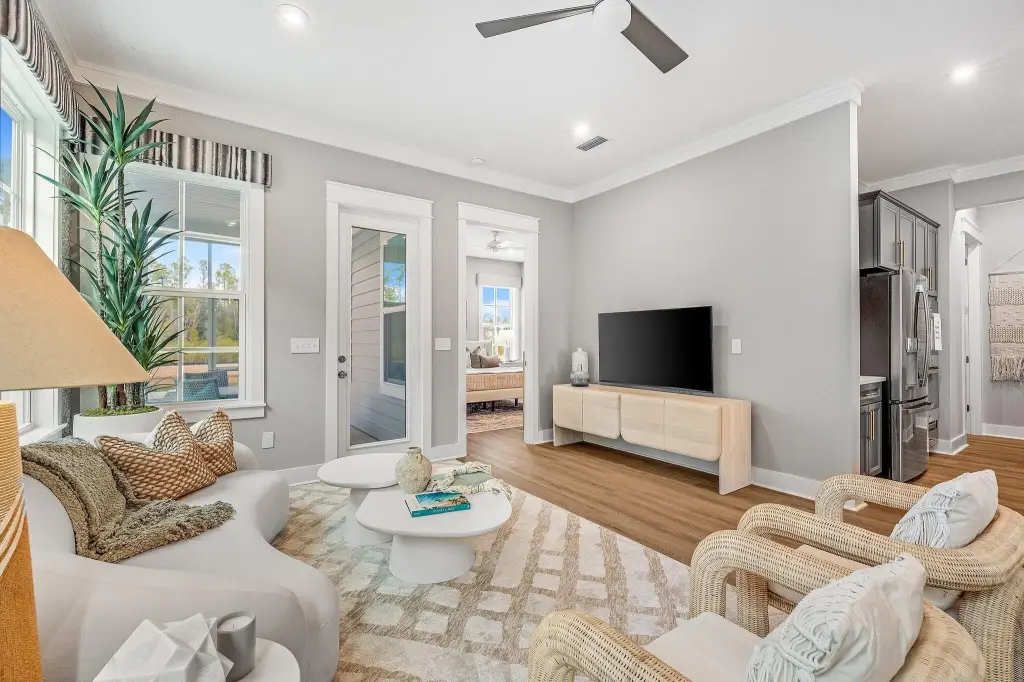
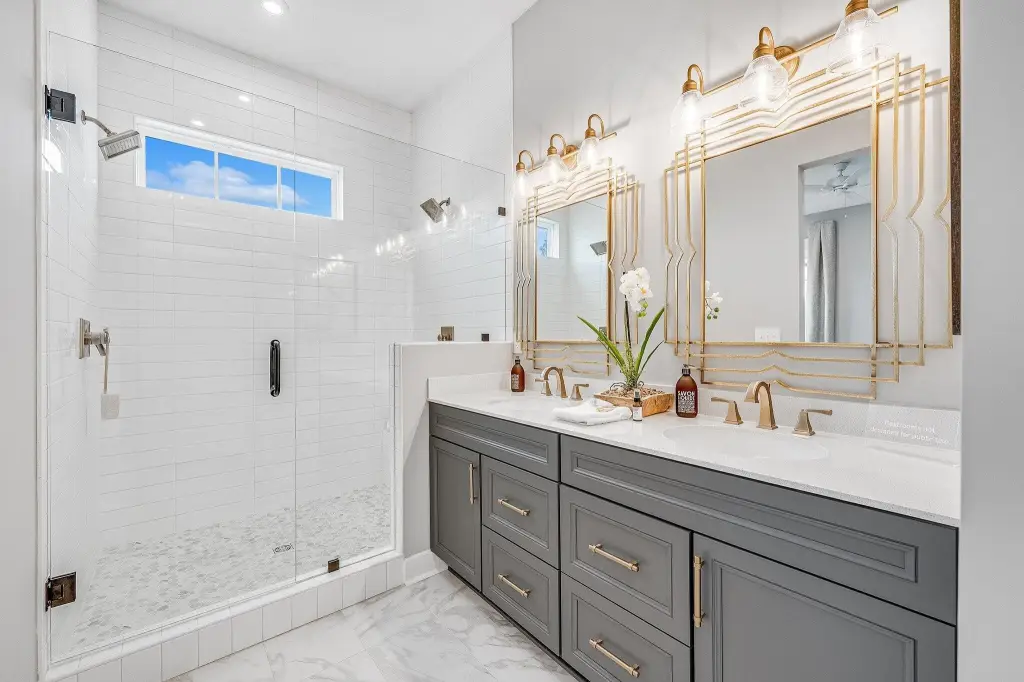
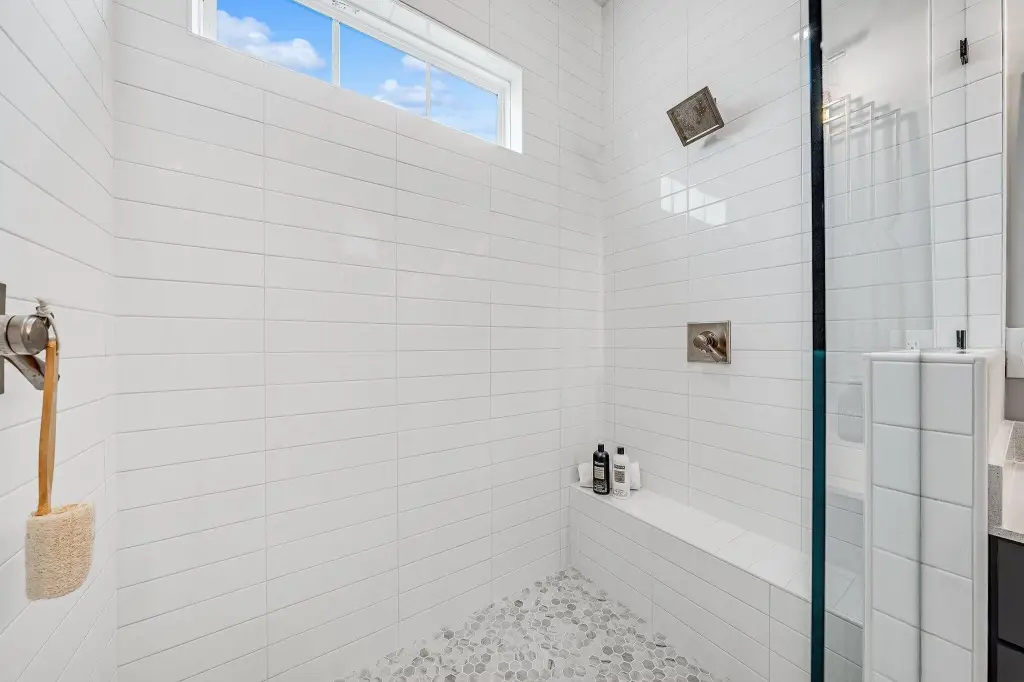
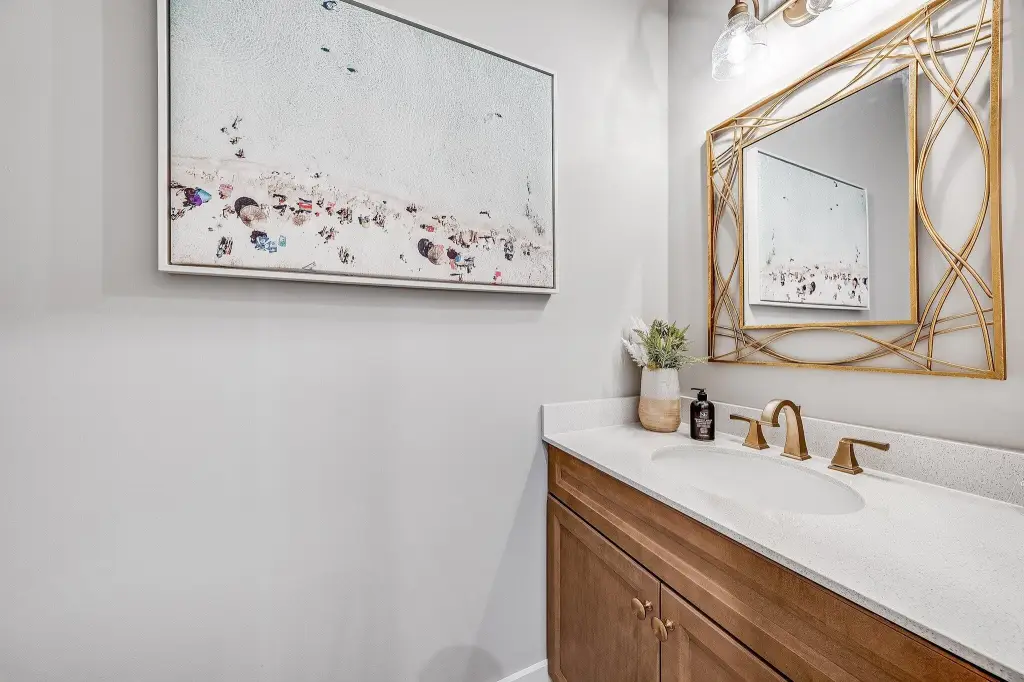
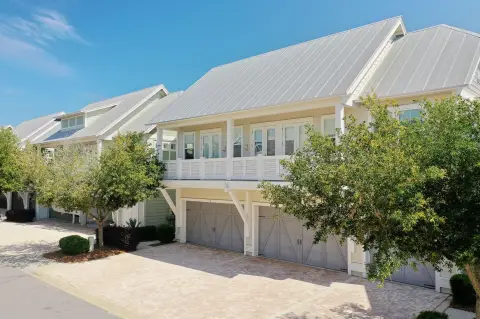
This newly planned single-family residence features 10-foot ceilings and an open kitchen, dining, and family room for a central gathering layout. The home offers two bedrooms, two bathrooms, plus an additional powder room, along with a 1.5-car garage. The kitchen includes a large island, walk-in pantry, gas cooktop, quartz countertops, soft-close cabinetry, and a ceramic tile backsplash. Throughout the home, luxury vinyl plank flooring supports a clean, low-maintenance design. Practical upgrades include impact-rated windows, 8-foot interior doors, a tankless water heater, a Smart Home package, and a covered rear patio. Additional exterior and owner-support items include a gas grill rough-in and exterior lawn maintenance.
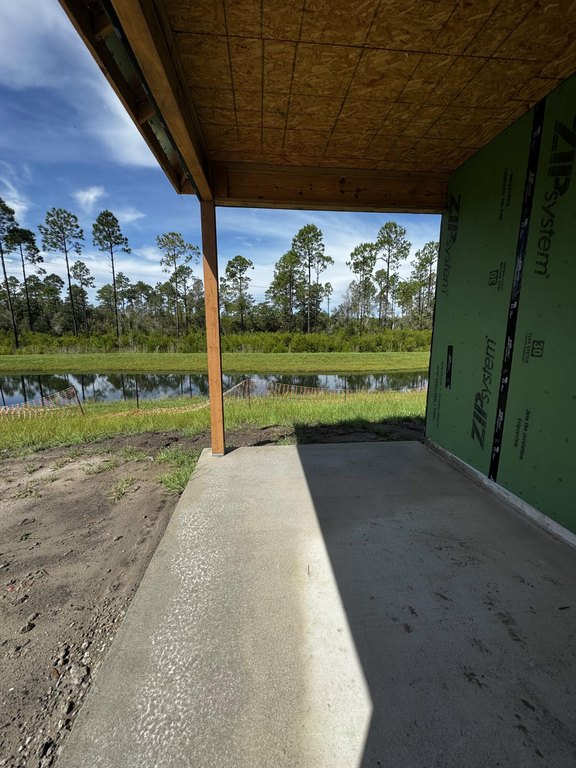
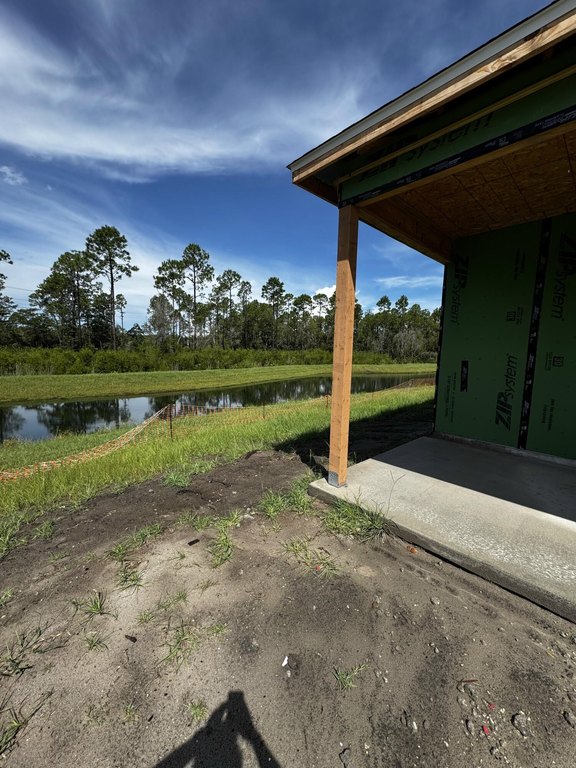
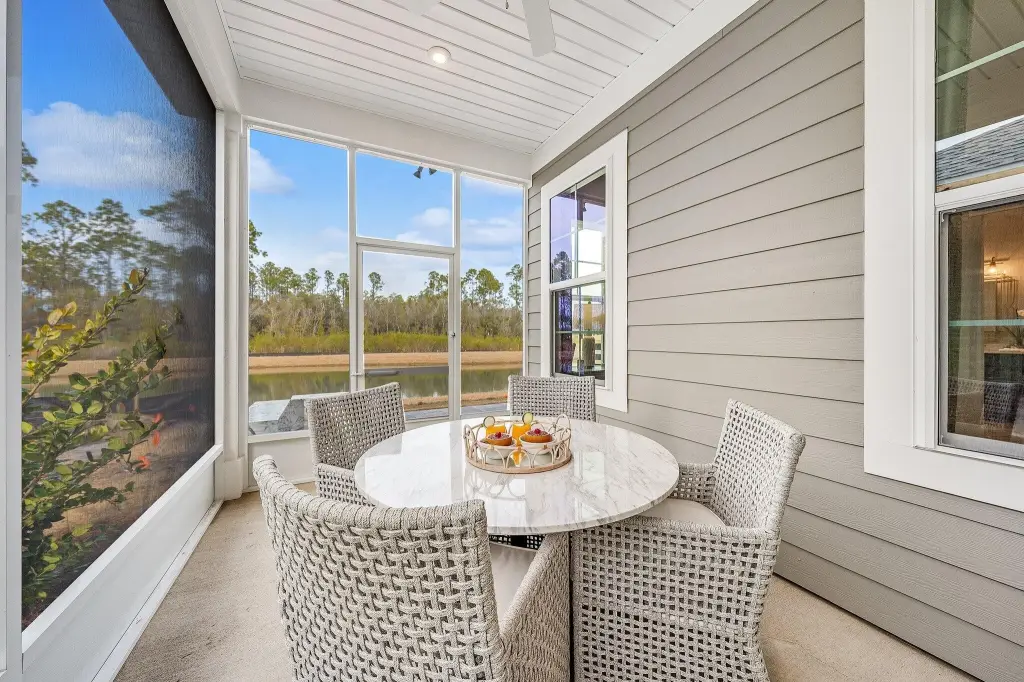
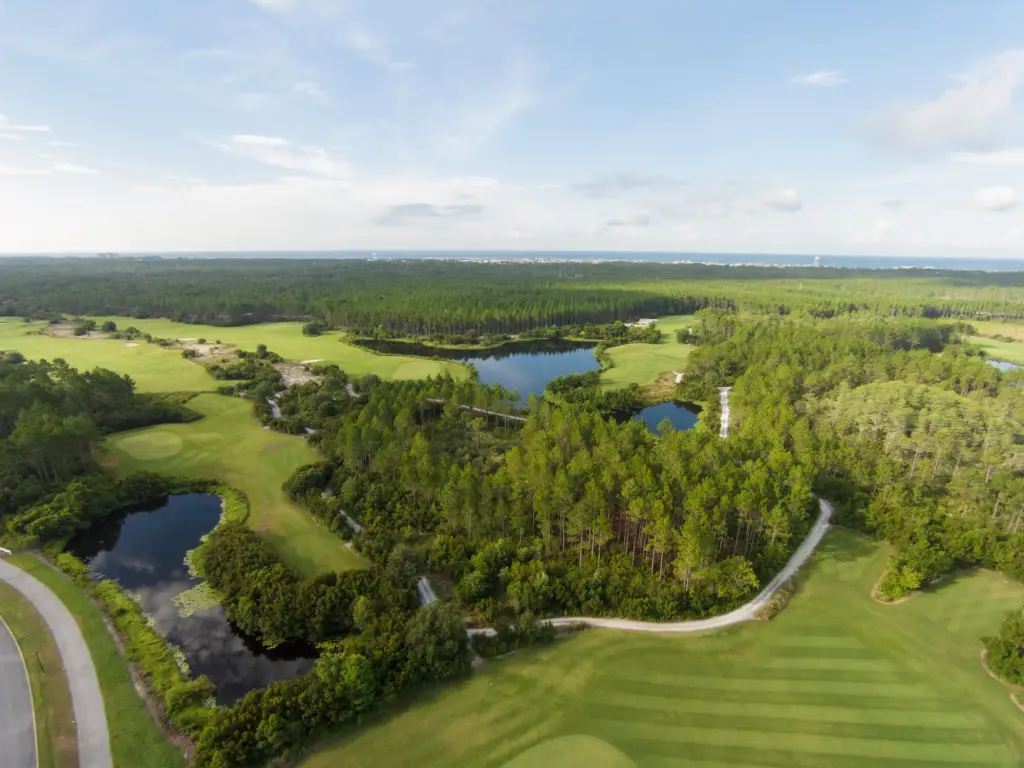
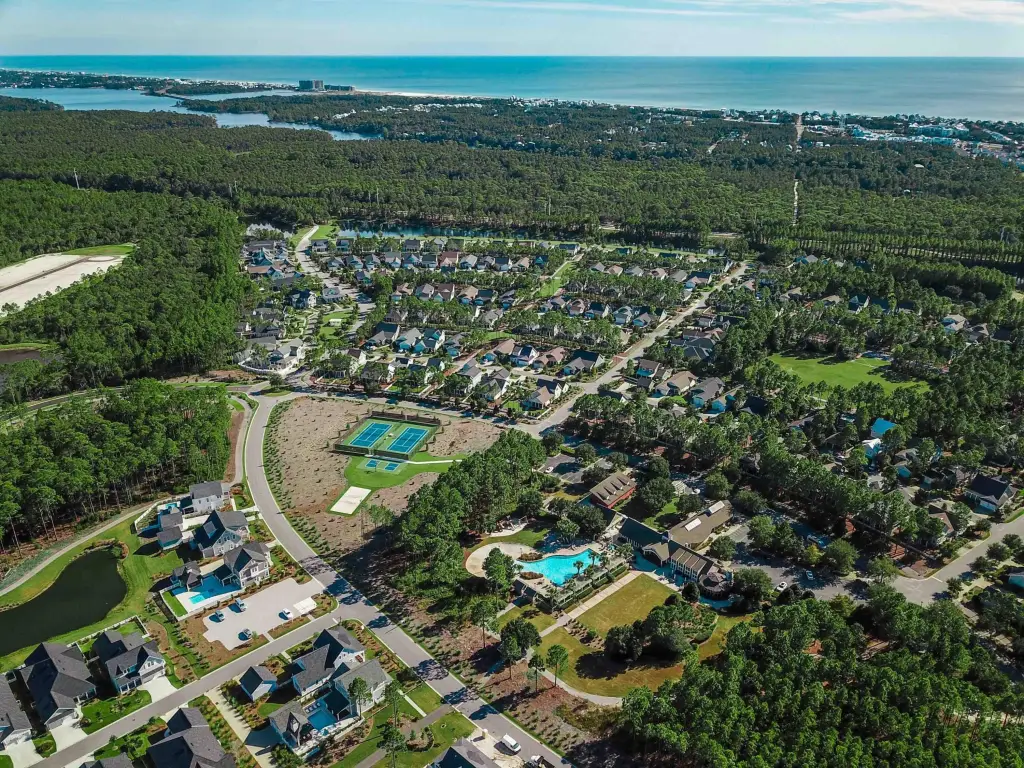
The property is part of the Villas at Longleaf Park within Watersound Origins, with a homesite overlooking a retention pond and wooded backdrop. Estimated completion is November/December 2026. Nearby conveniences include Watersound Town Center, Publix, restaurants, medical offices, and Highway 98, while community amenities include the Origins Golf Course, Village Commons, and walking trails.
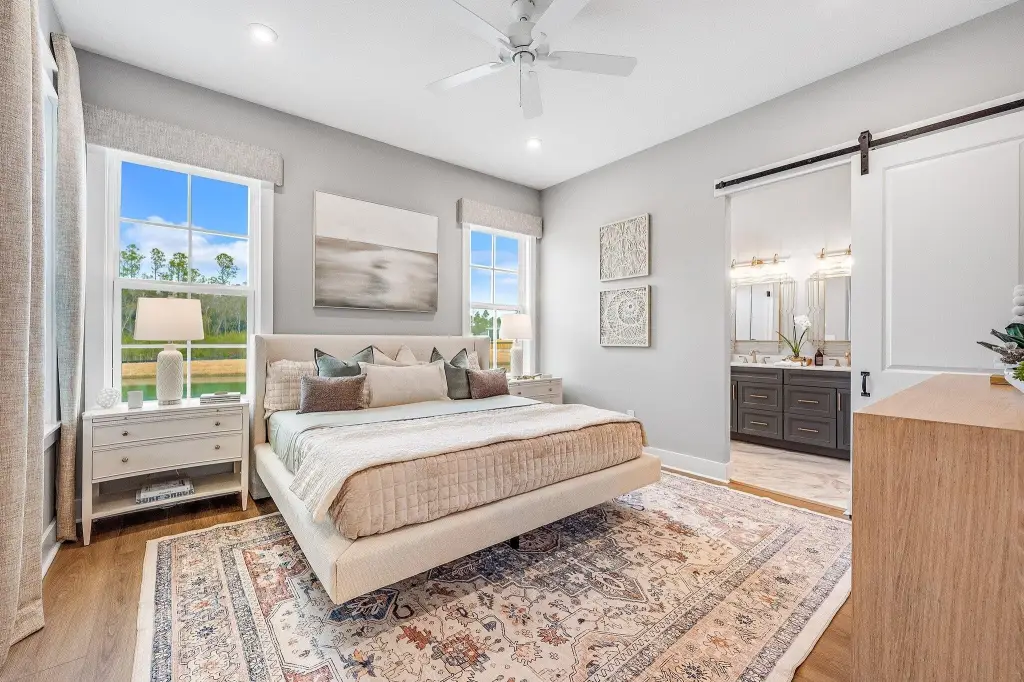
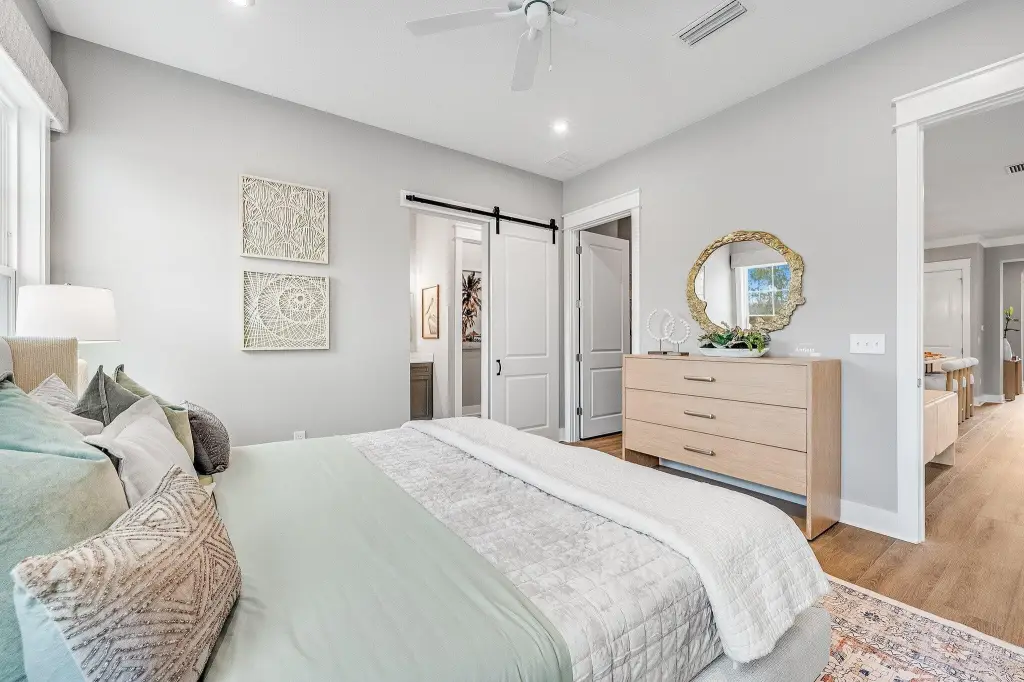
With its open-plan main living area, enclosed primary suite at the rear, and covered patio for outdoor enjoyment, this home is well suited for owner-occupants seeking a low-maintenance finish package and for buyers looking for a residence in the Watersound Origins community. The pond-facing setting and included exterior maintenance add day-to-day convenience, while the Smart Home features and tankless hot water support modern living.
The property is part of the Villas at Longleaf Park within Watersound Origins, with a homesite overlooking a retention pond and wooded backdrop. Estimated completion is November/December 2026. Nearby conveniences include Watersound Town Center, Publix, restaurants, medical offices, and Highway 98, while community amenities include the Origins Golf Course, Village Commons, and walking trails.
With its open-plan main living area, enclosed primary suite at the rear, and covered patio for outdoor enjoyment, this home is well suited for owner-occupants seeking a low-maintenance finish package and for buyers looking for a residence in the Watersound Origins community. The pond-facing setting and included exterior maintenance add day-to-day convenience, while the Smart Home features and tankless hot water support modern living.
Key Highlights
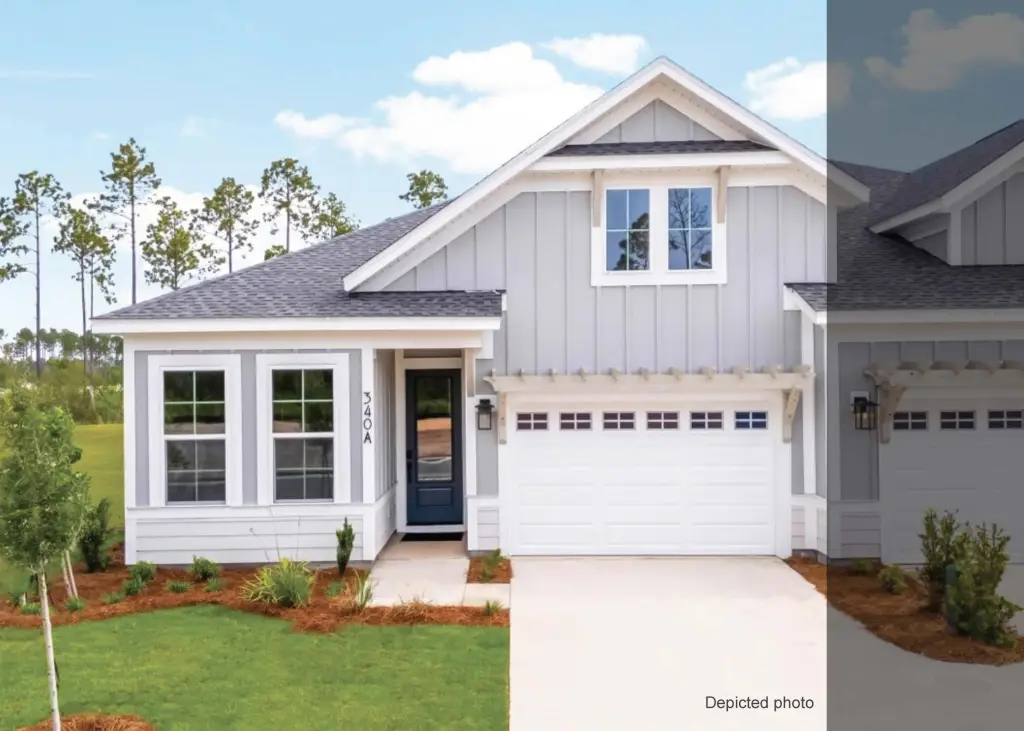
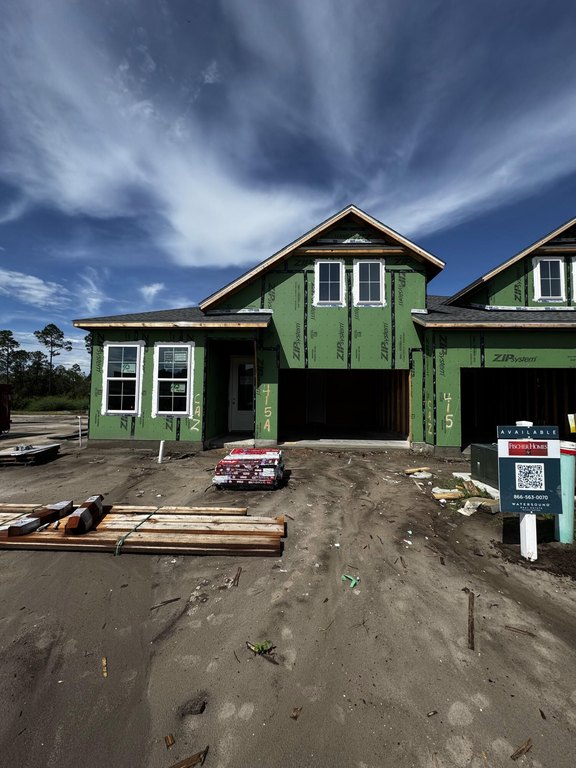
- Anfield plan under construction, scheduled completion November/December 2026
- 1,442 SF home with 2 bedrooms, 2 bathrooms, plus a powder room and 1.5‑car garage
- Open kitchen/dining/family room with 10‑foot ceilings and recessed lighting
Financial Insights
Estimated NOI and Cap Rate
NOI / Yr
$15,970
Cap Rate
3.00%
Suggested Prices Based on Cap Rates
Cap Rate 5%
$319,400
$319.4K
Cap Rate 7%
$228,143
$228.1K
Cap Rate 9%
$177,444
$177.4K
Market Conditions
NOI Build-Up for 1,442 SF
Gross rent
$34.6K $24.00/SF
− Vacancy
−$5.6K −$3.86/SF
EGI
$29.0K $20.14/SF
− OpEx
−$13.1K −$9.06/SF
NOI
$16.0K $11.07/SF
Area
Walton County, FL
Vacancy
16.10%
Lease Rate
$24.00 /SF/Yr
Expense Ratio
45.00%
Simulate Cap Rate and NOI
Suggested Prices Based on Cap Rates
Cap Rate 5%
$319,400
Cap Rate 7%
$228,143
Cap Rate 9%
$177,444
Alternative Uses
Best Use
Apartment 5plus
$228.1K
$199.6K – $266.2K
NOI $15,970 @ 7.0% cap · market cap 3.00%
Second Best
—
—
no second resolved use
Theoretical Best
Office A
$362.6K
$317.3K – $423.1K
NOI $25,385 @ 7.0% cap · market cap 4.76%
Zoning and permitted uses should be independently verified with authorities.
How Realmo checks its estimates
Property Analytics
Unlock full access to Insights
Subscribe to Realmo Intelligence
Open Analytics
Current Use
Lease Details
10 ft
Clear height
Yes
Highway access
Location Intelligence
Trade Area within ½ mile
18
Businesses Nearby
Explore this area
Business Placement
Demographics for 32461, FL
2,878
Population
5,860
Households
0.5
Avg Household Size
52
Median Age
59%
College-Educated
95%
High-School Grad
14.9 sq mi
ZIP Area
193
Density / Sq Mi
$146,393
Median Household Income
$82,620
Median Earnings
$2,665
Median Rent
$947,700
Median Home Value
Check the figures for this property
Cap Rate, Value Estimation, Potential NOI and more
View Realmo Analytics

Frequently Asked Questions
What type of property is this?
Single family property - New construction single-family home with open living space, covered patio, and pond-and-wooded backdrop views.
Where is this single family property located?
The property is located at 415 A Suwannee Drive Watersound, FL.
What is the asking price?
The asking price for this property is $532,987.
What are key features of this property?
This property features: Anfield plan under construction, scheduled completion November/December 2026; 1,442 SF home with 2 bedrooms, 2 bathrooms, plus a powder room and 1.5‑car garage; Open kitchen/dining/family room with 10‑foot ceilings and recessed lighting


