Leased Shopping Center with
For Sale
Contact for pricing
4100 N 2nd St, McAllen, TX 78504
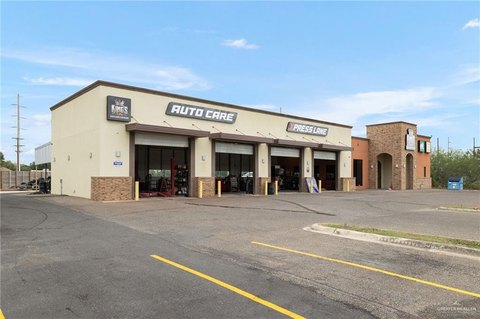
Fully leased shopping center anchored by Mr. Gatti's Pizza with a drive-thru pickup window and shadow-anchored by a Cinermark theater.
Property Size38,145 SF
Price / SF$249.05
Days on Market205
Property Features for 4100 N 2nd St
General Information
Standard status
Active
Size
38,145 SF
Property subtype
Retail
Occupancy
100%
Investment Type
Net Lease
Net Operating Income
$640,969
Building Details
Year Built
1997
Buildings
1
Stories
1
Units
6
Tenancy
Multi
Listing Agency:
Fisher James Capital
Listed By:
Putnam Daily · License #CA 01750064
(510) 289-1166
Source:
Crexi
Added: Apr 1
Changed: Oct 13
Last Checked: Oct 20 at 8:11PM
Displayed information is deemed reliable but is not guaranteed and should be independently verified. All listing content including descriptions, pricing, images are the copyrighted material of Fisher James Capital

Ask AI about this property
Review the available facts, identify missing information and prepare questions for the agent.
Investment Insights
Based on property information with market context.
The Lantana Center is a fully leased shopping center opportunity with a diverse tenant mix and prominent signage. The property is anchored by Mr. Gatti's Pizza and includes a convenient drive-thru pickup window. A 17-screen Cinermark movie theater provides a shadow-anchor effect, supporting additional demand from a major national tenant adjacent to the property, as described in the offering materials.
The center is located at 4100 N 2nd St, McAllen, TX 78504. The property is presented with scheduled rent growth and is supported by dense, growing demographics and residential development activity in the surrounding area. The listing also notes a high concentration of schools within a 5-mile radius, which may contribute to consistent family- and student-driven traffic.
As presented, the asset is offered for sale with a tenant base anchored by quick-service and entertainment uses, combining food and theater draw within the shopping center setting.
The center is located at 4100 N 2nd St, McAllen, TX 78504. The property is presented with scheduled rent growth and is supported by dense, growing demographics and residential development activity in the surrounding area. The listing also notes a high concentration of schools within a 5-mile radius, which may contribute to consistent family- and student-driven traffic.
As presented, the asset is offered for sale with a tenant base anchored by quick-service and entertainment uses, combining food and theater draw within the shopping center setting.
Key Highlights
- Year built 1997 shopping center opportunity listed as fully leased
- Anchored by Mr. Gatti's Pizza with a drive‑thru pickup window
- Shadow‑anchored by a 17‑screen Cinermark movie theater
Financial Insights
Estimated NOI and Cap Rate
NOI / Yr
$544,454
Cap Rate
5.73%
Suggested Prices Based on Cap Rates
Cap Rate 5%
$10,889,080
$10.9M
Cap Rate 7%
$7,777,914
$7.8M
Cap Rate 9%
$6,049,489
$6.0M
Market Conditions
NOI Build-Up for 38,145 SF
Gross rent
$823.9K $21.60/SF
− Vacancy
−$46.1K −$1.21/SF
EGI
$777.8K $20.39/SF
− OpEx
−$233.3K −$6.12/SF
NOI
$544.5K $14.27/SF
Area
McAllen, TX
Vacancy
5.60%
Lease Rate
$21.60 /SF/Yr
Expense Ratio
30.00%
Simulate Cap Rate and NOI
Suggested Prices Based on Cap Rates
Cap Rate 5%
$10,889,080
Cap Rate 7%
$7,777,914
Cap Rate 9%
$6,049,489
Alternative Uses
Best Use
Retail
$7.78M
$6.81M – $9.07M
NOI $544,454 @ 7.0% cap · market cap 5.73%
Second Best
—
—
no second resolved use
Theoretical Best
Office A
$10.36M
$9.06M – $12.08M
NOI $725,060 @ 7.0% cap · market cap 7.63%
Zoning and permitted uses should be independently verified with authorities.
How Realmo checks its estimates
Property Analytics
Contact the owner directly
Get the owner's phone numbers and email
Open Analytics
Current Use
Location Intelligence
Trade Area within ½ mile
1,989
Businesses Nearby
Balanced
Demand for This Use
Explore this area
Business Placement
Demographics for 78504, TX
56,830
Population
21,417
Households
2.7
Avg Household Size
35
Median Age
40%
College-Educated
86%
High-School Grad
19.6 sq mi
ZIP Area
2,899
Density / Sq Mi
$77,627
Median Household Income
$41,632
Median Earnings
$1,178
Median Rent
$203,900
Median Home Value
Check the figures for this property
Cap Rate, Value Estimation, Potential NOI and more
View Realmo Analytics
Market
Vacancy Rate% for Retail in South region



Similar Off Market Nearby
- Coin Cloud Bitcoin ATM — 3010 N 10th St, McAllen, TX 78501
- Mission Restaurant Supply Leasing — 3400 N 10th St, McAllen, TX 78501
- Coin Cloud Bitcoin ATM — 3200 N 10th St, McAllen, TX 78501
- Coinstar Kiosk | Bitcoin ATM — H.E.B., 3200 N 10th St., McAllen, TX 78501
- Cubbies McAllen — 3428 N 10th St suite 100, McAllen, TX 78501
Frequently Asked Questions
What type of property is this?
Shopping center - Fully leased shopping center anchored by Mr. Gatti's Pizza with a drive-thru pickup window and shadow-anchored by a Cinermark theater.
Where is this shopping center located?
The property is located at 4100 N 2nd St McAllen, TX.
What is the asking price?
The asking price for this property is $9,500,000.
What are key features of this property?
This property features: Year built 1997 shopping center opportunity listed as fully leased; Anchored by Mr. Gatti's Pizza with a drive‑thru pickup window; Shadow‑anchored by a 17‑screen Cinermark movie theater


