Office-Retail-Flex
For Sale
$650,000
409 413 N Main St, Eloy, AZ 85131
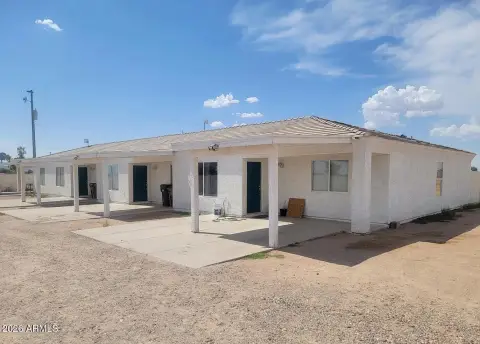
Multi-use office, retail, and flex configuration with HVAC, three-phase power, and double doors connecting two suites.
Property Size7,226 SF
Days on Market238
Property Features for 409 413 N Main St
General Information
Standard status
Active
Size
7,226 SF
Total Parking Spaces
8
Property subtype
Office
Additional Details
Heavy Power
Yes
Building Details
Building Size
7,226 SF
Listing Agency:
Commercial Properties Inc
Listed By:
Toby Campbell · License #SA537130000
(602) 561-2946
Source:
Cpiaz
Added: Feb 25
Changed: Oct 3
Last Checked: Oct 20 at 6:24PM
Displayed information is deemed reliable but is not guaranteed and should be independently verified. All listing content including descriptions, pricing, images are the copyrighted material of Commercial Properties Inc

Ask AI about this property
Review the available facts, identify missing information and prepare questions for the agent.
Investment Insights
Based on property information with market context.
This office, retail, and flex property offers an owner-user opportunity with a multi-suite layout connected by double doors. The building features HVAC cooling and 3-phase power, supporting a range of light commercial and operational needs. Two suites are connected internally, helping streamline workflow and space utilization.
On-site amenities include eight parking spaces in front of the building, with street parking also allowed.
The property is available for sale.
On-site amenities include eight parking spaces in front of the building, with street parking also allowed.
The property is available for sale.
Key Highlights
- Office/retail/flex space offered for sale with 3‑phase power
- HVAC throughout
- 8 front parking spaces for the building; street parking also allowed
Financial Insights
Estimated NOI and Cap Rate
NOI / Yr
$39,499
Cap Rate
6.08%
Suggested Prices Based on Cap Rates
Cap Rate 5%
$789,980
$790.0K
Cap Rate 7%
$564,271
$564.3K
Cap Rate 9%
$438,878
$438.9K
Market Conditions
NOI Build-Up for 7,226 SF
Gross rent
$69.4K $9.60/SF
− Vacancy
−$8.6K −$1.19/SF
EGI
$60.8K $8.41/SF
− OpEx
−$21.3K −$2.94/SF
NOI
$39.5K $5.47/SF
Area
Pinal County, AZ
Vacancy
12.40%
Lease Rate
$9.60 /SF/Yr
Expense Ratio
35.00%
Simulate Cap Rate and NOI
Suggested Prices Based on Cap Rates
Cap Rate 5%
$789,980
Cap Rate 7%
$564,271
Cap Rate 9%
$438,878
Alternative Uses
Best Use
Office B
$1.42M
$1.25M – $1.66M
NOI $99,671 @ 7.0% cap · market cap 15.33%
Second Best
Retail
$1.01M
$886.8K – $1.18M
NOI $70,941 @ 7.0% cap · market cap 10.91%
Theoretical Best
Office A
$2.00M
$1.75M – $2.33M
NOI $139,839 @ 7.0% cap · market cap 21.51%
Zoning and permitted uses should be independently verified with authorities.
How Realmo checks its estimates
Property Analytics
Unlock full access to Insights
Subscribe to Realmo Intelligence
Open Analytics
Current Use
Lease Details
Yes
Heavy power
Location Intelligence
Trade Area within ½ mile
222
Businesses Nearby
Under-served
Demand for This Use
Explore this area
Business Placement
Demographics for 85131, AZ
16,723
Population
5,381
Households
3.1
Avg Household Size
38
Median Age
13%
College-Educated
77%
High-School Grad
306.7 sq mi
ZIP Area
55
Density / Sq Mi
$55,137
Median Household Income
$26,957
Median Earnings
$940
Median Rent
$243,700
Median Home Value
Check the figures for this property
Cap Rate, Value Estimation, Potential NOI and more
View Realmo Analytics
Market
Vacancy Rate% for Office in West region




Similar Off Market Nearby
- crashnerds LLC — 802 N D St, Eloy, AZ 85131
Frequently Asked Questions
What type of property is this?
Flex space - Multi-use office, retail, and flex configuration with HVAC, three-phase power, and double doors connecting two suites.
Where is this flex space located?
The property is located at 409 413 N Main St Eloy, AZ.
What is the asking price?
The asking price for this property is $650,000.
What are key features of this property?
This property features: Office/retail/flex space offered for sale with 3‑phase power; HVAC throughout; 8 front parking spaces for the building; street parking also allowed


