Turn-Key Restaurant Building For
For Sale
$499,000
Pending
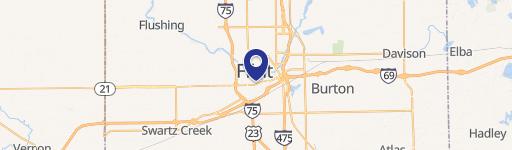
4018 CORUNNA Road, Flint, MI 48532
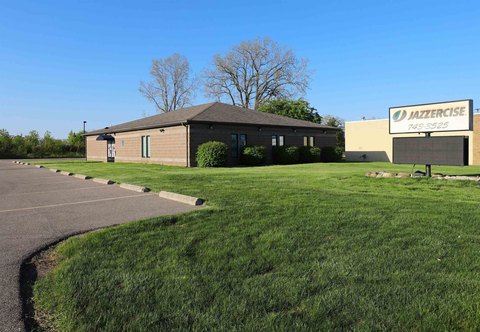
Remodeled restaurant building with high traffic location and ample parking.
Property Size3,500 SF
Lot Size0.68 Acres
Days on Market830
Property Features for 4018 CORUNNA Road
General Information
Standard status
Pending
Size
3,500 SF
Lot size
0.68 Acres
Property subtype
Commercial/Industrial
Taxes and HOA fees
Annual Taxes
$8,600
Building Details
Year Built
1983
Listing Agency:
Keller Williams First
(810) 515-1503
Listed By:
Bahia M Jarrah · License #6501324031
(810) 813-7260
Source:
Exitrealty
Added: Jul 6, 2024
Changed: Sep 1
Last Checked: Sep 15 at 6:30AM
Displayed information is deemed reliable but is not guaranteed and should be independently verified. All listing content including descriptions, pricing, images are the copyrighted material of Keller Williams First
Investment Insights
Based on property information with market context.
This attractive stone and brick building, constructed in 1983 and completely remodeled in 2020, offers 3,500 square feet of space on a 0.68-acre lot. Previously operated as a family-owned restaurant for over 40 years, it features two dining areas, a banquet room, a granite bar, and seating for over 100 patrons. The property benefits from a location on a high-traffic road with 124 feet of frontage and convenient access to I-75, I-69, and US-23. Asphalt parking provides ample space for at least 40 vehicles. The restaurant has a long-standing reputation and a consistent clientele, with a large take-out business.
Key Highlights
- Turnkey restaurant building with established reputation and consistent clientele
- High‑traffic location with 124 ft frontage and easy access to I‑75, I‑69 & US‑23
- Recently remodeled in 2020 with 2 dining areas, banquet room, and granite bar
Financial Insights
Estimated NOI and Cap Rate
NOI / Yr
$31,034
Cap Rate
6.22%
Suggested Prices Based on Cap Rates
Cap Rate 5%
$620,680
$620.7K
Cap Rate 7%
$443,343
$443.3K
Cap Rate 9%
$344,822
$344.8K
Market Conditions
NOI Build-Up for 3,500 SF
Gross rent
$50.4K $14.40/SF
− Vacancy
−$9.0K −$2.58/SF
EGI
$41.4K $11.82/SF
− OpEx
−$10.3K −$2.96/SF
NOI
$31.0K $8.87/SF
Area
Genesee County, MI
Vacancy
17.90%
Lease Rate
$14.40 /SF/Yr
Expense Ratio
25.00%
Simulate Cap Rate and NOI
Suggested Prices Based on Cap Rates
Cap Rate 5%
$620,680
Cap Rate 7%
$443,343
Cap Rate 9%
$344,822
Alternative Uses
Best Use
Specialty Retail
$443.3K
$387.9K – $517.2K
NOI $31,034 @ 7.0% cap · market cap 6.22%
Second Best
—
—
no second resolved use
Theoretical Best
Office A
$736.5K
$644.4K – $859.2K
NOI $51,554 @ 7.0% cap · market cap 10.33%
Zoning and permitted uses should be independently verified with authorities.
How Realmo checks its estimates
Property Analytics
Unlock full access to Insights
Subscribe to Realmo Intelligence
Open Analytics
Current Use
Location Intelligence
Trade Area within ½ mile
336
Businesses Nearby
Under-served
Demand for This Use
Explore this area
Business Placement
Demographics for 48532, MI
19,247
Population
9,093
Households
2.1
Avg Household Size
43
Median Age
19%
College-Educated
88%
High-School Grad
16.0 sq mi
ZIP Area
1,203
Density / Sq Mi
$58,118
Median Household Income
$34,361
Median Earnings
$929
Median Rent
$157,300
Median Home Value
Check the figures for this property
Cap Rate, Value Estimation, Potential NOI and more
View Realmo Analytics
Market
Vacancy Rate% for Retail in Midwest region

Questions? Ask Rey
Realmo’s AI knows this listing — price, zoning, demand, history. Ask anything.






Frequently Asked Questions
What type of property is this?
Conventional restaurant - Remodeled restaurant building with high traffic location and ample parking.
Where is this conventional restaurant located?
The property is located at 4018 CORUNNA Road Flint, MI.
What is the asking price?
The asking price for this property is $499,000.
What are key features of this property?
This property features: Turnkey restaurant building with established reputation and consistent clientele; High‑traffic location with 124 ft frontage and easy access to I‑75, I‑69 & US‑23; Recently remodeled in 2020 with 2 dining areas, banquet room, and granite bar


