Multifamily Property with Six
For Sale
$2,000,000
4010-4016 Illinois Street, San Diego, CA 92104
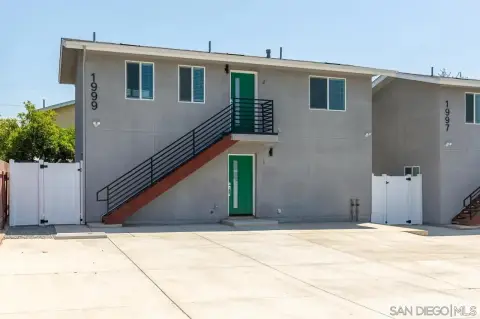
Six-unit multifamily property featuring a detached house and recent upgrades.
Property Size3,590 SF
Price / SF$557.10
Days on Market437
Property Features for 4010-4016 Illinois Street
General Information
Standard status
Active
Size
3,590 SF
Total Parking Spaces
6
Property subtype
Residential Income
Zoning
R-3
Net Operating Income
$96,348
Building Details
Year Built
1945
Buildings
2
Units
6
Listing Agency:
Commercial Asset Advisors
Listed By:
Michael Conger · License #01381193
(858) 344-9413
Source:
Compass
Added: Aug 4, 2025
Changed: Oct 11
Last Checked: Oct 12 at 9:36PM
Displayed information is deemed reliable but is not guaranteed and should be independently verified. All listing content including descriptions, pricing, images are the copyrighted material of Commercial Asset Advisors
Investment Insights
Based on property information with market context.
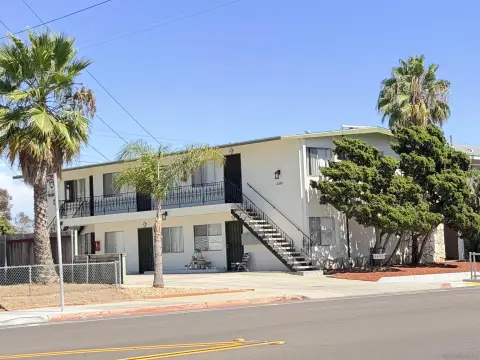
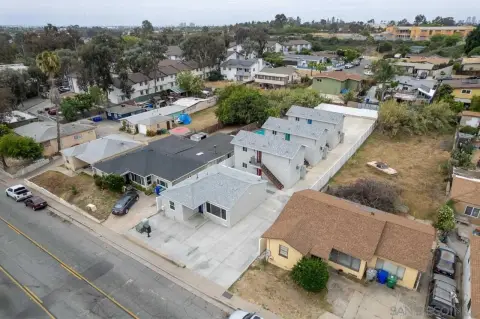
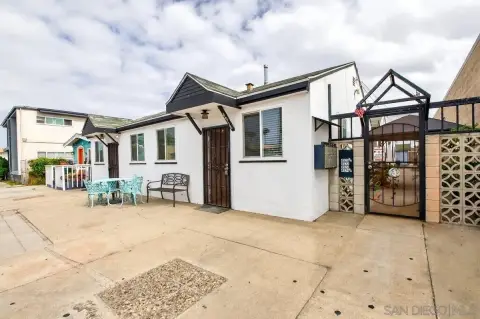
This multifamily property features six units, including four one-bedroom/one-bath units, one larger one-bedroom/one-bath unit with a private balcony, and a detached three-bedroom/one-bath house at the front of the property. Recent improvements include dual-pane windows, partial ABS sewer line upgrades, and new electrical subpanels. The balconies have passed SB-721 inspection requirements. The property also includes two single-car garages, two carport spaces, three storage closets, and an approximately 200 square foot storage shed, offering potential additional storage and parking options.
Key Highlights
- Six‑unit multifamily property with a diverse unit mix, featuring four 1/1 units, one larger 1/1 with balcony, and a detached 3/1 house.
- Recent upgrades include dual‑pane windows, partial ABS sewer line upgrades, and new electrical subpanels.
- Balconies have passed SB‑721 inspection requirements.
Financial Insights
Estimated NOI and Cap Rate
NOI / Yr
$59,336
Cap Rate
2.97%
Suggested Prices Based on Cap Rates
Cap Rate 5%
$1,186,720
$1.2M
Cap Rate 7%
$847,657
$847.7K
Cap Rate 9%
$659,289
$659.3K
Market Conditions
NOI Build-Up for 3,590 SF
Gross rent
$114.2K $31.80/SF
− Vacancy
−$6.3K −$1.75/SF
EGI
$107.9K $30.05/SF
− OpEx
−$48.5K −$13.52/SF
NOI
$59.3K $16.53/SF
Area
San Diego, CA
Vacancy
5.50%
Lease Rate
$31.80 /SF/Yr
Expense Ratio
45.00%
Simulate Cap Rate and NOI
Suggested Prices Based on Cap Rates
Cap Rate 5%
$1,186,720
Cap Rate 7%
$847,657
Cap Rate 9%
$659,289
Alternative Uses
Best Use
Apartment 5plus
$847.7K
$741.7K – $988.9K
NOI $59,336 @ 7.0% cap · market cap 2.97%
Second Best
—
—
no second resolved use
Theoretical Best
Specialty Retail
$1.42M
$1.24M – $1.65M
NOI $99,256 @ 7.0% cap · market cap 4.96%
Zoning and permitted uses should be independently verified with authorities.
How Realmo checks its estimates
Property Analytics
Unlock full access to Insights
Subscribe to Realmo Intelligence
Open Analytics
Current Use
Location Intelligence
Trade Area within ½ mile
2,667
Businesses Nearby
Explore this area
Business Placement
Demographics for 92104, CA
44,265
Population
24,580
Households
1.8
Avg Household Size
36
Median Age
55%
College-Educated
94%
High-School Grad
3.7 sq mi
ZIP Area
11,964
Density / Sq Mi
$92,862
Median Household Income
$60,195
Median Earnings
$1,925
Median Rent
$861,600
Median Home Value
Check the figures for this property
Cap Rate, Value Estimation, Potential NOI and more
View Realmo Analytics
Market
Vacancy Rate% for Multifamily in West region

Questions? Ask Rey
Realmo’s AI knows this listing — price, zoning, demand, history. Ask anything.







Frequently Asked Questions
What type of property is this?
Apartment building - Six-unit multifamily property featuring a detached house and recent upgrades.
Where is this apartment building located?
The property is located at 4010-4016 Illinois Street San Diego, CA.
What is the asking price?
The asking price for this property is $2,000,000.
What are key features of this property?
This property features: Six‑unit multifamily property with a diverse unit mix, featuring four 1/1 units, one larger 1/1 with balcony, and a detached 3/1 house.; Recent upgrades include dual‑pane windows, partial ABS sewer line upgrades, and new electrical subpanels.; Balconies have passed SB‑721 inspection requirements.


