Two-Unit Duplex with Oversized
For Sale
$549,900
3901 S Blvd, Atlantic City, NJ 08401
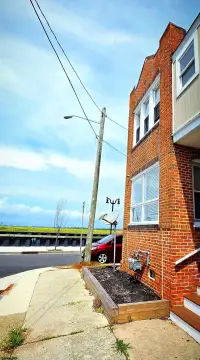
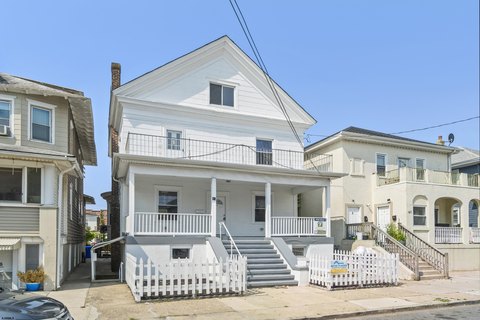
Bay-adjacent duplex with separate electric metering, shared gas service, and a custom stone pergola in the rear yard.
Property Size2,666 SF
Price / SF$206.26
Days on Market69
Property Features for 3901 S Blvd
General Information
Standard status
Active
Size
2,666 SF
Property subtype
Multi-Family
Listing Agency:
Levin Commercial Real Estate, LLC
Listed By:
Ben Kruse
(609) 204-7891
Source:
Choosekruse
Added: Aug 8
Changed: Oct 15
Last Checked: Oct 14 at 11:13PM
Displayed information is deemed reliable but is not guaranteed and should be independently verified. All listing content including descriptions, pricing, images are the copyrighted material of Levin Commercial Real Estate, LLC

Ask AI about this property
Review the available facts, identify missing information and prepare questions for the agent.
Investment Insights
Based on property information with market context.
This two-unit duplex contains a vacant first unit and a second unit with three bedrooms that is currently owner-occupied. The property measures 2,666 square feet and includes an oversized backyard with a custom-built stone pergola. A roof replacement completed one year ago is among the recent improvements.
Each unit has its own electric meter, while gas service is shared. The property is located in Chelsea Heights in Atlantic City, positioned in the second row from the bay and directly across from Wonder Bar. Its address is 3901 S Blvd, Atlantic City, NJ 08401, with casinos, beaches, the Boardwalk, restaurants, entertainment, and marinas identified nearby.
Each unit has its own electric meter, while gas service is shared. The property is located in Chelsea Heights in Atlantic City, positioned in the second row from the bay and directly across from Wonder Bar. Its address is 3901 S Blvd, Atlantic City, NJ 08401, with casinos, beaches, the Boardwalk, restaurants, entertainment, and marinas identified nearby.
Key Highlights
- 2,666‑square‑foot duplex in Atlantic City’s Chelsea Heights neighborhood
- First unit is vacant; second unit has three bedrooms and is owner‑occupied
- Separate electric meters serve the two units; gas service is shared
Financial Insights
Estimated NOI and Cap Rate
NOI / Yr
$30,361
Cap Rate
5.52%
Suggested Prices Based on Cap Rates
Cap Rate 5%
$607,220
$607.2K
Cap Rate 7%
$433,729
$433.7K
Cap Rate 9%
$337,344
$337.3K
Market Conditions
NOI Build-Up for 2,666 SF
Gross rent
$46.4K $17.40/SF
− Vacancy
−$3.0K −$1.13/SF
EGI
$43.4K $16.27/SF
− OpEx
−$13.0K −$4.88/SF
NOI
$30.4K $11.39/SF
Area
Atlantic County, NJ
Vacancy
6.50%
Lease Rate
$17.40 /SF/Yr
Expense Ratio
30.00%
Simulate Cap Rate and NOI
Suggested Prices Based on Cap Rates
Cap Rate 5%
$607,220
Cap Rate 7%
$433,729
Cap Rate 9%
$337,344
Alternative Uses
Best Use
Multifamily LT 5
$433.7K
$379.5K – $506.0K
NOI $30,361 @ 7.0% cap · market cap 5.52%
Second Best
Apartment 5plus
$381.2K
$333.6K – $444.8K
NOI $26,686 @ 7.0% cap · market cap 4.85%
Theoretical Best
Warehouse
$992.8K
$868.7K – $1.16M
NOI $69,496 @ 7.0% cap · market cap 12.64%
Zoning and permitted uses should be independently verified with authorities.
How Realmo checks its estimates
Property Analytics
Current Use
Location Intelligence
Trade Area within ½ mile
2,504
Businesses Nearby
Explore this area
Business Placement
Demographics for 08401, NJ
38,536
Population
20,116
Households
1.9
Avg Household Size
38
Median Age
21%
College-Educated
76%
High-School Grad
10.7 sq mi
ZIP Area
3,601
Density / Sq Mi
$36,375
Median Household Income
$28,915
Median Earnings
$1,086
Median Rent
$189,600
Median Home Value
Market
Vacancy Rate% for Multifamily in Northeast region




Frequently Asked Questions
What type of property is this?
Duplex - Bay-adjacent duplex with separate electric metering, shared gas service, and a custom stone pergola in the rear yard.
Where is this duplex located?
The property is located at 3901 S Blvd Atlantic City, NJ.
What is the asking price?
The asking price for this property is $549,900.
What are key features of this property?
This property features: 2,666‑square‑foot duplex in Atlantic City’s Chelsea Heights neighborhood; First unit is vacant; second unit has three bedrooms and is owner‑occupied; Separate electric meters serve the two units; gas service is shared


