Mixed-Use Redevelopment
For Sale
$1,499,999
387 Nys Rt 9n church Street, Saratoga Springs, NY 12866
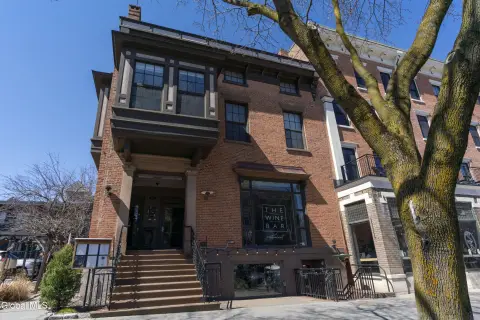
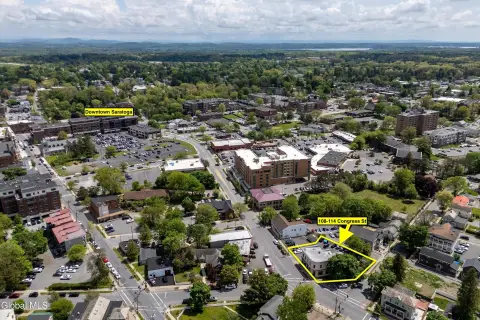
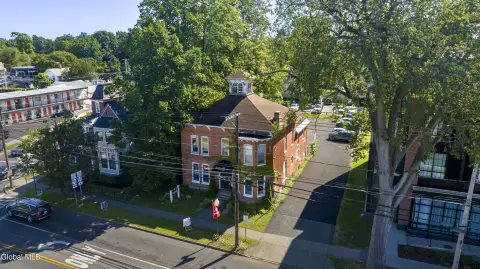
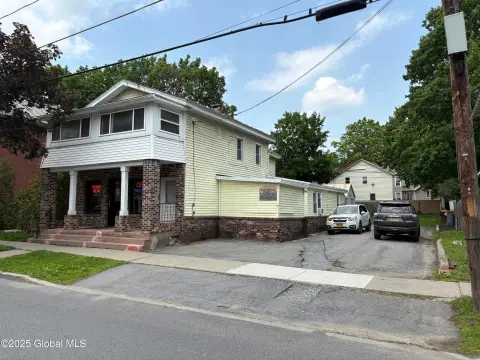
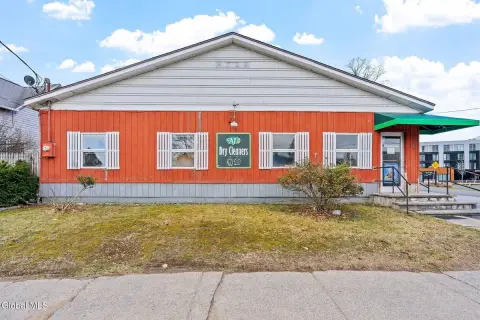
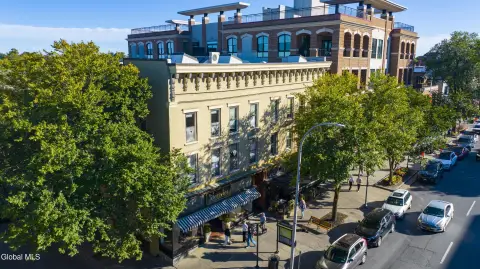
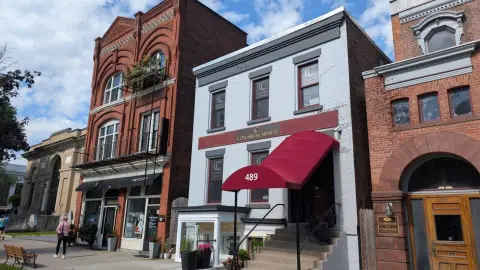
Redevelopment along a major city entrance with as-is structures and potential for additional road frontage.
Property Size7,326 SF
Price / SF$204.75
Days on Market155
Property Features for 387 Nys Rt 9n church Street
General Information
Standard status
Active
Size
7,326 SF
Property subtype
Commercial
Building Details
Year Built
1945
Listing Agency:
Kelleher Realty LLC
Listed By:
Rachel Magnell · License #10401398070
(518) 928-0093
Source:
Signatureonerealtygroup
Added: May 8
Changed: Oct 7
Last Checked: Oct 7 at 1:11PM
Displayed information is deemed reliable but is not guaranteed and should be independently verified. All listing content including descriptions, pricing, images are the copyrighted material of Kelleher Realty LLC
Investment Insights
Based on property information with market context.
This mixed-use redevelopment opportunity at 387 Church St, Saratoga Springs, NY is positioned for a new chapter. The property consists of existing structures being sold as-is, and the buyer will be responsible for conducting all due diligence related to zoning, permits, municipal approvals, and redevelopment requirements.
The site is described as highly visible and located along a major entrance into the city. The offering also notes the potential for an additional 137 ft of road frontage, subject to approvals and redevelopment planning.
As presented, the property is best suited for buyers and developers who want to evaluate redevelopment scenarios based on their own feasibility work, including how the existing improvements may be incorporated into a future mixed-use plan.
The site is described as highly visible and located along a major entrance into the city. The offering also notes the potential for an additional 137 ft of road frontage, subject to approvals and redevelopment planning.
As presented, the property is best suited for buyers and developers who want to evaluate redevelopment scenarios based on their own feasibility work, including how the existing improvements may be incorporated into a future mixed-use plan.
Key Highlights
- Redevelopment opportunity along a major entrance into Saratoga Springs
- Highly visible gateway property suited for commercial, medical, hospitality, mixed‑use, or residential redevelopment
- Potential for additional 137 ft of road frontage
Financial Insights
Estimated NOI and Cap Rate
NOI / Yr
$89,011
Cap Rate
5.93%
Suggested Prices Based on Cap Rates
Cap Rate 5%
$1,780,220
$1.8M
Cap Rate 7%
$1,271,586
$1.3M
Cap Rate 9%
$989,011
$989.0K
Market Conditions
NOI Build-Up for 7,326 SF
Gross rent
$158.2K $21.60/SF
− Vacancy
−$15.8K −$2.16/SF
EGI
$142.4K $19.44/SF
− OpEx
−$53.4K −$7.29/SF
NOI
$89.0K $12.15/SF
Area
Saratoga County, NY
Vacancy
10.00%
Lease Rate
$21.60 /SF/Yr
Expense Ratio
37.50%
Simulate Cap Rate and NOI
Suggested Prices Based on Cap Rates
Cap Rate 5%
$1,780,220
Cap Rate 7%
$1,271,586
Cap Rate 9%
$989,011
Alternative Uses
Best Use
Mixed Use
$1.27M
$1.11M – $1.48M
NOI $89,011 @ 7.0% cap · market cap 5.93%
Second Best
—
—
no second resolved use
Theoretical Best
Office A
$2.19M
$1.92M – $2.56M
NOI $153,494 @ 7.0% cap · market cap 10.23%
Zoning and permitted uses should be independently verified with authorities.
Property Analytics
Current Use
Location Intelligence
Trade Area within ½ mile
320
Businesses Nearby
Explore this area
Business Placement
Demographics for 12866, NY
40,355
Population
20,462
Households
2
Avg Household Size
44
Median Age
55%
College-Educated
95%
High-School Grad
64.3 sq mi
ZIP Area
628
Density / Sq Mi
$98,374
Median Household Income
$53,265
Median Earnings
$1,460
Median Rent
$419,200
Median Home Value

Questions? Ask Rey
Realmo’s AI knows this listing — price, zoning, demand, history. Ask anything.



Frequently Asked Questions
What type of property is this?
Mixed-use property - Redevelopment along a major city entrance with as-is structures and potential for additional road frontage.
Where is this mixed-use property located?
The property is located at 387 Nys Rt 9n church Street Saratoga Springs, NY.
What is the asking price?
The asking price for this property is $1,499,999.
What are key features of this property?
This property features: Redevelopment opportunity along a major entrance into Saratoga Springs; Highly visible gateway property suited for commercial, medical, hospitality, mixed‑use, or residential redevelopment; Potential for additional 137 ft of road frontage


