Seven-Unit Multifamily with
For Sale
$3,295,000
Pending
3735 Anza Street, San Francisco, CA 94121
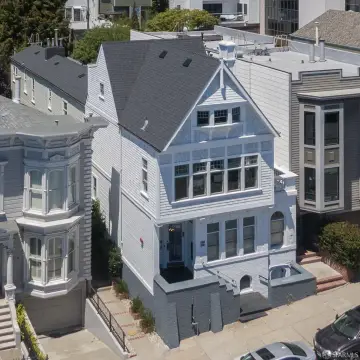
Built in 1927 with six occupied units, a vacant remodeled penthouse, and a large vacant 4+ car garage.
Property Size5,640 SF
Days on Market99
Property Features for 3735 Anza Street
General Information
Standard status
Pending
Size
5,640 SF
Property subtype
Multi Family
Building Details
Building Size
5,640 SF
Year Built
1927
Listing Agency:
Compass
Listed By:
Allison Chapleau · License #01369080
(415) 321-7000
Source:
Paytonslist
Added: Jul 13
Changed: Oct 10
Last Checked: Oct 16 at 4:12PM
Displayed information is deemed reliable but is not guaranteed and should be independently verified. All listing content including descriptions, pricing, images are the copyrighted material of Compass

Ask AI about this property
Review the available facts, identify missing information and prepare questions for the agent.
Investment Insights
Based on property information with market context.
3735 Anza Street is a seven-unit multifamily property built in 1927. The building has been thoughtfully maintained with recent and substantial upgrades, including a new roof (2025), a completed soft-story seismic retrofit (2019), an upgraded fire alarm system, and fresh exterior paint. There is a vacant, fully remodeled top-floor penthouse residence with approximately 9 bedrooms and 3 bathrooms, hardwood flooring, abundant natural light, premium kitchen finishes with stainless steel appliances, and expansive picture windows framing panoramic views of the Golden Gate Bridge, Presidio, and the San Francisco skyline. The property also includes a large vacant 4+ car garage for flexible use, and residents have access to a shared on-site laundry room.
Six units are currently occupied, providing consistent in-place income.
Six units are currently occupied, providing consistent in-place income.
Key Highlights
- Built in 1927 seven‑unit building with six occupied units providing consistent in‑place income
- 2019 completed soft‑story seismic retrofit and upgraded fire alarm system
- New roof installed in 2025 plus fresh exterior paint
Financial Insights
Estimated NOI and Cap Rate
NOI / Yr
$183,114
Cap Rate
5.56%
Suggested Prices Based on Cap Rates
Cap Rate 5%
$3,662,280
$3.7M
Cap Rate 7%
$2,615,914
$2.6M
Cap Rate 9%
$2,034,600
$2.0M
Market Conditions
NOI Build-Up for 5,640 SF
Gross rent
$355.3K $63.00/SF
− Vacancy
−$22.4K −$3.97/SF
EGI
$332.9K $59.03/SF
− OpEx
−$149.8K −$26.56/SF
NOI
$183.1K $32.47/SF
Area
San Francisco, CA
Vacancy
6.30%
Lease Rate
$63.00 /SF/Yr
Expense Ratio
45.00%
Simulate Cap Rate and NOI
Suggested Prices Based on Cap Rates
Cap Rate 5%
$3,662,280
Cap Rate 7%
$2,615,914
Cap Rate 9%
$2,034,600
Alternative Uses
Best Use
Apartment 5plus
$2.62M
$2.29M – $3.05M
NOI $183,114 @ 7.0% cap · market cap 5.56%
Second Best
—
—
no second resolved use
Theoretical Best
Specialty Retail
$27.55M
$24.11M – $32.14M
NOI $1,928,436 @ 7.0% cap · market cap 58.53%
Zoning and permitted uses should be independently verified with authorities.
How Realmo checks its estimates
Property Analytics
Unlock full access to Insights
Subscribe to Realmo Intelligence
Open Analytics
Location Intelligence
Trade Area within ½ mile
1,732
Businesses Nearby
Explore this area
Business Placement
Demographics for 94121, CA
43,115
Population
19,742
Households
2.2
Avg Household Size
42
Median Age
64%
College-Educated
92%
High-School Grad
2.5 sq mi
ZIP Area
17,246
Density / Sq Mi
$138,353
Median Household Income
$74,646
Median Earnings
$2,327
Median Rent
$1,634,600
Median Home Value
Check the figures for this property
Cap Rate, Value Estimation, Potential NOI and more
View Realmo Analytics
Market
Vacancy Rate% for Multifamily in West region




Frequently Asked Questions
What type of property is this?
Apartment building - Built in 1927 with six occupied units, a vacant remodeled penthouse, and a large vacant 4+ car garage.
Where is this apartment building located?
The property is located at 3735 Anza Street San Francisco, CA.
What is the asking price?
The asking price for this property is $3,295,000.
What are key features of this property?
This property features: Built in 1927 seven‑unit building with six occupied units providing consistent in‑place income; 2019 completed soft‑story seismic retrofit and upgraded fire alarm system; New roof installed in 2025 plus fresh exterior paint


