Leased Retail Strip
For Sale
$1,085,000
3601 3603 & 3605 High Street, Portsmouth, VA 23707
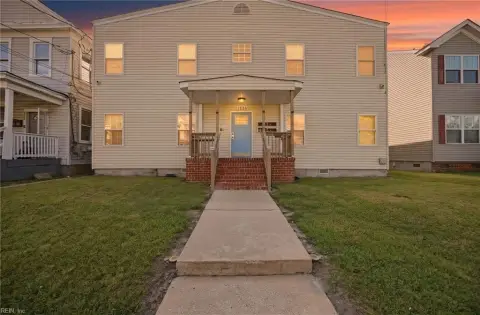
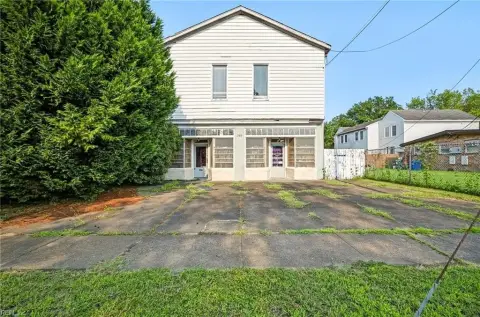
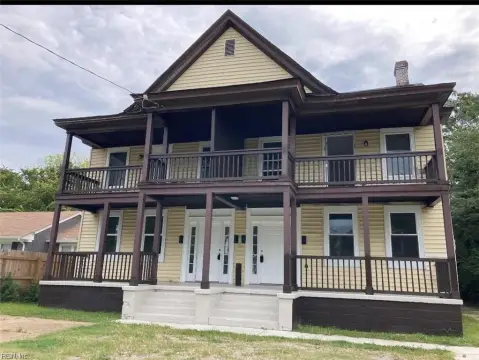
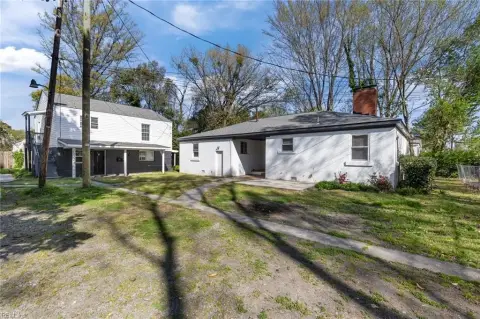
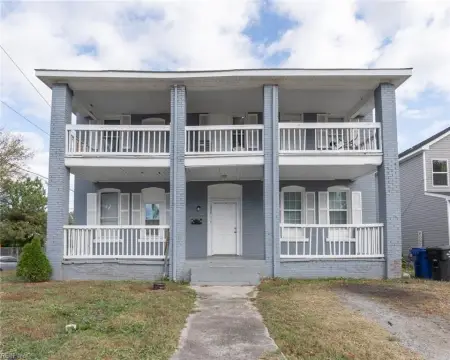
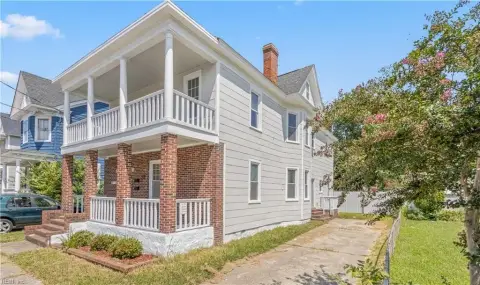
Fully leased retail strip center in Portsmouth, Virginia.
Property Size5,043 SF
Lot Size0.44 Acres
Price / SF$215.15
Days on Market215
Property Features for 3601 3603 & 3605 High Street
General Information
Standard status
Active
Size
5,043 SF
Lot size
0.44 Acres
Property subtype
Retail
Building Details
Building Size
5,043 SF
Year Built
1961
Listing Agency:
S.L. Nusbaum Realty Co - Corporate
Listed By:
Martin Murden
(757) 333-1523
Source:
Slnusbaum
Added: Mar 6
Changed: Sep 18
Last Checked: Oct 5 at 5:42PM
Displayed information is deemed reliable but is not guaranteed and should be independently verified. All listing content including descriptions, pricing, images are the copyrighted material of S.L. Nusbaum Realty Co - Corporate
Investment Insights
Based on property information with market context.
The property at 3601, 3603 & 3605 High Street is a fully leased, three-tenant neighborhood retail strip center located in the Mid-City submarket of Portsmouth, VA. The building has 5,043 square feet and features a mix of tenants. The property is situated at the signalized corner of High Street, near I-264 and national retailers including Chick-fil-A, Walmart Supercenter, Kroger, T.J. Maxx, and Starbucks. The property is on approximately 0.44 acres of land. Co-tenants include a restaurant, a tobacco/vape shop, and Portsmouth Cleaners, which has been at this location since 1998. The building features pylon signage for exposure along High Street. The submarket includes Bon Secours Maryview Medical Center and proximity to the U.S. Coast Guard Base and Norfolk Naval Shipyard. The location is near the intersection of High Street, which has 24,000 vehicles per day.
Key Highlights
- 100% leased retail center providing immediate income.
- Strategic location on highly trafficked High Street (24,000 vehicles per day) at a signalized corner.
- Proximity to I‑264 and national retailers.
Financial Insights
Estimated NOI and Cap Rate
NOI / Yr
$66,541
Cap Rate
6.13%
Suggested Prices Based on Cap Rates
Cap Rate 5%
$1,330,820
$1.3M
Cap Rate 7%
$950,586
$950.6K
Cap Rate 9%
$739,344
$739.3K
Market Conditions
NOI Build-Up for 5,043 SF
Gross rent
$99.9K $19.80/SF
− Vacancy
−$4.8K −$0.95/SF
EGI
$95.1K $18.85/SF
− OpEx
−$28.5K −$5.65/SF
NOI
$66.5K $13.19/SF
Area
Portsmouth County, VA
Vacancy
4.80%
Lease Rate
$19.80 /SF/Yr
Expense Ratio
30.00%
Simulate Cap Rate and NOI
Suggested Prices Based on Cap Rates
Cap Rate 5%
$1,330,820
Cap Rate 7%
$950,586
Cap Rate 9%
$739,344
Alternative Uses
Best Use
Retail
$950.6K
$831.8K – $1.11M
NOI $66,541 @ 7.0% cap · market cap 6.13%
Second Best
—
—
no second resolved use
Theoretical Best
Office A
$1.61M
$1.40M – $1.87M
NOI $112,385 @ 7.0% cap · market cap 10.36%
Zoning and permitted uses should be independently verified with authorities.
Property Analytics
Unlock full access to Insights
Subscribe to Realmo Intelligence
Open Analytics
Current Use
Location Intelligence
Trade Area within ½ mile
867
Businesses Nearby
Explore this area
Business Placement
Demographics for 23707, VA
14,316
Population
7,216
Households
2
Avg Household Size
36
Median Age
26%
College-Educated
87%
High-School Grad
3.9 sq mi
ZIP Area
3,671
Density / Sq Mi
$51,070
Median Household Income
$37,932
Median Earnings
$1,076
Median Rent
$222,100
Median Home Value
Check the figures for this property
Cap Rate, Value Estimation, Potential NOI and more
View Realmo Analytics
Market
Vacancy Rate% for Retail in South region

Questions? Ask Rey
Realmo’s AI knows this listing — price, zoning, demand, history. Ask anything.





Frequently Asked Questions
What type of property is this?
Strip mall - Fully leased retail strip center in Portsmouth, Virginia.
Where is this strip mall located?
The property is located at 3601 3603 & 3605 High Street Portsmouth, VA.
What is the asking price?
The asking price for this property is $1,085,000.
What are key features of this property?
This property features: 100% leased retail center providing immediate income.; Strategic location on highly trafficked High Street (24,000 vehicles per day) at a signalized corner.; Proximity to I‑264 and national retailers.