Shadow-Anchored Grocery Retail
For Sale
Contact for pricing
3562 South Soncy Road, Amarillo, TX 79119
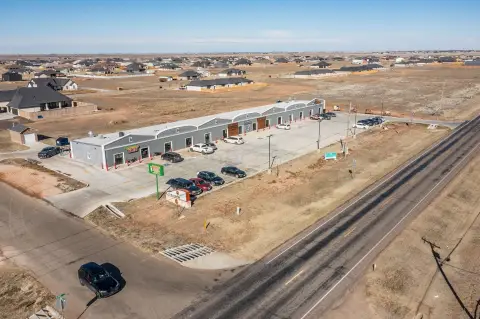
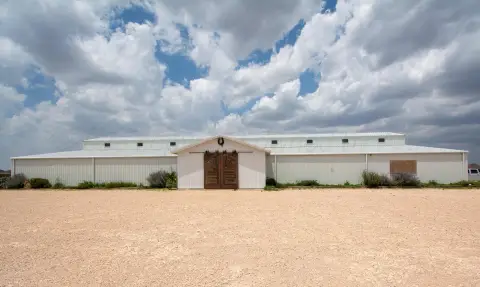
Retail strip center with a grocery shadow anchor, offering a neighborhood-style tenant environment.
Property Size22,329 SF
Price / SF$357.98
Days on Market126
Property Features for 3562 South Soncy Road
General Information
Standard status
Active
Size
22,329 SF
Property subtype
Retail
Zoning
General Retail (GR)
Occupancy
91%
Lease Type
NNN
Investment Type
Stabilized
Net Operating Income
$519,562
Additional Details
Cap Rate
6.5%
Building Details
Year Built
2014
Buildings
1
Units
10
Tenancy
Multi
Listing Agency:
Venture Commercial
Listed By:
John Zikos · License #TX 375018
(214) 378-1212
Source:
Crexi
Added: Jun 11
Changed: Sep 30
Last Checked: Oct 12 at 7:36PM
Displayed information is deemed reliable but is not guaranteed and should be independently verified. All listing content including descriptions, pricing, images are the copyrighted material of Venture Commercial
Investment Insights
Based on property information with market context.
Soncy Market Strip Center is a for-sale retail property configured as a strip center, positioned within the grocery and convenience retail category. The asset is described as grocery shadow-anchored, meaning the tenant mix is supported by the draw of nearby grocery traffic rather than a dedicated inline anchor within the center itself.
Located at 3562 South Soncy Road in Amarillo, Texas (79119), the center benefits from direct access to a main commercial corridor serving surrounding retail needs. Its grocery-adjacent positioning is intended to capture routine, everyday shopping patterns associated with convenience and neighborhood retail.
For investors and operators seeking a grocery-influenced retail format, this strip center offers a straightforward platform aligned with day-to-day consumer traffic. Prospective tenants should consider the property’s fit for retail uses that rely on frequent customer visits and a shopping environment where grocery proximity can support consistent footfall. Buyers evaluating the asset should review the current tenant configuration and lease terms to confirm operational alignment and the specific in-center merchandising plan.
Located at 3562 South Soncy Road in Amarillo, Texas (79119), the center benefits from direct access to a main commercial corridor serving surrounding retail needs. Its grocery-adjacent positioning is intended to capture routine, everyday shopping patterns associated with convenience and neighborhood retail.
For investors and operators seeking a grocery-influenced retail format, this strip center offers a straightforward platform aligned with day-to-day consumer traffic. Prospective tenants should consider the property’s fit for retail uses that rely on frequent customer visits and a shopping environment where grocery proximity can support consistent footfall. Buyers evaluating the asset should review the current tenant configuration and lease terms to confirm operational alignment and the specific in-center merchandising plan.
Key Highlights
- Retail strip center built in 2014
- 6.50% cap rate mentioned in the listing
- Grocery shadow‑anchored market strip center
Property Analytics
Unlock full access to Insights
Subscribe to Realmo Intelligence
Open Analytics
Current Use
Location Intelligence
Trade Area within ½ mile
638
Businesses Nearby
Explore this area
Business Placement
Demographics for 79119, TX
21,147
Population
9,839
Households
2.1
Avg Household Size
37
Median Age
44%
College-Educated
97%
High-School Grad
99.5 sq mi
ZIP Area
213
Density / Sq Mi
$100,546
Median Household Income
$63,728
Median Earnings
$1,217
Median Rent
$335,700
Median Home Value
Check the figures for this property
Cap Rate, Value Estimation, Potential NOI and more
View Realmo Analytics
Market
Vacancy Rate% for Retail in South region

Questions? Ask Rey
Realmo’s AI knows this listing — price, zoning, demand, history. Ask anything.






Frequently Asked Questions
What type of property is this?
Strip mall - Retail strip center with a grocery shadow anchor, offering a neighborhood-style tenant environment.
Where is this strip mall located?
The property is located at 3562 South Soncy Road Amarillo, TX.
What is the asking price?
The asking price for this property is $7,993,262.
What are key features of this property?
This property features: Retail strip center built in 2014; 6.50% cap rate mentioned in the listing; Grocery shadow‑anchored market strip center


