Turn-Key Five-Unit Apartment
For Sale
$1,550,000
356 Union Street, Hudson, NY 12534
Five renovated apartments with in-unit laundry, including four one-bed units and a two-bedroom penthouse, plus approved rear development plans.
Property Size7,257 SF
Days on Market129
Property Features for 356 Union Street
General Information
Standard status
Active
Size
7,257 SF
Property subtype
Multi Family
Additional Details
Multifamily Units
5
Taxes and HOA fees
Annual Taxes
$16,877
Amenities
in-unit laundry
Building Details
Building Size
7,257 SF
Year Built
1900
Year Renovated
2020
Construction
Second Empire
Tenancy
Multi
Listing Agency:
Compass Greater NY LLC
Listed By:
Sean Roland · License #10401340960
(518) 755-4574
Source:
C21newwest
Added: Jun 19
Changed: Oct 17
Last Checked: Oct 23 at 1:17PM
Displayed information is deemed reliable but is not guaranteed and should be independently verified. All listing content including descriptions, pricing, images are the copyrighted material of Compass Greater NY LLC

Ask AI about this property
Review the available facts, identify missing information and prepare questions for the agent.
Investment Insights
Based on property information with market context.
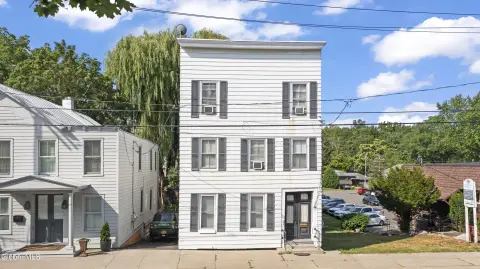
This turn-key five-unit apartment building is a Second Empire manse that was fully restored through a complete gut renovation in 2020. The property consists of four one-bedroom apartments and a two-bedroom penthouse unit. Each apartment includes open-plan living spaces, one full and one half bathroom, in-unit laundry, and contemporary finishes such as hardwood floors, new windows, and stainless appliances while retaining the building’s historic character.
The building is located at 356 Union Street in Hudson, New York, positioned across from the historic Courthouse Square and about one block from the restaurants, galleries, and shops on Warren Street.
At the rear, a historic carriage house provides additional upside potential with approved plans for further development. Renovation work has already begun, with foundation and framing improvements completed, and the approved plans allow for the creation of two additional apartments, subject to the approved development scope. An income and expense report is available to qualified purchasers.
The building is located at 356 Union Street in Hudson, New York, positioned across from the historic Courthouse Square and about one block from the restaurants, galleries, and shops on Warren Street.
At the rear, a historic carriage house provides additional upside potential with approved plans for further development. Renovation work has already begun, with foundation and framing improvements completed, and the approved plans allow for the creation of two additional apartments, subject to the approved development scope. An income and expense report is available to qualified purchasers.
Key Highlights
- Five‑unit Second Empire investment property built in 1900 on Hudson’s Union Street, across from Courthouse Square
- Complete gut renovation completed in 2020; upgrades include new windows and contemporary finishes with stainless appliances and hardwood floors
- Unit mix: four 1‑bedroom apartments plus a 2‑bedroom penthouse; each unit has 1 full and 1 half bathroom and in‑unit laundry
Financial Insights
Estimated NOI and Cap Rate
NOI / Yr
$68,252
Cap Rate
4.40%
Suggested Prices Based on Cap Rates
Cap Rate 5%
$1,365,040
$1.4M
Cap Rate 7%
$975,029
$975.0K
Cap Rate 9%
$758,356
$758.4K
Market Conditions
NOI Build-Up for 7,257 SF
Gross rent
$130.6K $18.00/SF
− Vacancy
−$6.5K −$0.90/SF
EGI
$124.1K $17.10/SF
− OpEx
−$55.8K −$7.69/SF
NOI
$68.3K $9.41/SF
Area
Columbia County, NY
Vacancy
5.00%
Lease Rate
$18.00 /SF/Yr
Expense Ratio
45.00%
Simulate Cap Rate and NOI
Suggested Prices Based on Cap Rates
Cap Rate 5%
$1,365,040
Cap Rate 7%
$975,029
Cap Rate 9%
$758,356
Alternative Uses
Best Use
Apartment 5plus
$975.0K
$853.2K – $1.14M
NOI $68,252 @ 7.0% cap · market cap 4.40%
Second Best
—
—
no second resolved use
Theoretical Best
Office A
$1.80M
$1.57M – $2.09M
NOI $125,680 @ 7.0% cap · market cap 8.11%
Zoning and permitted uses should be independently verified with authorities.
How Realmo checks its estimates
Property Analytics
Unlock full access to Insights
Subscribe to Realmo Intelligence
Open Analytics
Lease Details
5
Residential units
Multi-tenant
Tenancy
Location Intelligence
Trade Area within ½ mile
1,154
Businesses Nearby
Explore this area
Business Placement
Demographics for 12534, NY
17,539
Population
9,613
Households
1.8
Avg Household Size
46
Median Age
33%
College-Educated
88%
High-School Grad
88.6 sq mi
ZIP Area
198
Density / Sq Mi
$76,086
Median Household Income
$40,823
Median Earnings
$1,296
Median Rent
$260,800
Median Home Value
Check the figures for this property
Cap Rate, Value Estimation, Potential NOI and more
View Realmo Analytics
Market
Vacancy Rate% for Multifamily in Northeast region






Frequently Asked Questions
What type of property is this?
Apartment building - Five renovated apartments with in-unit laundry, including four one-bed units and a two-bedroom penthouse, plus approved rear development plans.
Where is this apartment building located?
The property is located at 356 Union Street Hudson, NY.
What is the asking price?
The asking price for this property is $1,550,000.
What are key features of this property?
This property features: Five‑unit Second Empire investment property built in 1900 on Hudson’s Union Street, across from Courthouse Square; Complete gut renovation completed in 2020; upgrades include new windows and contemporary finishes with stainless appliances and hardwood floors; Unit mix: four 1‑bedroom apartments plus a 2‑bedroom penthouse; each unit has 1 full and 1 half bathroom and in‑unit laundry


