Live-Work and Retail
For Sale
$995,000
514 Warren Street, Hudson, NY 12534
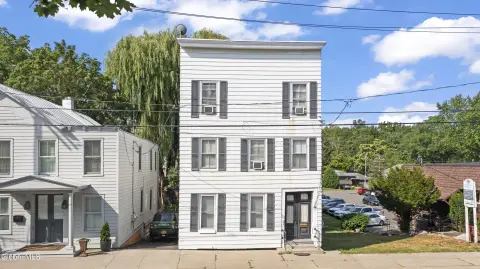
For-sale mixed-use live-work and retail property at 514 Warren Street in Hudson, with nearby Amtrak service.
Property Size4,708 SF
Days on Market210
Property Features for 514 Warren Street
General Information
Standard status
Active
Size
4,708 SF
Property subtype
Mixed Use
Taxes and HOA fees
Annual Taxes
$14,717
Building Details
Building Size
4,708 SF
Year Built
1900
Listing Agency:
Four Seasons Sotheby's Int.
Listed By:
Annabel Taylor
(518) 763-5020
Source:
Tkgre
Added: Mar 27
Changed: Oct 7
Last Checked: Oct 21 at 3:23AM
Displayed information is deemed reliable but is not guaranteed and should be independently verified. All listing content including descriptions, pricing, images are the copyrighted material of Four Seasons Sotheby's Int.

Ask AI about this property
Review the available facts, identify missing information and prepare questions for the agent.
Investment Insights
Based on property information with market context.
514 Warren Street is a for-sale mixed-use live-work and retail property positioned along Hudson’s central, mile-long business corridor on Warren Street. The property is presented as a historic address with character aligned to the buildings that line the street.
According to the remarks, the Warren Street area includes antique and home furnishing shops, art galleries, restaurants, and performance spaces. The Hudson Amtrak station, offering a direct two-hour connection to Manhattan, is described as just blocks away.
The offering is framed as supporting a flexible blend of retail, gallery, hospitality, and residential use, with the next owner offered optionality for how the space can be utilized.
According to the remarks, the Warren Street area includes antique and home furnishing shops, art galleries, restaurants, and performance spaces. The Hudson Amtrak station, offering a direct two-hour connection to Manhattan, is described as just blocks away.
The offering is framed as supporting a flexible blend of retail, gallery, hospitality, and residential use, with the next owner offered optionality for how the space can be utilized.
Key Highlights
- Mixed‑use live‑work and retail property at 514 Warren Street in Hudson
- Built in 1900
- Hudson Amtrak station is just blocks away, with a direct two‑hour connection to Manhattan
Financial Insights
Estimated NOI and Cap Rate
NOI / Yr
$59,490
Cap Rate
5.98%
Suggested Prices Based on Cap Rates
Cap Rate 5%
$1,189,800
$1.2M
Cap Rate 7%
$849,857
$849.9K
Cap Rate 9%
$661,000
$661.0K
Market Conditions
NOI Build-Up for 4,708 SF
Gross rent
$101.7K $21.60/SF
− Vacancy
−$22.4K −$4.75/SF
EGI
$79.3K $16.85/SF
− OpEx
−$19.8K −$4.21/SF
NOI
$59.5K $12.64/SF
Area
Columbia County, NY
Vacancy
22.00%
Lease Rate
$21.60 /SF/Yr
Expense Ratio
25.00%
Simulate Cap Rate and NOI
Suggested Prices Based on Cap Rates
Cap Rate 5%
$1,189,800
Cap Rate 7%
$849,857
Cap Rate 9%
$661,000
Alternative Uses
Best Use
Office B
$849.9K
$743.6K – $991.5K
NOI $59,490 @ 7.0% cap · market cap 5.98%
Second Best
—
—
no second resolved use
Theoretical Best
Office A
$1.16M
$1.02M – $1.36M
NOI $81,535 @ 7.0% cap · market cap 8.19%
Zoning and permitted uses should be independently verified with authorities.
How Realmo checks its estimates
Property Analytics
Who owns this building?
See the owner, sales and loan history
Open Analytics
Current Use
Location Intelligence
Trade Area within ½ mile
1,459
Businesses Nearby
Explore this area
Business Placement
Demographics for 12534, NY
17,539
Population
9,613
Households
1.8
Avg Household Size
46
Median Age
33%
College-Educated
88%
High-School Grad
88.6 sq mi
ZIP Area
198
Density / Sq Mi
$76,086
Median Household Income
$40,823
Median Earnings
$1,296
Median Rent
$260,800
Median Home Value
Check the figures for this property
Cap Rate, Value Estimation, Potential NOI and more
View Realmo Analytics
Market
Vacancy Rate% for Office in Northeast region





Frequently Asked Questions
What type of property is this?
Live-work space - For-sale mixed-use live-work and retail property at 514 Warren Street in Hudson, with nearby Amtrak service.
Where is this live-work space located?
The property is located at 514 Warren Street Hudson, NY.
What is the asking price?
The asking price for this property is $995,000.
What are key features of this property?
This property features: Mixed‑use live‑work and retail property at 514 Warren Street in Hudson; Built in 1900; Hudson Amtrak station is just blocks away, with a direct two‑hour connection to Manhattan


