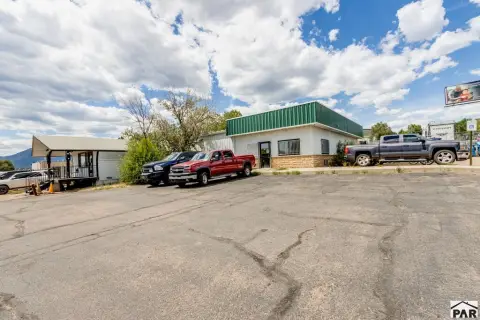
Fully Leased Industrial
For Sale
$3,210,000
3460 Kimball Circle, Colorado Springs, CO 80910
Industrial asset occupied by two publicly traded tenants under NNN and gross lease structures.
Property Size9,636 SF
Lot Size2.74 Acres
Price / SF$333.13
Days on Market134
Property Features for 3460 Kimball Circle
General Information
Standard status
Active
Size
9,636 SF
Lot size
2.74 Acres
Property subtype
Warehouse
Occupancy
100%
Additional Details
Cap Rate
7.25%
Amenities
Fully Occupied, Dock-Served Warehouse Building with a 1.65-Acre Securely Fenced IOS Parcel, with Two Credit Tenants
100% NNN Leased to Strong Publicly Traded Corporations. Brightstar Global Solutions Corporation (NYSE: BRSL) is a Global Leader in Lottery with 6,000 Employees on Six Continents.
Located within Minutes of I-25 and US-24 Offering Direct Regional Connectivity and Prime Access
Building Details
Building Size
9,636 SF
Year Built
1995
Tenancy
Multi
Listing Agency:
Marcus & Millichap - Denver
Listed By:
Cory Gross · License #License(s): CO: FA100038277
(303) 328-2019
Source:
Marcusmillichap
Added: Jun 9
Changed: Oct 14
Last Checked: Oct 19 at 3:17AM
Displayed information is deemed reliable but is not guaranteed and should be independently verified. All listing content including descriptions, pricing, images are the copyrighted material of Marcus & Millichap - Denver

Ask AI about this property
Review the available facts, identify missing information and prepare questions for the agent.
Investment Insights
Based on property information with market context.
3460 & 3485 Kimball Circle is a fully occupied industrial warehouse offering leased to two publicly traded corporations. The property is structured with a combination of NNN and gross lease arrangements, and it is presented as a cash-flowing asset with minimal landlord obligations. The offering includes 9,636 square feet of industrial space across the two addresses listed.
The property is located in Colorado Springs, Colorado at 3460 Kimball Circle (with the paired address at 3485 Kimball Circle). It is described as being about half a mile from a newly expanded South Academy Boulevard. The surrounding area is noted as having $161 million in active infrastructure investment.
For buyers and investors seeking an already-leased industrial asset, this structure-to-occupancy combination can be an efficient way to acquire a tenancy-backed income profile. With two tenants in place and the stated NNN and gross lease mix, the property is positioned to limit day-to-day landlord involvement while maintaining ongoing lease coverage.
The property is located in Colorado Springs, Colorado at 3460 Kimball Circle (with the paired address at 3485 Kimball Circle). It is described as being about half a mile from a newly expanded South Academy Boulevard. The surrounding area is noted as having $161 million in active infrastructure investment.
For buyers and investors seeking an already-leased industrial asset, this structure-to-occupancy combination can be an efficient way to acquire a tenancy-backed income profile. With two tenants in place and the stated NNN and gross lease mix, the property is positioned to limit day-to-day landlord involvement while maintaining ongoing lease coverage.
Key Highlights
- Industrial asset built in 1995 leased to two publicly traded corporations
- Leases are structured NNN and gross lease
- In‑place cap rate of 7.25%
Financial Insights
Estimated NOI and Cap Rate
NOI / Yr
$106,178
Cap Rate
3.31%
Suggested Prices Based on Cap Rates
Cap Rate 5%
$2,123,560
$2.1M
Cap Rate 7%
$1,516,829
$1.5M
Cap Rate 9%
$1,179,756
$1.2M
Market Conditions
NOI Build-Up for 9,636 SF
Gross rent
$130.7K $13.56/SF
− Vacancy
−$5.7K −$0.60/SF
EGI
$124.9K $12.96/SF
− OpEx
−$18.7K −$1.94/SF
NOI
$106.2K $11.02/SF
Area
Colorado Springs, CO
Vacancy
4.40%
Lease Rate
$13.56 /SF/Yr
Expense Ratio
15.00%
Simulate Cap Rate and NOI
Suggested Prices Based on Cap Rates
Cap Rate 5%
$2,123,560
Cap Rate 7%
$1,516,829
Cap Rate 9%
$1,179,756
Alternative Uses
Best Use
Warehouse
$1.52M
$1.33M – $1.77M
NOI $106,178 @ 7.0% cap · market cap 3.31%
Second Best
Industrial
$1.25M
$1.09M – $1.46M
NOI $87,440 @ 7.0% cap · market cap 2.72%
Theoretical Best
Specialty Retail
$1.90M
$1.67M – $2.22M
NOI $133,208 @ 7.0% cap · market cap 4.15%
Zoning and permitted uses should be independently verified with authorities.
How Realmo checks its estimates
Property Analytics
Unlock full access to Insights
Subscribe to Realmo Intelligence
Open Analytics
Current Use
Lease Details
100%
Occupancy
Multi-tenant
Tenancy
Location Intelligence
Trade Area within ½ mile
380
Businesses Nearby
Well-served
Demand for This Use
Explore this area
Business Placement
Demographics for 80910, CO
30,991
Population
13,940
Households
2.2
Avg Household Size
32
Median Age
25%
College-Educated
89%
High-School Grad
6.1 sq mi
ZIP Area
5,080
Density / Sq Mi
$56,681
Median Household Income
$37,110
Median Earnings
$1,299
Median Rent
$276,900
Median Home Value
Check the figures for this property
Cap Rate, Value Estimation, Potential NOI and more
View Realmo Analytics
Market
Vacancy Rate% for Industrial in Colorado Springs, CO




Similar Off Market Nearby
- Front Range MI-BOX — 3825 Silica Dr, Colorado Springs, CO 80910
- Blackwell Storage — 3502 Wabash St, Colorado Springs, CO 80906
- BLACKWELL RV & SELF STORAGE — 3502 Wabash St, Colorado Springs, CO 80906
- A-1 Southwest RV Storage — 3835 Wabash St, Colorado Springs, CO 80906
- SmartStop Self Storage — 3150 Boychuck Ave, Colorado Springs, CO 80910
Frequently Asked Questions
What type of property is this?
Warehouse - Industrial asset occupied by two publicly traded tenants under NNN and gross lease structures.
Where is this warehouse located?
The property is located at 3460 Kimball Circle Colorado Springs, CO.
What is the asking price?
The asking price for this property is $3,210,000.
What are key features of this property?
This property features: Industrial asset built in 1995 leased to two publicly traded corporations; Leases are structured NNN and gross lease; In‑place cap rate of 7.25%