Duplex Portfolio with Private
For Sale
$2,990,000
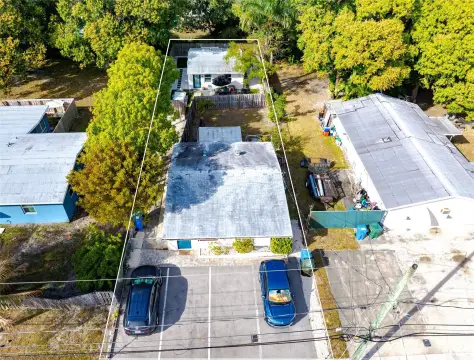
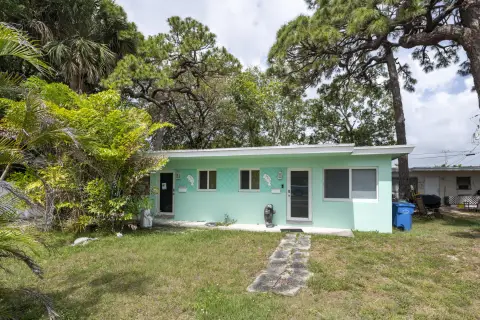
3450-3470 NW 17th Ter, Oakland Park, FL 33309
Residential Income, Oakland Park, FL
Property Size11,652 SF
Price / SF$256.61
Days on Market93
Property Features for 3450-3470 NW 17th Ter
General Information
Property type
Residential Multi Family
Property subtype
Duplex
Zoning description
RM-25
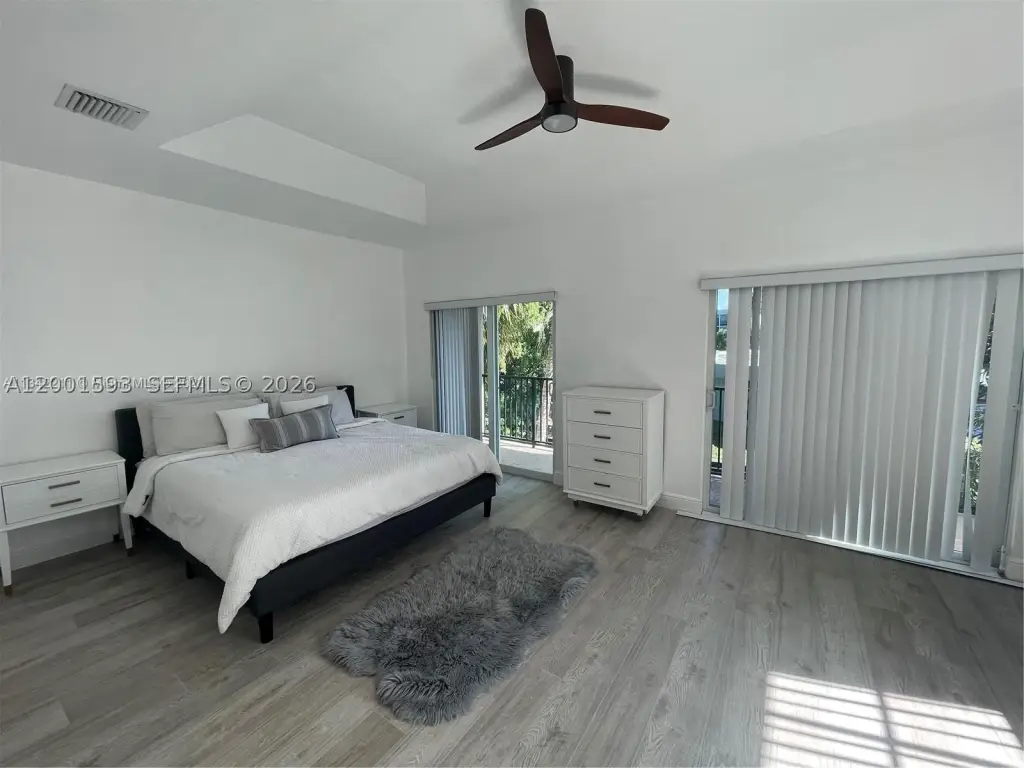
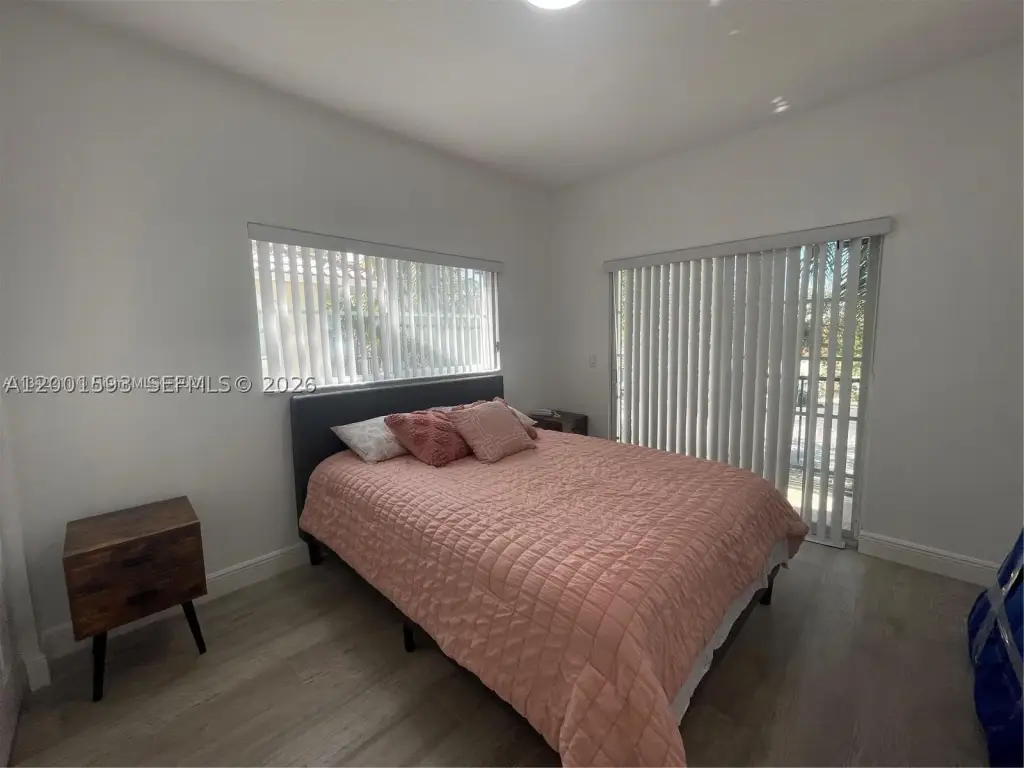
Bedrooms
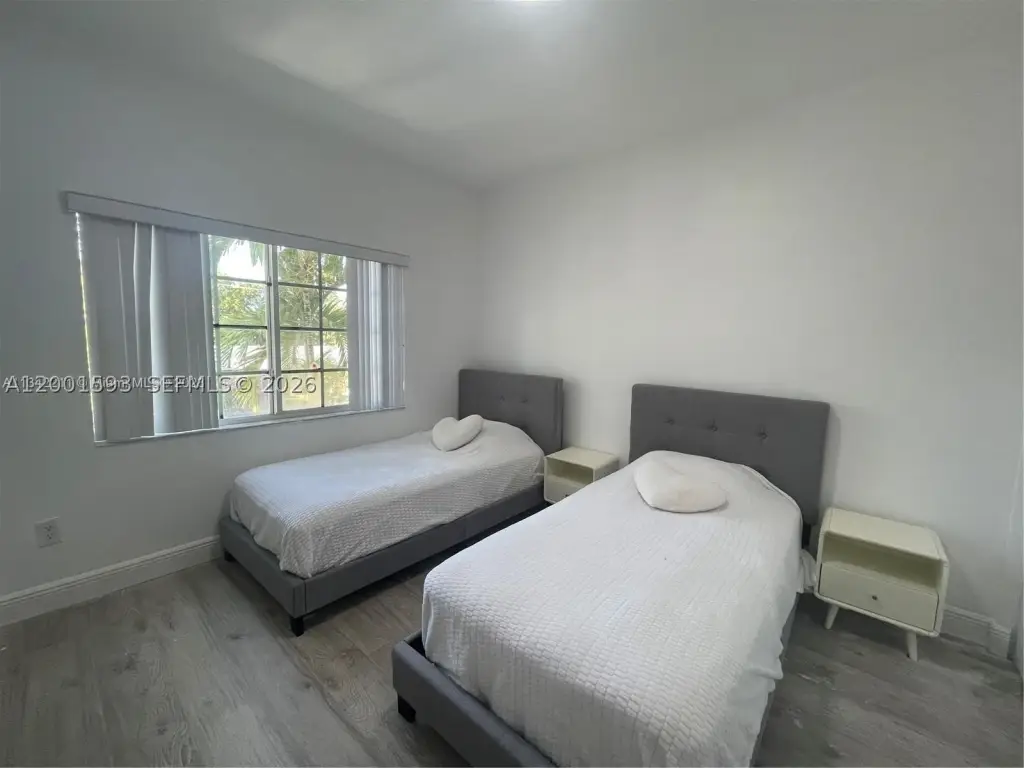
4
Full bathrooms
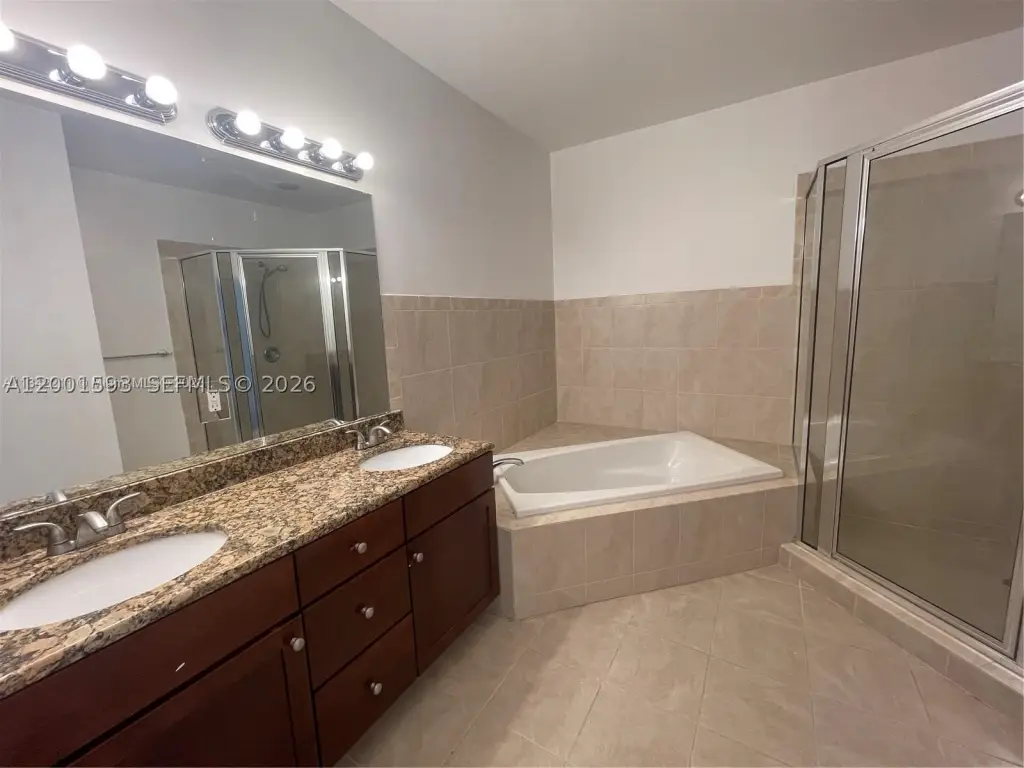
2
Half bathrooms
1
Rooms
Bathroom 3, Bedroom 1, Bedroom 4, Bedroom 2, Bedroom 3, Bathroom 2, Bathroom 1
Parking
12
Patio and Porch features
Deck
Exterior features
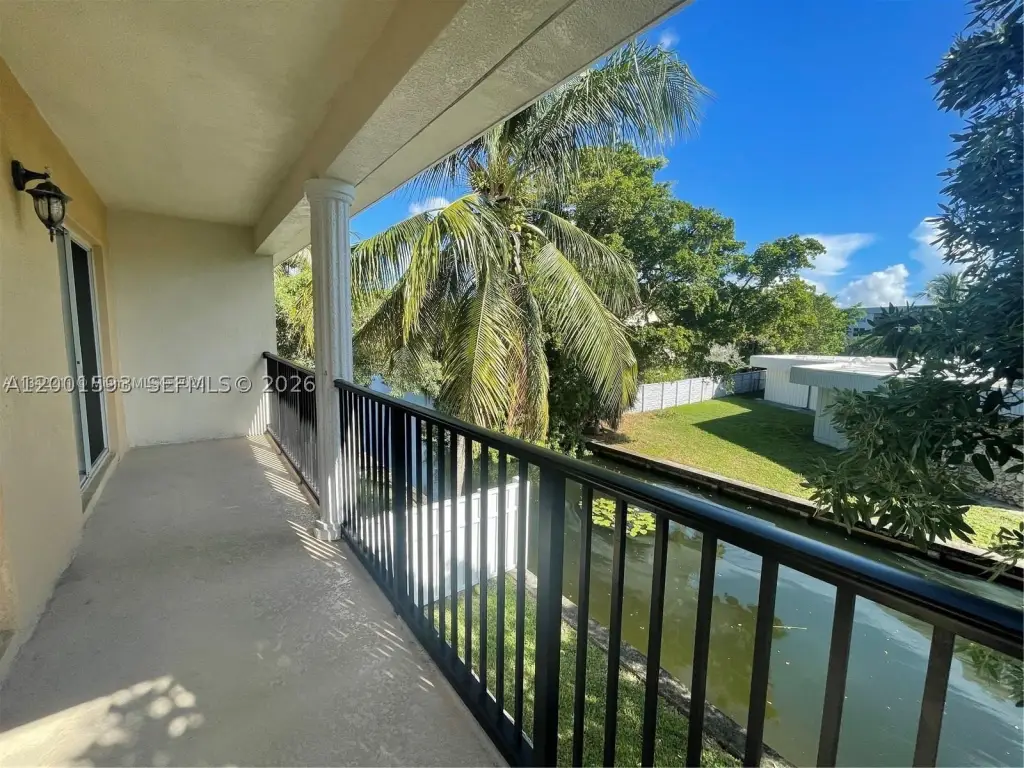
Balcony, Deck
Subdivision
SEACREST ISLES 1 ADD
Lot features
Flood Zone
Standard status
Active
APN
494221230115
Size
11,652 SF
Taxes and HOA fees
Tax Year
2025
Tax Description
SEACREST ISLES 1 ADD 77-40 B ELY 36.73 LOT 12
Tax Annual Amount
10649
Legal Description
SEACREST ISLES 1 ADD 77-40 B ELY 36.73 LOT 12
Utilities
Utilities
Cable Available
Sewer type
Public Sewer
Heating system
Electric (Heating), Central
Cooling system
Electric, Central Air
Water source
Public
Water front
1
Building Details
Year built
2007
Floors in Building
2
Flooring type
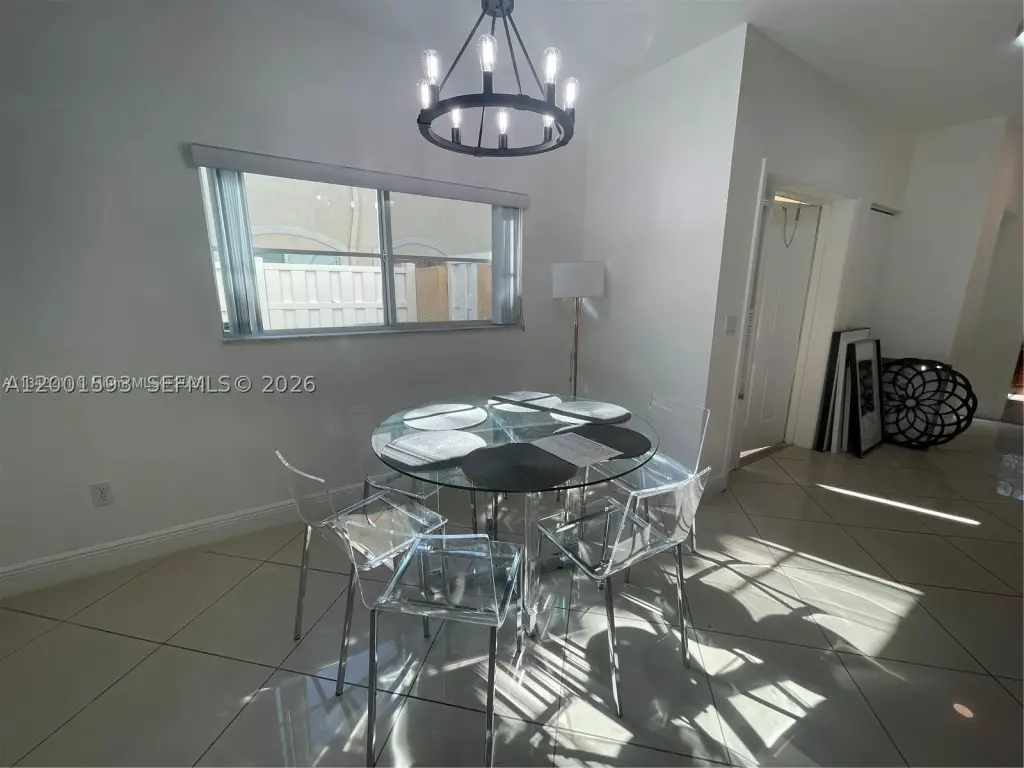
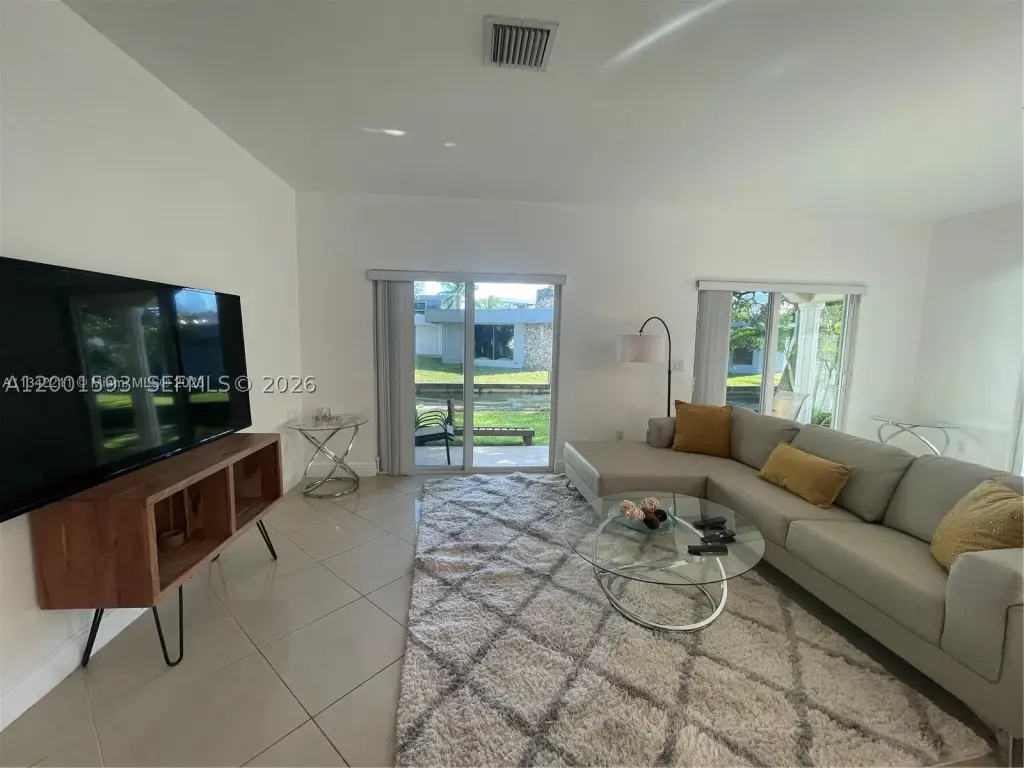
Tile - Porcelian
Building materials
CBS (Concrete Block Structure), Block
Roof type
Barrel
Listing Agency:
United Realty Group Inc
(954) 450-2000
Listed By:
Alain Arwas · License #3209269
(954) 673-6415
Added: Jul 25
Changed: Oct 19
Last Checked: Oct 25 at 2:06PM
MLS# A12001593
Copyright © 2026 Miami REALTORS®. All rights reserved. All information provided by the listing agent/broker is deemed reliable but is not guaranteed and should be independently verified.

Ask AI about this property
Review the available facts, identify missing information and prepare questions for the agent.
Investment Insights
Based on property information with market context.
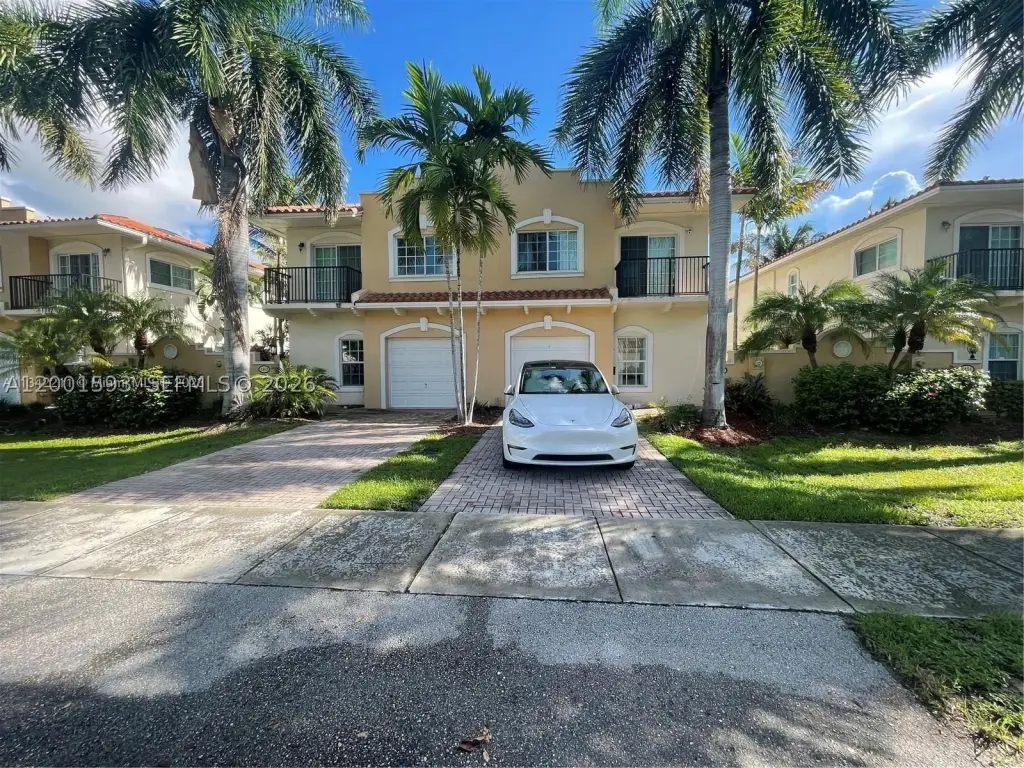
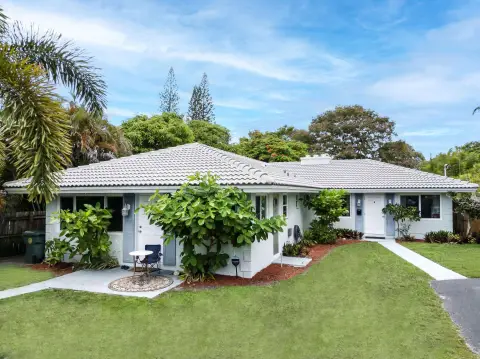
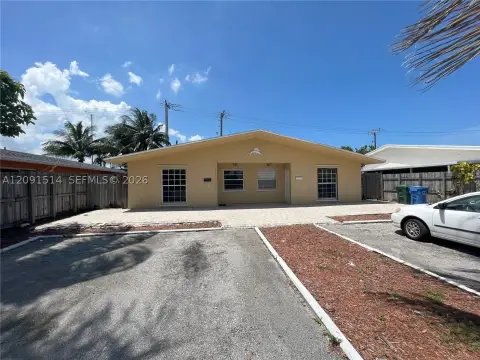
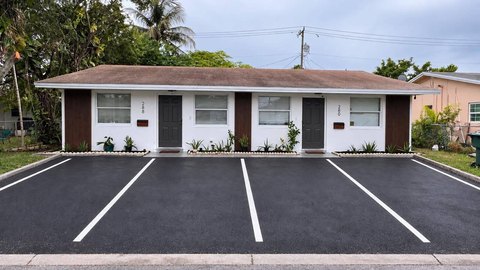
This Oakland Park offering combines six side-by-side homes in one package. Built in 2007, each residence contains 1,947 square feet of living area, four bedrooms, 2.5 bathrooms, and a garage. Individual electric and water meters serve each home, and each has its own folio number. There are no HOA fees.
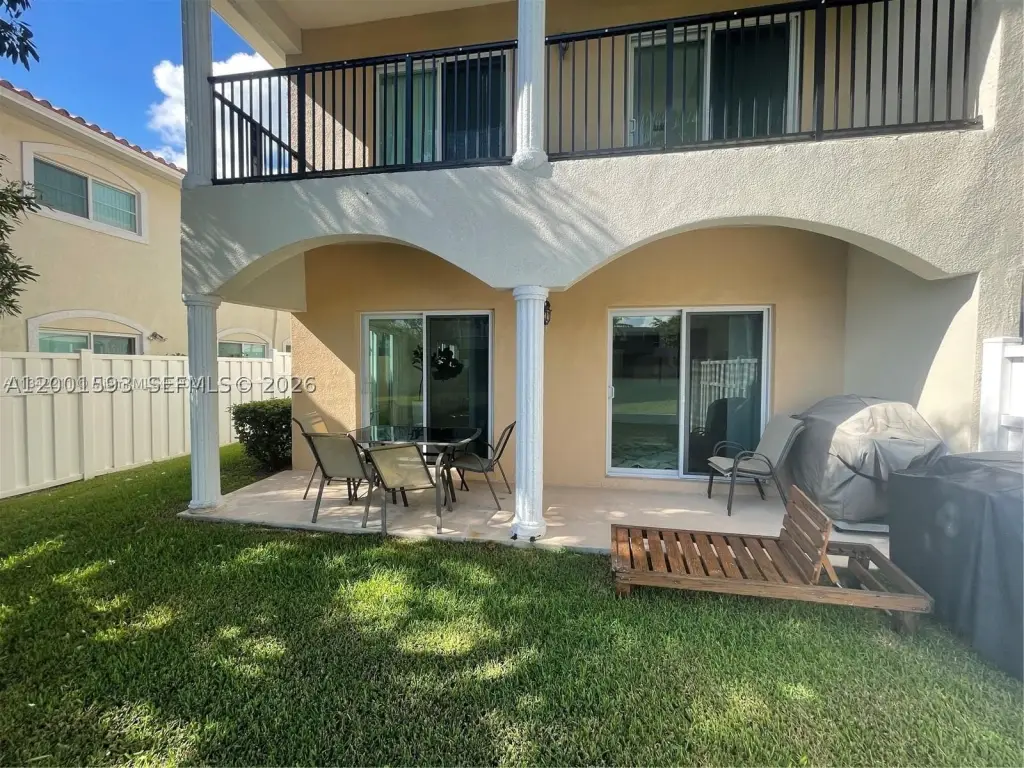
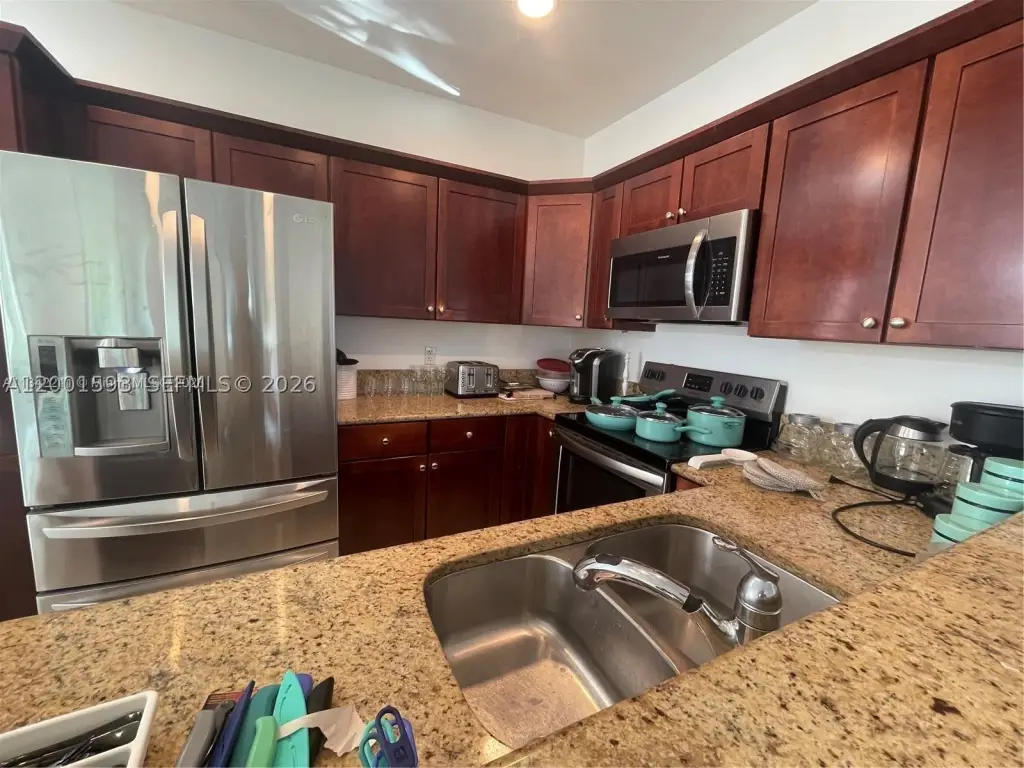
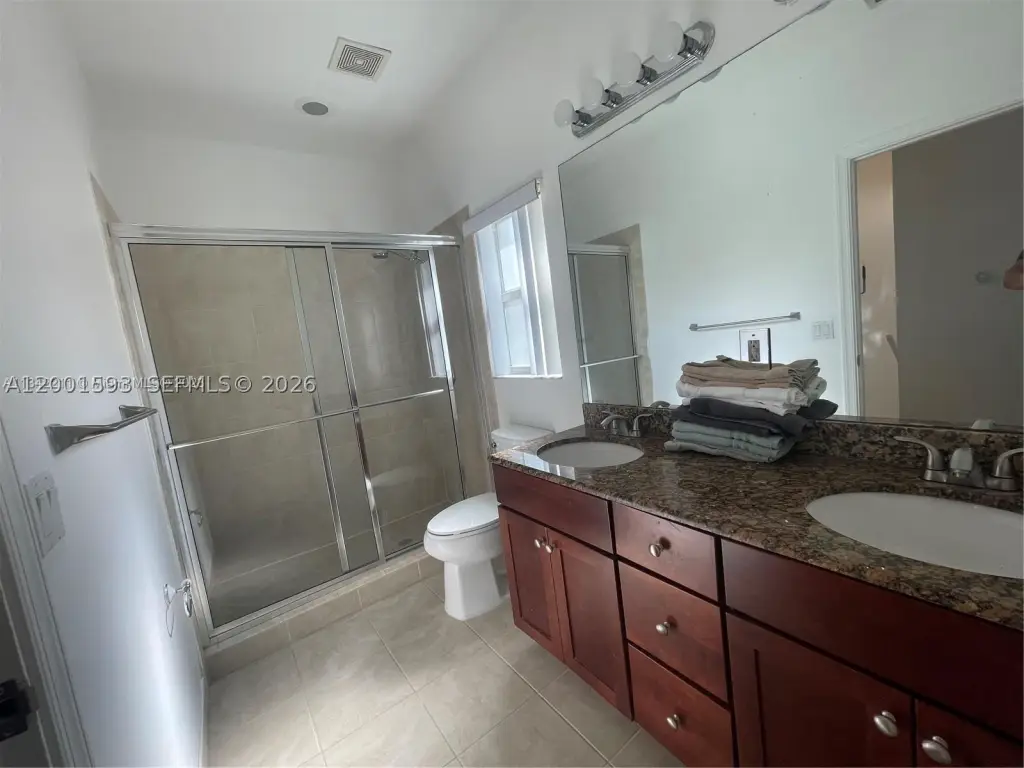
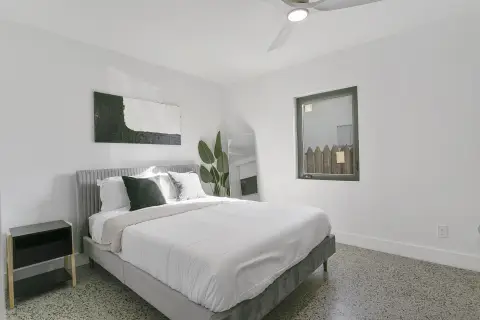
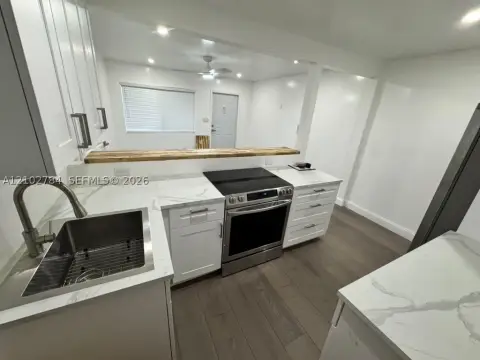
Interior details include high-impact glass windows, 9-foot ceilings, a staircase skylight, and granite kitchen countertops. Each home also features a primary suite with a Roman tub, along with a private balcony and patio with water views. The homes sit on a cul-de-sac, with parks nearby.
Interior details include high-impact glass windows, 9-foot ceilings, a staircase skylight, and granite kitchen countertops. Each home also features a primary suite with a Roman tub, along with a private balcony and patio with water views. The homes sit on a cul-de-sac, with parks nearby.
Key Highlights
- Six side‑by‑side homes offered together
- Each home has 1,947 square feet of living area, four bedrooms, and 2.5 bathrooms
- Built in 2007; each residence includes a garage
Financial Insights
Estimated NOI and Cap Rate
NOI / Yr
$194,237
Cap Rate
6.50%
Suggested Prices Based on Cap Rates
Cap Rate 5%
$3,884,740
$3.9M
Cap Rate 7%
$2,774,814
$2.8M
Cap Rate 9%
$2,158,189
$2.2M
Market Conditions
NOI Build-Up for 11,652 SF
Gross rent
$293.6K $25.20/SF
− Vacancy
−$16.1K −$1.39/SF
EGI
$277.5K $23.81/SF
− OpEx
−$83.2K −$7.14/SF
NOI
$194.2K $16.67/SF
Area
Broward County, FL
Vacancy
5.50%
Lease Rate
$25.20 /SF/Yr
Expense Ratio
30.00%
Simulate Cap Rate and NOI
Suggested Prices Based on Cap Rates
Cap Rate 5%
$3,884,740
Cap Rate 7%
$2,774,814
Cap Rate 9%
$2,158,189
Alternative Uses
Best Use
Multifamily LT 5
$2.77M
$2.43M – $3.24M
NOI $194,237 @ 7.0% cap · market cap 6.50%
Second Best
Apartment 5plus
$2.56M
$2.24M – $2.99M
NOI $179,200 @ 7.0% cap · market cap 5.99%
Theoretical Best
Office A
$5.91M
$5.17M – $6.90M
NOI $413,809 @ 7.0% cap · market cap 13.84%
Zoning and permitted uses should be independently verified with authorities.
How Realmo checks its estimates
Property Analytics
Who owns this building?
See the owner, sales and loan history
Open Analytics
Lease Details
6
Residential units
Yes
Utilities to site
Location Intelligence
Trade Area within ½ mile
1,360
Businesses Nearby
Explore this area
Business Placement
Demographics for 33309, FL
37,642
Population
14,783
Households
2.5
Avg Household Size
39
Median Age
23%
College-Educated
85%
High-School Grad
9.7 sq mi
ZIP Area
3,881
Density / Sq Mi
$73,496
Median Household Income
$35,850
Median Earnings
$1,829
Median Rent
$309,100
Median Home Value
Check the figures for this property
Cap Rate, Value Estimation, Potential NOI and more
View Realmo Analytics
Market
Vacancy Rate% for Multifamily in South region





Frequently Asked Questions
What type of property is this?
Duplex - Six individually metered residences offer four-bedroom layouts, garages, and no HOA fees.
Where is this duplex located?
The property is located at 3450-3470 NW 17th Ter Oakland Park, FL.
What is the asking price?
The asking price for this property is $2,990,000.
What are key features of this property?
This property features: Six side‑by‑side homes offered together; Each home has 1,947 square feet of living area, four bedrooms, and 2.5 bathrooms; Built in 2007; each residence includes a garage


