Flex Space With Secured
For Sale
$2,850,000
2930 NW 17th Ter, Oakland Park, FL 33311
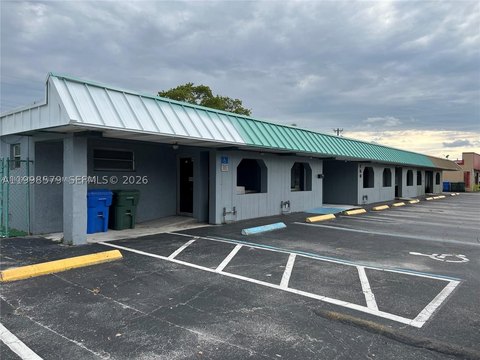
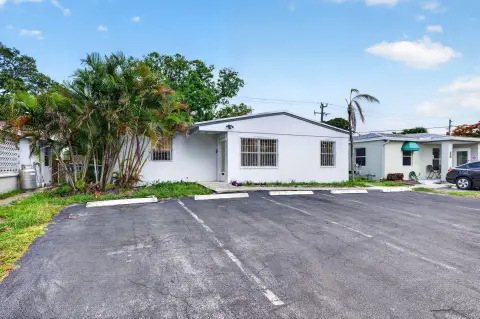
Multi-level commercial property with separate entrances, private offices, storage areas, and a secured yard for vehicle or equipment parking.
Property Size3,300 SF
Lot Size0.31 Acres
Price / SF$859.99
Days on Market58
Property Features for 2930 NW 17th Ter
General Information
Standard status
Active
Size
3,300 SF
Lot size
0.31 Acres
Site & Location
Highway Access
Yes
Fenced Yard
Yes
Outdoor Storage
Yes
Amenities
3 separate entrances
secured yard
conference/break room
bathroom with shower
undercover storage
storage garage
Building Details
Year Built
1991
Buildings
1
Stories
2
Building Size
3,300 SF
Listing Agency:
SEF Real Estate Group
Listed By:
Sonya Gomez · License #BK3324930
(954) 927-7707
Source:
Mymiahomes
Added: Aug 28
Changed: Oct 2
Last Checked: Oct 7 at 3:58PM
Displayed information is deemed reliable but is not guaranteed and should be independently verified. All listing content including descriptions, pricing, images are the copyrighted material of SEF Real Estate Group

Ask AI about this property
Review the available facts, identify missing information and prepare questions for the agent.
Investment Insights
Based on property information with market context.
This flex space includes approximately 3,300 square feet across multiple levels, with three separate entrances that may support independent occupancy or leasing of portions of the property. The lower level includes three private offices, an open reception area, and a half bath. Upstairs are three additional private offices, a conference or break room, and a bathroom with shower. A front private office with a half bath is also included.
The 13,400-square-foot lot features a secured yard suitable for boat, automobile, equipment, or commercial vehicle parking. Additional improvements include approximately 1,200 square feet of undercover storage and a 1,000-square-foot storage garage. The property is in Fort Lauderdale near I-95 and Oakland Park Boulevard and was built in 1991.
The 13,400-square-foot lot features a secured yard suitable for boat, automobile, equipment, or commercial vehicle parking. Additional improvements include approximately 1,200 square feet of undercover storage and a 1,000-square-foot storage garage. The property is in Fort Lauderdale near I-95 and Oakland Park Boulevard and was built in 1991.
Key Highlights
- Flex space with approximately 3,300 SF of building area
- 13,400 SF lot with a secured yard
- Three separate entrances may allow portions to be used or leased independently
Financial Insights
Estimated NOI and Cap Rate
NOI / Yr
$87,838
Cap Rate
3.08%
Suggested Prices Based on Cap Rates
Cap Rate 5%
$1,756,760
$1.8M
Cap Rate 7%
$1,254,829
$1.3M
Cap Rate 9%
$975,978
$976.0K
Market Conditions
NOI Build-Up for 3,314 SF
Gross rent
$151.1K $45.60/SF
− Vacancy
−$34.0K −$10.26/SF
EGI
$117.1K $35.34/SF
− OpEx
−$29.3K −$8.84/SF
NOI
$87.8K $26.51/SF
Area
Broward County, FL
Vacancy
22.50%
Lease Rate
$45.60 /SF/Yr
Expense Ratio
25.00%
Simulate Cap Rate and NOI
Suggested Prices Based on Cap Rates
Cap Rate 5%
$1,756,760
Cap Rate 7%
$1,254,829
Cap Rate 9%
$975,978
Alternative Uses
Best Use
Office B
$1.25M
$1.10M – $1.46M
NOI $87,838 @ 7.0% cap · market cap 3.08%
Second Best
Flex RnD
$1.04M
$911.2K – $1.21M
NOI $72,895 @ 7.0% cap · market cap 2.56%
Theoretical Best
Office A
$1.68M
$1.47M – $1.96M
NOI $117,693 @ 7.0% cap · market cap 4.13%
Zoning and permitted uses should be independently verified with authorities.
How Realmo checks its estimates
Property Analytics
Contact the owner directly
Get the owner's phone numbers and email
Open Analytics
Current Use
Lease Details
Yes
Fenced yard
Yes
Highway access
Location Intelligence
Trade Area within ½ mile
1,268
Businesses Nearby
Under-served
Demand for This Use
Explore this area
Business Placement
Demographics for 33311, FL
69,413
Population
27,330
Households
2.5
Avg Household Size
37
Median Age
18%
College-Educated
81%
High-School Grad
10.4 sq mi
ZIP Area
6,674
Density / Sq Mi
$51,918
Median Household Income
$32,717
Median Earnings
$1,385
Median Rent
$276,600
Median Home Value
Check the figures for this property
Cap Rate, Value Estimation, Potential NOI and more
View Realmo Analytics
Market
Vacancy Rate% for Office in South region




Similar Off Market Nearby
- Pretty chefs international — 2001 W Oakland Park Blvd, Oakland Park, FL 33311
Frequently Asked Questions
What type of property is this?
Flex space - Multi-level commercial property with separate entrances, private offices, storage areas, and a secured yard for vehicle or equipment parking.
Where is this flex space located?
The property is located at 2930 NW 17th Ter Oakland Park, FL.
What is the asking price?
The asking price for this property is $2,850,000.
What are key features of this property?
This property features: Flex space with approximately 3,300 SF of building area; 13,400 SF lot with a secured yard; Three separate entrances may allow portions to be used or leased independently


