Historic Office Building with
For Sale
Contact for pricing
340 N Main Ave, Tucson, AZ 85701
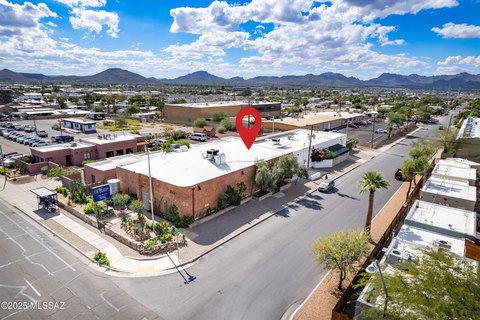
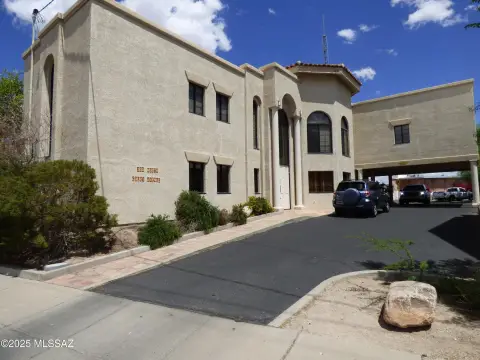
Two-story historic office building with original upper floors, a modern refurbished lower level, and an on-site freestanding casita.
Property Size8,002 SF
Price / SF$299.93
Days on Market111
Property Features for 340 N Main Ave
General Information
Standard status
Active
Size
8,002 SF
Class
B
Total Parking Spaces
16
Property subtype
Office
Zoning
HO-3, City of Tucson
Building Details
Year Built
1902
Buildings
2
Stories
2
Units
16
Listing Agency:
CBRE - Tucson
Listed By:
Jeff Casper · License #632063
(520) 307-2336
Source:
Crexi
Added: Jun 18
Changed: Sep 29
Last Checked: Oct 5 at 4:33PM
Displayed information is deemed reliable but is not guaranteed and should be independently verified. All listing content including descriptions, pricing, images are the copyrighted material of CBRE - Tucson
Investment Insights
Based on property information with market context.
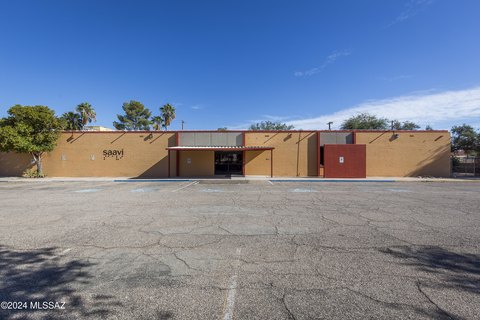
Historic Hereford House, built in 1902, offers a main two-story office building with original character features on floors one and two. The lower level has been completely refurbished with modern improvements, along with ground-level entry and windows for convenient access and natural light.
The property is located in Historic Snob Hollow at 340 N Main Ave, Tucson, AZ 85701. It sits adjacent to the Owl’s Club and was designed by the same architect, adding to its distinctive historic context.
This property is well suited for buyers seeking an office setting with architectural character and thoughtfully updated space, including a refurbished lower level that can support day-to-day operational needs. The freestanding casita onsite provides an additional enclosed option that may support a separate office, visitor use, or other light commercial or professional arrangement depending on the buyer’s plans.
The property is located in Historic Snob Hollow at 340 N Main Ave, Tucson, AZ 85701. It sits adjacent to the Owl’s Club and was designed by the same architect, adding to its distinctive historic context.
This property is well suited for buyers seeking an office setting with architectural character and thoughtfully updated space, including a refurbished lower level that can support day-to-day operational needs. The freestanding casita onsite provides an additional enclosed option that may support a separate office, visitor use, or other light commercial or professional arrangement depending on the buyer’s plans.
Key Highlights
- Historic office building built in 1902 with original features on the 1st and 2nd floors
- Main two‑story layout with a completely refurbished lower level featuring modern features
- Lower level has ground‑level entry and windows
Financial Insights
Estimated NOI and Cap Rate
NOI / Yr
$116,928
Cap Rate
4.87%
Suggested Prices Based on Cap Rates
Cap Rate 5%
$2,338,560
$2.3M
Cap Rate 7%
$1,670,400
$1.7M
Cap Rate 9%
$1,299,200
$1.3M
Market Conditions
NOI Build-Up for 8,002 SF
Gross rent
$172.8K $21.60/SF
− Vacancy
−$16.9K −$2.12/SF
EGI
$155.9K $19.48/SF
− OpEx
−$39.0K −$4.87/SF
NOI
$116.9K $14.61/SF
Area
Tucson, AZ
Vacancy
9.80%
Lease Rate
$21.60 /SF/Yr
Expense Ratio
25.00%
Simulate Cap Rate and NOI
Suggested Prices Based on Cap Rates
Cap Rate 5%
$2,338,560
Cap Rate 7%
$1,670,400
Cap Rate 9%
$1,299,200
Alternative Uses
Best Use
Office B
$1.67M
$1.46M – $1.95M
NOI $116,928 @ 7.0% cap · market cap 4.87%
Second Best
—
—
no second resolved use
Theoretical Best
Office A
$2.08M
$1.82M – $2.43M
NOI $145,511 @ 7.0% cap · market cap 6.06%
Zoning and permitted uses should be independently verified with authorities.
Property Analytics
Unlock full access to Insights
Subscribe to Realmo Intelligence
Open Analytics
Current Use
Location Intelligence
Trade Area within ½ mile
3,583
Businesses Nearby
Explore this area
Business Placement
Demographics for 85701, AZ
5,132
Population
3,631
Households
1.4
Avg Household Size
37
Median Age
57%
College-Educated
91%
High-School Grad
1.5 sq mi
ZIP Area
3,421
Density / Sq Mi
$52,672
Median Household Income
$43,762
Median Earnings
$1,183
Median Rent
$451,500
Median Home Value
Check the figures for this property
Cap Rate, Value Estimation, Potential NOI and more
View Realmo Analytics
Market
Vacancy Rate% for Office in Tucson, AZ

Questions? Ask Rey
Realmo’s AI knows this listing — price, zoning, demand, history. Ask anything.




Frequently Asked Questions
What type of property is this?
Office building - Two-story historic office building with original upper floors, a modern refurbished lower level, and an on-site freestanding casita.
Where is this office building located?
The property is located at 340 N Main Ave Tucson, AZ.
What is the asking price?
The asking price for this property is $2,400,000.
What are key features of this property?
This property features: Historic office building built in 1902 with original features on the 1st and 2nd floors; Main two‑story layout with a completely refurbished lower level featuring modern features; Lower level has ground‑level entry and windows



