Class A Professional Office
For Sale
Contact for pricing
1980 E Fort Lowell Rd, Tucson, AZ
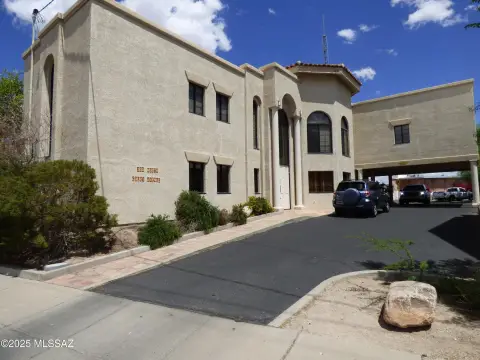
Professional office building with high-end amenities and secured parking.
Property Size8,054 SF
Lot Size0.60 Acres
Price / SF$186.24
Days on Market315
Property Features for 1980 E Fort Lowell Rd
General Information
Standard status
Active
Size
8,054 SF
Lot size
0.60 Acres
Property subtype
OFFICE
Listing Agency:
CBRE | Tucson
(520) 323-5100
Listed By:
Jeff Casper · License #632063
(520) 307-2336
Source:
Moodyscre
Added: Nov 25, 2025
Changed: Aug 8
Last Checked: Aug 8 at 12:45PM
Displayed information is deemed reliable but is not guaranteed and should be independently verified. All listing content including descriptions, pricing, images are the copyrighted material of CBRE | Tucson
Investment Insights
Based on property information with market context.
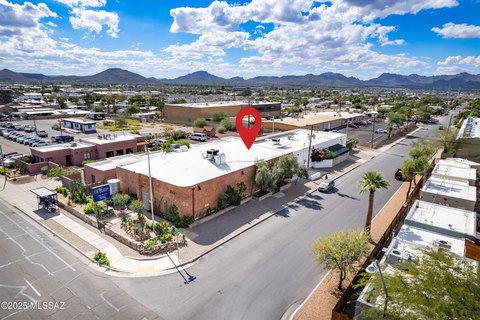
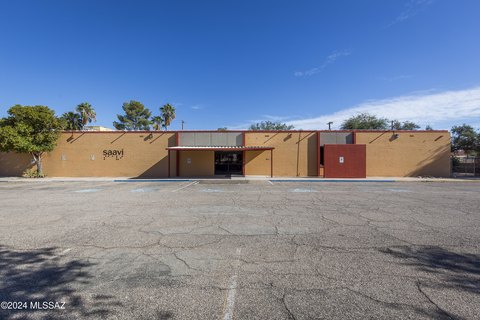
This Class A professional office building, designed by a leading law firm, presents an opportunity for an owner-user or investor. The first floor offers approximately 4,027 square feet and is vacant, allowing for immediate occupancy. It can be divided for two tenants by incorporating a storage area. The second floor, also approximately 4,027 square feet, will be available for occupancy in 45 days. The flexible floor plan includes a conference room, library, and private offices, with both elevator and stair access. High-end amenities are present throughout the building, and numerous large windows provide ample natural light. A secured parking lot offers 32 parking spaces, including 14 covered reserved spaces, providing abundant at-door parking. The property benefits from significant building signage and outstanding visibility. It is located near the high-traffic 'Campbell Corridor,' offering excellent access to Downtown, the University of Arizona, and the Foothills. Built in 2003, the property is zoned O-2 in the City of Tucson, with a tax parcel number of 112-05-047B and 2024 real estate taxes of $23,720. The property size is 8,054 square feet.
Key Highlights
- Vacant 1st Floor (±4,027 SF) available for immediate occupancy, suitable for owner‑user or investor.
- Secured parking lot with 32 spaces provides abundant at‑door parking, including 14 covered reserved spaces.
- Significant building signage and outstanding visibility in the high‑traffic 'Campbell Corridor'.
Financial Insights
Estimated NOI and Cap Rate
NOI / Yr
$117,688
Cap Rate
7.85%
Suggested Prices Based on Cap Rates
Cap Rate 5%
$2,353,760
$2.4M
Cap Rate 7%
$1,681,257
$1.7M
Cap Rate 9%
$1,307,644
$1.3M
Market Conditions
NOI Build-Up for 8,054 SF
Gross rent
$174.0K $21.60/SF
− Vacancy
−$17.0K −$2.12/SF
EGI
$156.9K $19.48/SF
− OpEx
−$39.2K −$4.87/SF
NOI
$117.7K $14.61/SF
Area
Tucson, AZ
Vacancy
9.80%
Lease Rate
$21.60 /SF/Yr
Expense Ratio
25.00%
Simulate Cap Rate and NOI
Suggested Prices Based on Cap Rates
Cap Rate 5%
$2,353,760
Cap Rate 7%
$1,681,257
Cap Rate 9%
$1,307,644
Alternative Uses
Best Use
Office B
$1.68M
$1.47M – $1.96M
NOI $117,688 @ 7.0% cap · market cap 7.85%
Second Best
—
—
no second resolved use
Theoretical Best
Office A
$2.09M
$1.83M – $2.44M
NOI $146,457 @ 7.0% cap · market cap 9.76%
Zoning and permitted uses should be independently verified with authorities.
Property Analytics
Unlock full access to Insights
Subscribe to Realmo Intelligence
Open Analytics
Current Use
Location Intelligence
Trade Area within ½ mile
1,266
Businesses Nearby
Explore this area
Business Placement
Check the figures for this property
Cap Rate, Value Estimation, Potential NOI and more
View Realmo Analytics
Market
Vacancy Rate% for Office in Tucson, AZ

Questions? Ask Rey
Realmo’s AI knows this listing — price, zoning, demand, history. Ask anything.






Frequently Asked Questions
What type of property is this?
Office building - Professional office building with high-end amenities and secured parking.
Where is this office building located?
The property is located at 1980 E Fort Lowell Rd Tucson, AZ.
What is the asking price?
The asking price for this property is $1,500,000.
What are key features of this property?
This property features: Vacant 1st Floor (±4,027 SF) available for immediate occupancy, suitable for owner‑user or investor.; Secured parking lot with 32 spaces provides abundant at‑door parking, including 14 covered reserved spaces.; Significant building signage and outstanding visibility in the high‑traffic 'Campbell Corridor'.



